Motion Simulation Market Size and Share Forecast Outlook 2025 to 2035

The Motion Simulation Market is estimated to be valued at USD 27.7 billion in 2025 and is projected to reach USD 77.4 billion by 2035, registering a compound annual growth rate (CAGR) of 10.8% over the forecast period.
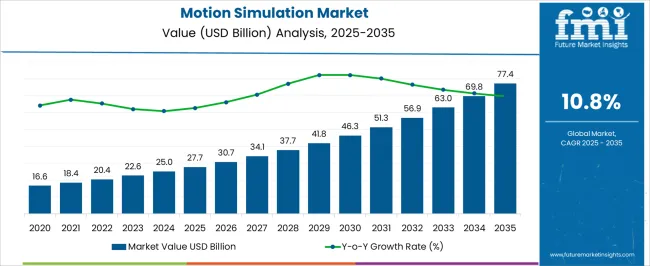
Quick Stats for Motion Simulation Market

  • Motion Simulation Market Industry Value (2025): USD 27.7 billion
  • Motion Simulation Market Forecast Value (2035): USD 77.4 billion
  • Motion Simulation Market Forecast CAGR: 10.8%
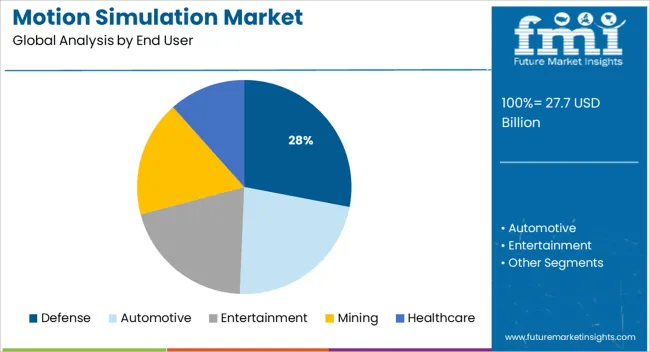
  • Leading Segment in Motion Simulation Market in 2025: Defense (28.0%)
  • Key Growth Region in Motion Simulation Market: North America, Asia-Pacific, Europe
  • Top Key Players in Motion Simulation Market: CAE Inc., Bosch Rexroth AG, Siemens Industry Software B.V., Dassault Systèmes, Laerdal Medical, Moog Inc., Gaumard Scientific, Cubic Corporation, Human Solutions, Thoroughbred Technologies

Motion Simulation Market Market Value Analysis

Metric Value
Motion Simulation Market Estimated Value in (2025 E) USD 27.7 billion
Motion Simulation Market Forecast Value in (2035 F) USD 77.4 billion
Forecast CAGR (2025 to 2035) 10.8%

Rationale for Segmental Growth in the Motion Simulation Market

Market Overview

The motion simulation market is witnessing steady expansion, supported by increased demand for high-fidelity virtual training, operational cost reduction, and risk mitigation across critical sectors. Continued emphasis on safety, situational awareness, and performance optimization in environments like aerospace, defense, and automotive is fueling investments in simulation platforms.

Advancements in hardware precision, real-time response systems, and immersive feedback mechanisms have improved realism and training effectiveness. Regulatory initiatives promoting simulator-based certifications and skill development have also broadened institutional adoption.

With the integration of AI, machine learning, and sensor-based calibration, simulation systems are being tailored for real-world responsiveness and cross-domain applications. Future growth is expected to be driven by modular system design, hybrid motion cueing technologies, and the rising penetration of simulation in commercial and consumer applications.

Segmental Analysis

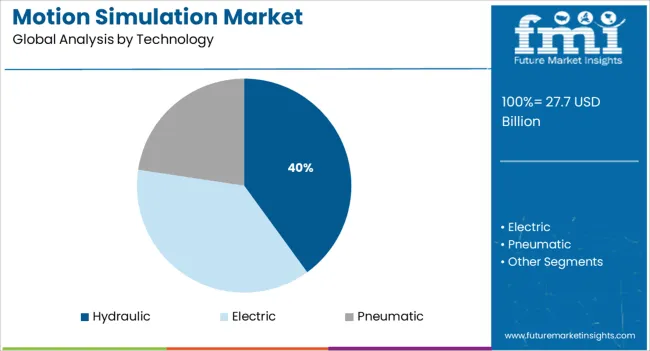
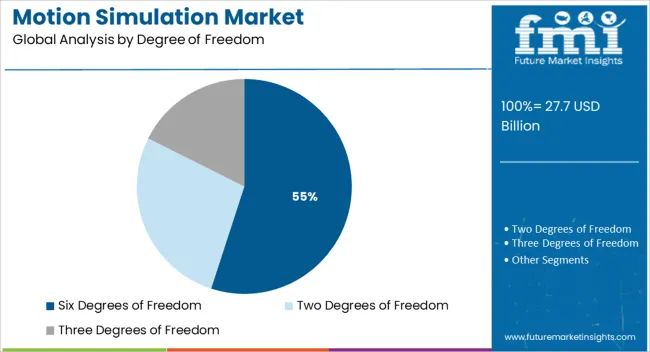
The market is segmented by End User, Technology, and Degree of Freedom and region. By End User, the market is divided into Defense, Automotive, Entertainment, Mining, and Healthcare. In terms of Technology, the market is classified into Hydraulic, Electric, and Pneumatic. Based on Degree of Freedom, the market is segmented into Six Degrees of Freedom, Two Degrees of Freedom, and Three Degrees of Freedom. Regionally, the market is classified into North America, Latin America, Western Europe, Eastern Europe, Balkan & Baltic Countries, Russia & Belarus, Central Asia, East Asia, South Asia & Pacific, and the Middle East & Africa.
Insights into the Defense End User Segment

Motion Simulation Market Analysis By End User

The defense segment is projected to hold 28.0% of the total market revenue in 2025, making it a key contributor to motion simulation demand. Its prominence is attributed to the growing reliance on simulation-based combat readiness, mission rehearsal, and tactical training.

Heightened geopolitical tensions and the need to optimize training costs without compromising safety have driven widespread adoption across air, land, and naval platforms. Motion simulators enable realistic combat scenario replication, equipment familiarization, and rapid response conditioning—critical for defense forces facing modern asymmetric threats.

Continued investments in joint training environments and cross-border interoperability have further reinforced the role of simulation in defense training doctrine. As governments seek to modernize legacy systems and improve troop readiness, motion simulation remains central to long-term defense infrastructure planning.
Insights into the Hydraulic Technology Segment

Motion Simulation Market Analysis By Technology

Hydraulic-based systems are expected to account for 40.0% of total market revenue in 2025, leading the technology segment. This leadership is underpinned by their superior load-bearing capabilities, responsiveness under extreme force conditions, and smooth motion translation across a range of applications.

Hydraulic motion platforms are especially valued in high-stress training environments where durability and high force feedback are essential, such as military aviation and heavy vehicle simulation. Their ability to deliver realistic acceleration and deceleration cues, along with high payload capacity, has made them a preferred choice for full-motion simulators.

While maintenance requirements remain relatively high, advancements in leak-proof sealing, noise control, and system integration have enhanced overall reliability. As mission-critical industries continue to require robust simulation fidelity, hydraulic systems are expected to retain their relevance.
Insights into the Six Degrees of Freedom Segment

Motion Simulation Market Analysis By Degree Of Freedom

Systems with six degrees of freedom are forecast to hold 55.0% of market revenue in 2025, emerging as the dominant configuration in motion simulation. This segment's growth is being driven by its ability to replicate full-range spatial movement, including roll, pitch, yaw, surge, heave, and sway, which is essential for immersive and precision-critical applications.

Such configurations allow operators to experience real-time dynamic feedback in multi-axis environments, closely mimicking real-world conditions. Industries such as aerospace, defense, and motorsport have increasingly adopted these systems for enhanced training accuracy, design validation, and operator conditioning.

The ongoing miniaturization of actuators and adoption of real-time physics engines have further improved performance and realism. With cross-sector demand for more complex simulations, systems with six degrees of freedom are expected to remain the gold standard in motion fidelity and experiential depth.

Restraints for the Motion Simulation Market

Lack of validity in some cases

In spite of all the advantages provided by motion simulation, there are a lot of cases where the outcome of the test conducted in the simulated environment was very much different from that obtained when the product/service was put into application on a real-time basis.

Works on the principle of one size fit all

When the sample test is being conducted under simulated conditions, there are chances that the outcome is entirely based only on the available samples, instead of working on the larger good. This might create complications in the process going further, and the output might not match the set standards.

Regional Insights for the Motion Simulation Market

How is the North America Motion Simulation Market expected to perform during the Forecast Period?

The North America motion simulation market is expected to be the largest market during the forecast period. In 2024, the region held a market share of 37.6%.

The motion simulation market is mainly used in the defence sector in North America.

Based on the reports, it was found that the USA alone spent a whopping USD 801 billion to expand its defence capabilities. Additionally, the defence sector makes heavy investments in the usage of motion simulation. Apart from that, motion simulation is being increasingly implemented in the gaming sector in the region.
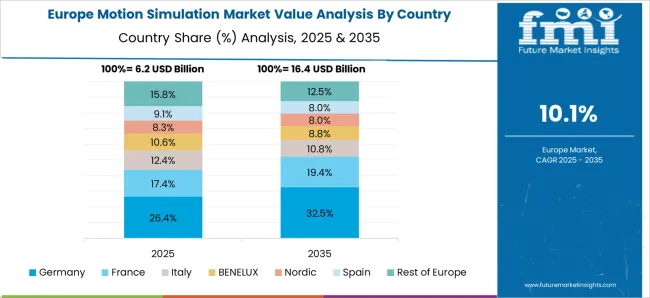
What is the Current Scenario of the Europe Motion Simulation Market?

Motion Simulation Market Europe Country Market Share Analysis, 2025 & 2035

The Europe motion simulation market is expected to be one of the most critical markets for motion simulation during the forecast period. Europe had a market share of 22.3% in 2024.

In Europe as well, motion simulation is being increasingly employed for the defence sector.

However, motion simulation is being increasingly employed in the healthcare sector in the region. For example, Polhemus delivers six degrees of freedom motion measurement systems and handheld 3D laser scanners, which are used in medical simulation systems, and assist in identity simulation as well.

Start-up Ecosystem in the Motion Simulation Market

With developments taking place on a daily basis in the motion simulation market, start-up players are tapping into those sectors where the usage of motion simulation was never expected. The start-ups are bringing in innovative ways of making use of motion simulations.

Some of the start-ups are:

Dynisma: Dynisma is redefining automotive motion simulation. The company assists automotive manufacturers to simulate a ride in their vehicles before even building a car, allowing them to assemble the vehicle within a short span of time.

Improbable: Improbable has always believed in large and complex simulations as the next fundamental breakthrough in any technology. They are developing platforms wherein the objects in the simulations will change the response based on the environment.

Improbable is on track to raise funding of nearly USD 100 million, thereby increasing its valuation to more than USD 3 billion.
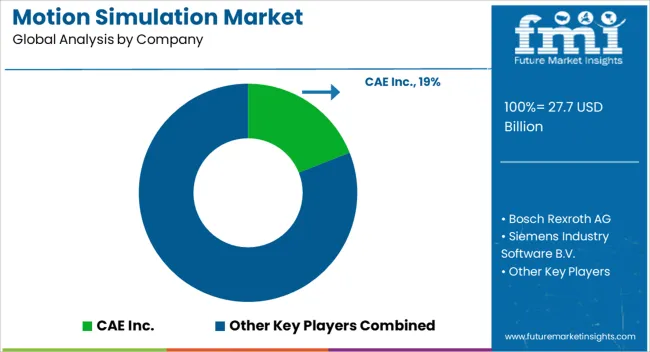
Competitive Landscape in the Motion Simulation Market

Motion Simulation Market Analysis By Company

In a bid to expand the portfolio, the key players are now collaborating with microelectronics giants to develop a 3D integrated circuit hybrid bonding workflow, based on wafer-on-wafer and chip-on-wafer technologies.

Apart from that, the key players are also investing in mergers and acquisitions to reach out to new markets and expand their market share.

Some of the recent developments are:

  • In September 2025, Siemens automated 2.5D and 3D IC design-for-test with a new Tessent Multi die solution.
  • In February 2025, Dassault Systeme introduced a life cycle assessment solution on the 3DEXPERIENCE platform to transform the sustainable innovation process.

Key Companies Profiled

  • Bosch Rexroth AG
  • Siemens Industry Software B.V
  • CAE Inc. Dassault Systèmes
  • Laerdal Medical.
  • Moog Inc.
  • Gaumard Scientific
  • Cubic Corporation

Report Scope

Report Attribute Details
Growth Rate CAGR of 10.8% from 2025 to 2035
Base Year for Estimation 2025
Historical Data 2020 to 2024
Forecast Period 2025 to 2035
Quantitative Units Revenue in USD Million and CAGR from 2025 to 2035
Report Coverage Revenue Forecast, Volume Forecast, Company Ranking, Competitive Landscape, Growth Factors, Trends, and Pricing Analysis
Segments Covered End User, Technology, Type, Degree of Freedom, Region
Regions Covered North America; Latin America; Asia Pacific; Middle East and Africa(MEA); Europe
Key Countries Profiled USA, Canada, Brazil, Argentina, Germany, United Kingdom, France, Spain, Italy, Nordics, BENELUX, Australia & New Zealand, China, India, GCC Countries, South Africa
Key Companies Profiled Bosch Rexroth AG; Siemens Industry Software B.V; CAE Inc. Dassault Systèmes; Laerdal Medical.; Moog Inc.; Gaumard Scientific; Cubic Corporation
Customization Available Upon Request

Key Segments in the Motion Simulation Market

By End User:

  • Defense
  • Automotive
  • Entertainment
  • Mining
  • Healthcare

By Technology:

  • Hydraulic
  • Electric
  • Pneumatic

By Type:

  • Hardware
  • Software

By Degree of Freedom (DOF):

  • Two Degrees of Freedom
  • Three Degrees of Freedom
  • Six Degrees of Freedom

By Region:

  • North America
  • Latin America
  • Asia Pacific
  • Middle East and Africa(MEA)
  • Europe

Table of Content

  1. Executive Summary
    • Global Market Outlook
    • Demand-side Trends
    • Supply-side Trends
    • Technology Roadmap Analysis
    • Analysis and Recommendations
  2. Market Overview
    • Market Coverage / Taxonomy
    • Market Definition / Scope / Limitations
  3. Market Background
    • Market Dynamics
      • Drivers
      • Restraints
      • Opportunity
      • Trends
    • Scenario Forecast
      • Demand in Optimistic Scenario
      • Demand in Likely Scenario
      • Demand in Conservative Scenario
    • Opportunity Map Analysis
    • Product Life Cycle Analysis
    • Supply Chain Analysis
    • Investment Feasibility Matrix
    • Value Chain Analysis
    • PESTLE and Porter’s Analysis
    • Regulatory Landscape
    • Regional Parent Market Outlook
    • Production and Consumption Statistics
    • Import and Export Statistics
  4. Global Market Analysis 2020 to 2024 and Forecast, 2025 to 2035
    • Historical Market Size Value (USD Million) Analysis, 2020 to 2024
    • Current and Future Market Size Value (USD Million) Projections, 2025 to 2035
      • Y-o-Y Growth Trend Analysis
      • Absolute $ Opportunity Analysis
  5. Global Market Pricing Analysis 2020 to 2024 and Forecast 2025 to 2035
  6. Global Market Analysis 2020 to 2024 and Forecast 2025 to 2035, By End User
    • Introduction / Key Findings
    • Historical Market Size Value (USD Million) Analysis By End User , 2020 to 2024
    • Current and Future Market Size Value (USD Million) Analysis and Forecast By End User , 2025 to 2035
      • Defense
      • Automotive
      • Entertainment
      • Mining
      • Healthcare
    • Y-o-Y Growth Trend Analysis By End User , 2020 to 2024
    • Absolute $ Opportunity Analysis By End User , 2025 to 2035
  7. Global Market Analysis 2020 to 2024 and Forecast 2025 to 2035, By Technology
    • Introduction / Key Findings
    • Historical Market Size Value (USD Million) Analysis By Technology, 2020 to 2024
    • Current and Future Market Size Value (USD Million) Analysis and Forecast By Technology, 2025 to 2035
      • Hydraulic
      • Electric
      • Pneumatic
    • Y-o-Y Growth Trend Analysis By Technology, 2020 to 2024
    • Absolute $ Opportunity Analysis By Technology, 2025 to 2035
  8. Global Market Analysis 2020 to 2024 and Forecast 2025 to 2035, By Degree of Freedom
    • Introduction / Key Findings
    • Historical Market Size Value (USD Million) Analysis By Degree of Freedom, 2020 to 2024
    • Current and Future Market Size Value (USD Million) Analysis and Forecast By Degree of Freedom, 2025 to 2035
      • Six Degrees of Freedom
      • Two Degrees of Freedom
      • Three Degrees of Freedom
    • Y-o-Y Growth Trend Analysis By Degree of Freedom, 2020 to 2024
    • Absolute $ Opportunity Analysis By Degree of Freedom, 2025 to 2035
  9. Global Market Analysis 2020 to 2024 and Forecast 2025 to 2035, By Region
    • Introduction
    • Historical Market Size Value (USD Million) Analysis By Region, 2020 to 2024
    • Current Market Size Value (USD Million) Analysis and Forecast By Region, 2025 to 2035
      • North America
      • Latin America
      • Western Europe
      • Eastern Europe
      • East Asia
      • South Asia and Pacific
      • Middle East & Africa
    • Market Attractiveness Analysis By Region
  10. North America Market Analysis 2020 to 2024 and Forecast 2025 to 2035, By Country
    • Historical Market Size Value (USD Million) Trend Analysis By Market Taxonomy, 2020 to 2024
    • Market Size Value (USD Million) Forecast By Market Taxonomy, 2025 to 2035
      • By Country
        • USA
        • Canada
        • Mexico
      • By End User
      • By Technology
      • By Degree of Freedom
    • Market Attractiveness Analysis
      • By Country
      • By End User
      • By Technology
      • By Degree of Freedom
    • Key Takeaways
  11. Latin America Market Analysis 2020 to 2024 and Forecast 2025 to 2035, By Country
    • Historical Market Size Value (USD Million) Trend Analysis By Market Taxonomy, 2020 to 2024
    • Market Size Value (USD Million) Forecast By Market Taxonomy, 2025 to 2035
      • By Country
        • Brazil
        • Chile
        • Rest of Latin America
      • By End User
      • By Technology
      • By Degree of Freedom
    • Market Attractiveness Analysis
      • By Country
      • By End User
      • By Technology
      • By Degree of Freedom
    • Key Takeaways
  12. Western Europe Market Analysis 2020 to 2024 and Forecast 2025 to 2035, By Country
    • Historical Market Size Value (USD Million) Trend Analysis By Market Taxonomy, 2020 to 2024
    • Market Size Value (USD Million) Forecast By Market Taxonomy, 2025 to 2035
      • By Country
        • Germany
        • UK
        • Italy
        • Spain
        • France
        • Nordic
        • BENELUX
        • Rest of Western Europe
      • By End User
      • By Technology
      • By Degree of Freedom
    • Market Attractiveness Analysis
      • By Country
      • By End User
      • By Technology
      • By Degree of Freedom
    • Key Takeaways
  13. Eastern Europe Market Analysis 2020 to 2024 and Forecast 2025 to 2035, By Country
    • Historical Market Size Value (USD Million) Trend Analysis By Market Taxonomy, 2020 to 2024
    • Market Size Value (USD Million) Forecast By Market Taxonomy, 2025 to 2035
      • By Country
        • Russia
        • Poland
        • Hungary
        • Balkan & Baltic
        • Rest of Eastern Europe
      • By End User
      • By Technology
      • By Degree of Freedom
    • Market Attractiveness Analysis
      • By Country
      • By End User
      • By Technology
      • By Degree of Freedom
    • Key Takeaways
  14. East Asia Market Analysis 2020 to 2024 and Forecast 2025 to 2035, By Country
    • Historical Market Size Value (USD Million) Trend Analysis By Market Taxonomy, 2020 to 2024
    • Market Size Value (USD Million) Forecast By Market Taxonomy, 2025 to 2035
      • By Country
        • China
        • Japan
        • South Korea
      • By End User
      • By Technology
      • By Degree of Freedom
    • Market Attractiveness Analysis
      • By Country
      • By End User
      • By Technology
      • By Degree of Freedom
    • Key Takeaways
  15. South Asia and Pacific Market Analysis 2020 to 2024 and Forecast 2025 to 2035, By Country
    • Historical Market Size Value (USD Million) Trend Analysis By Market Taxonomy, 2020 to 2024
    • Market Size Value (USD Million) Forecast By Market Taxonomy, 2025 to 2035
      • By Country
        • India
        • ASEAN
        • Australia & New Zealand
        • Rest of South Asia and Pacific
      • By End User
      • By Technology
      • By Degree of Freedom
    • Market Attractiveness Analysis
      • By Country
      • By End User
      • By Technology
      • By Degree of Freedom
    • Key Takeaways
  16. Middle East & Africa Market Analysis 2020 to 2024 and Forecast 2025 to 2035, By Country
    • Historical Market Size Value (USD Million) Trend Analysis By Market Taxonomy, 2020 to 2024
    • Market Size Value (USD Million) Forecast By Market Taxonomy, 2025 to 2035
      • By Country
        • Kingdom of Saudi Arabia
        • Other GCC Countries
        • Turkiye
        • South Africa
        • Other African Union
        • Rest of Middle East & Africa
      • By End User
      • By Technology
      • By Degree of Freedom
    • Market Attractiveness Analysis
      • By Country
      • By End User
      • By Technology
      • By Degree of Freedom
    • Key Takeaways
  17. Key Countries Market Analysis
    • USA
      • Pricing Analysis
      • Market Share Analysis, 2024
        • By End User
        • By Technology
        • By Degree of Freedom
    • Canada
      • Pricing Analysis
      • Market Share Analysis, 2024
        • By End User
        • By Technology
        • By Degree of Freedom
    • Mexico
      • Pricing Analysis
      • Market Share Analysis, 2024
        • By End User
        • By Technology
        • By Degree of Freedom
    • Brazil
      • Pricing Analysis
      • Market Share Analysis, 2024
        • By End User
        • By Technology
        • By Degree of Freedom
    • Chile
      • Pricing Analysis
      • Market Share Analysis, 2024
        • By End User
        • By Technology
        • By Degree of Freedom
    • Germany
      • Pricing Analysis
      • Market Share Analysis, 2024
        • By End User
        • By Technology
        • By Degree of Freedom
    • UK
      • Pricing Analysis
      • Market Share Analysis, 2024
        • By End User
        • By Technology
        • By Degree of Freedom
    • Italy
      • Pricing Analysis
      • Market Share Analysis, 2024
        • By End User
        • By Technology
        • By Degree of Freedom
    • Spain
      • Pricing Analysis
      • Market Share Analysis, 2024
        • By End User
        • By Technology
        • By Degree of Freedom
    • France
      • Pricing Analysis
      • Market Share Analysis, 2024
        • By End User
        • By Technology
        • By Degree of Freedom
    • India
      • Pricing Analysis
      • Market Share Analysis, 2024
        • By End User
        • By Technology
        • By Degree of Freedom
    • ASEAN
      • Pricing Analysis
      • Market Share Analysis, 2024
        • By End User
        • By Technology
        • By Degree of Freedom
    • Australia & New Zealand
      • Pricing Analysis
      • Market Share Analysis, 2024
        • By End User
        • By Technology
        • By Degree of Freedom
    • China
      • Pricing Analysis
      • Market Share Analysis, 2024
        • By End User
        • By Technology
        • By Degree of Freedom
    • Japan
      • Pricing Analysis
      • Market Share Analysis, 2024
        • By End User
        • By Technology
        • By Degree of Freedom
    • South Korea
      • Pricing Analysis
      • Market Share Analysis, 2024
        • By End User
        • By Technology
        • By Degree of Freedom
    • Russia
      • Pricing Analysis
      • Market Share Analysis, 2024
        • By End User
        • By Technology
        • By Degree of Freedom
    • Poland
      • Pricing Analysis
      • Market Share Analysis, 2024
        • By End User
        • By Technology
        • By Degree of Freedom
    • Hungary
      • Pricing Analysis
      • Market Share Analysis, 2024
        • By End User
        • By Technology
        • By Degree of Freedom
    • Kingdom of Saudi Arabia
      • Pricing Analysis
      • Market Share Analysis, 2024
        • By End User
        • By Technology
        • By Degree of Freedom
    • Turkiye
      • Pricing Analysis
      • Market Share Analysis, 2024
        • By End User
        • By Technology
        • By Degree of Freedom
    • South Africa
      • Pricing Analysis
      • Market Share Analysis, 2024
        • By End User
        • By Technology
        • By Degree of Freedom
  18. Market Structure Analysis
    • Competition Dashboard
    • Competition Benchmarking
    • Market Share Analysis of Top Players
      • By Regional
      • By End User
      • By Technology
      • By Degree of Freedom
  19. Competition Analysis
    • Competition Deep Dive
      • CAE Inc.
        • Overview
        • Product Portfolio
        • Profitability by Market Segments (Product/Age /Sales Channel/Region)
        • Sales Footprint
        • Strategy Overview
          • Marketing Strategy
          • Product Strategy
          • Channel Strategy
      • Bosch Rexroth AG
      • Siemens Industry Software B.V.
      • Dassault Systèmes
      • Laerdal Medical
      • Moog Inc.
      • Gaumard Scientific
      • Cubic Corporation
      • Human Solutions
      • Thoroughbred Technologies
  20. Assumptions & Acronyms Used
  21. Research Methodology

List of Tables

  • Table 1: Global Market Value (USD Million) Forecast by Region, 2020-2035
  • Table 2: Global Market Value (USD Million) Forecast by End User , 2020-2035
  • Table 3: Global Market Value (USD Million) Forecast by Technology, 2020-2035
  • Table 4: Global Market Value (USD Million) Forecast by Degree of Freedom, 2020-2035
  • Table 5: North America Market Value (USD Million) Forecast by Country, 2020-2035
  • Table 6: North America Market Value (USD Million) Forecast by End User , 2020-2035
  • Table 7: North America Market Value (USD Million) Forecast by Technology, 2020-2035
  • Table 8: North America Market Value (USD Million) Forecast by Degree of Freedom, 2020-2035
  • Table 9: Latin America Market Value (USD Million) Forecast by Country, 2020-2035
  • Table 10: Latin America Market Value (USD Million) Forecast by End User , 2020-2035
  • Table 11: Latin America Market Value (USD Million) Forecast by Technology, 2020-2035
  • Table 12: Latin America Market Value (USD Million) Forecast by Degree of Freedom, 2020-2035
  • Table 13: Western Europe Market Value (USD Million) Forecast by Country, 2020-2035
  • Table 14: Western Europe Market Value (USD Million) Forecast by End User , 2020-2035
  • Table 15: Western Europe Market Value (USD Million) Forecast by Technology, 2020-2035
  • Table 16: Western Europe Market Value (USD Million) Forecast by Degree of Freedom, 2020-2035
  • Table 17: Eastern Europe Market Value (USD Million) Forecast by Country, 2020-2035
  • Table 18: Eastern Europe Market Value (USD Million) Forecast by End User , 2020-2035
  • Table 19: Eastern Europe Market Value (USD Million) Forecast by Technology, 2020-2035
  • Table 20: Eastern Europe Market Value (USD Million) Forecast by Degree of Freedom, 2020-2035
  • Table 21: East Asia Market Value (USD Million) Forecast by Country, 2020-2035
  • Table 22: East Asia Market Value (USD Million) Forecast by End User , 2020-2035
  • Table 23: East Asia Market Value (USD Million) Forecast by Technology, 2020-2035
  • Table 24: East Asia Market Value (USD Million) Forecast by Degree of Freedom, 2020-2035
  • Table 25: South Asia and Pacific Market Value (USD Million) Forecast by Country, 2020-2035
  • Table 26: South Asia and Pacific Market Value (USD Million) Forecast by End User , 2020-2035
  • Table 27: South Asia and Pacific Market Value (USD Million) Forecast by Technology, 2020-2035
  • Table 28: South Asia and Pacific Market Value (USD Million) Forecast by Degree of Freedom, 2020-2035
  • Table 29: Middle East & Africa Market Value (USD Million) Forecast by Country, 2020-2035
  • Table 30: Middle East & Africa Market Value (USD Million) Forecast by End User , 2020-2035
  • Table 31: Middle East & Africa Market Value (USD Million) Forecast by Technology, 2020-2035
  • Table 32: Middle East & Africa Market Value (USD Million) Forecast by Degree of Freedom, 2020-2035

List of Figures

  • Figure 1: Global Market Pricing Analysis
  • Figure 2: Global Market Value (USD Million) Forecast 2020-2035
  • Figure 3: Global Market Value (USD Million) Share and BPS Analysis by Region, 2025 and 2035
  • Figure 4: Global Market Y-o-Y Growth Comparison by Region, 2025-2035
  • Figure 5: Global Market Attractiveness Analysis by Region
  • Figure 6: North America Market Incremental Dollar Opportunity, 2025-2035
  • Figure 7: Latin America Market Incremental Dollar Opportunity, 2025-2035
  • Figure 8: Western Europe Market Incremental Dollar Opportunity, 2025-2035
  • Figure 9: Eastern Europe Market Incremental Dollar Opportunity, 2025-2035
  • Figure 10: East Asia Market Incremental Dollar Opportunity, 2025-2035
  • Figure 11: South Asia and Pacific Market Incremental Dollar Opportunity, 2025-2035
  • Figure 12: Middle East & Africa Market Incremental Dollar Opportunity, 2025-2035
  • Figure 13: North America Market Value Share and BPS Analysis by Country, 2025 and 2035
  • Figure 14: Latin America Market Value Share and BPS Analysis by Country, 2025 and 2035
  • Figure 15: Western Europe Market Value Share and BPS Analysis by Country, 2025 and 2035
  • Figure 16: Eastern Europe Market Value Share and BPS Analysis by Country, 2025 and 2035
  • Figure 17: East Asia Market Value Share and BPS Analysis by Country, 2025 and 2035
  • Figure 18: South Asia and Pacific Market Value Share and BPS Analysis by Country, 2025 and 2035
  • Figure 19: Middle East & Africa Market Value Share and BPS Analysis by Country, 2025 and 2035
  • Figure 20: Global Market - Tier Structure Analysis
  • Figure 21: Global Market - Company Share Analysis

Frequently Asked Questions

How big is the motion simulation market in 2025?

The global motion simulation market is estimated to be valued at USD 27.7 billion in 2025.

What will be the size of motion simulation market in 2035?

The market size for the motion simulation market is projected to reach USD 77.4 billion by 2035.

How much will be the motion simulation market growth between 2025 and 2035?

The motion simulation market is expected to grow at a 10.8% CAGR between 2025 and 2035.

What are the key product types in the motion simulation market?

The key product types in motion simulation market are defense, automotive, entertainment, mining and healthcare.

Which technology segment to contribute significant share in the motion simulation market in 2025?

In terms of technology, hydraulic segment to command 40.0% share in the motion simulation market in 2025.

Explore Similar Insights

Future Market Insights

Motion Simulation Market