In Motion Dimensioning Systems Market Size and Share Forecast Outlook 2025 to 2035

The global In Motion Dimensioning Systems market is expected to be valued at USD 2.4 billion in 2025 and is projected to reach approximately USD 3.6 billion by 2035. This reflects an absolute increase of USD 1.3 billion, equivalent to a growth of 53.4% over the forecast period. The expansion is forecast to occur at a CAGR of 4.4%, with the market size estimated to grow by nearly 1.5X by the end of the decade.
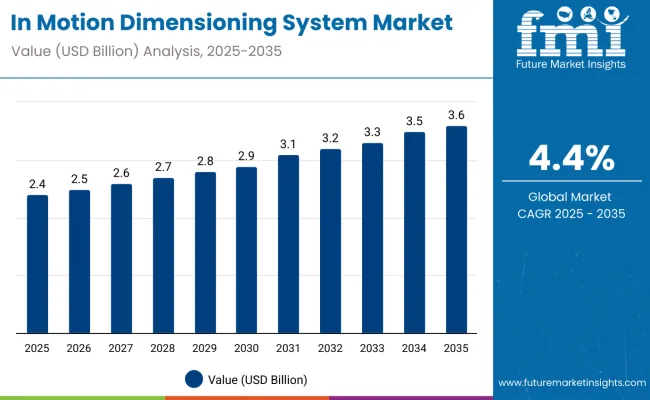
Quick Stats for In Motion Dimensioning Systems Market

  • Industry Value (2025): USD 2.4 Billion
  • Forecast Value (2035): USD 3.6 Billion
  • Forecast CAGR: 4.4%
  • Leading Segment (2025): Hardware(71% share)
  • Key Growth Application: Logistics & Warehousing (36% share)
  • Key Growth Technology: Laser-Based Dimensioning Systems (48%)
  • Top Key Players: NidoAutomationmOptiSense, International Road Dynamics (IRD), FRABA, Xsens, Sherborne Sensors, Murata Electronics Oy, Melexism, Motion Sensors Inc.

In Motion Dimensioning Systems Market

Metric Value
Industry Size (2025E) USD 2.4 billion
Industry Value (2035F) USD 3.6 billion
CAGR (2025 to 2035) 4.4%

Between 2025 and 2030, the market is projected to expand from USD 2.4 billion to USD 2.9 million, adding USD 554 million. Growth in this first phase is supported by network upgrades across parcel hubs and 3PL distribution centers, wider deployment of inline cubing & weighing for revenue protection (dim-weight billing), and the need to audit carrier invoices at scale. Retailers continue building micro-fulfillment and dark-store networks, pulling compact, conveyor-ready systems that can verify dimensions without slowing throughput.

From 2030 to 2035, the market is expected to grow from USD 2.9 billion to USD 3.6 billion, a further increase of USD 708.2 million. This phase is shaped by sensor fusion which involves the combined mechanism of laser, vision, and weight, edge analytics, and tighter integration with WMS/TMS/ERP for cost-to-serve analytics. Hardware refreshes emphasize safer, faster conveyors, IP-rated enclosures, and automatic calibration, while software upgrades focus on charge-back prevention, proof-of-measurement traceability, and API-first architectures.

From 2020 to 2024, the market rose from USD 2 billion to USD 2.3 billion, propelled by the surge in e-commerce parcels, reverse logistics, and contact-light operations in distribution centers. Operators prioritized in-motion systems (vs. static cubing) to avoid line slowdowns, while the need to reconcile dimensional weight with carrier invoices increased demand for audit-grade measurement accuracy. Investments in postal and express networks across North America, Europe, and East Asia laid the installed-base foundation for the 2025-2035 cycle.

Why the In Motion Dimensioning Systems Market is Growing?

Parcel economics now depend on verified dimensions

Carrier pricing has shifted decisively toward dimensional weight (DIM), making verified length-width-height as important as mass. Shippers that rely on manual or static cubing face chargebacks and billing disputes; inline systems provide audit-grade proof of measurement (time-stamp, image, barcode association) at conveyor speed. This revenue-protection motive is strongest in large CEP networks and national retailers, which explains why Logistics & Warehousing already accounts for the largest application share of 36%, with Retail & E-commerce close behind at 27%.

Software-led ROI beyond the sensor

Although hardware still represents 71% of spend today, the value is increasingly unlocked by software carrier rules engines, exception workflows, image storage for disputes, and analytics that quantify cube utilization and cost-to-serve by SKU, lane, or customer. API-first platforms that plug into WMS/TMS/ERP deliver a second layer of savings: fewer manual touches, better trailer/pallet build plans, and automated packaging guidance.

Compliance, traceability, and audit readiness

Postal and trade environments demand traceable measurements that stand up to audits and customer claims. In-motion systems generate immutable records dimensions, weight, barcode, image mapped to shipment IDs. In Europe, accuracy and metrology requirements guide procurement; in the USA, large shippers insist on NTEP/MID-compliant performance and chain-of-custody for dimension data. This compliance layer turns what used to be “nice to have” into a must-have control.

Labor scarcity and safety

Distribution centers face tight labor markets and rising wages. In-motion systems remove repetitive measuring tasks, reducing musculoskeletal strain and redeploying staff to higher-value work. Automation also lowers training time and helps standardize processes across multi-site networks important for 3PLs that ramp up seasonal capacity.

Form factors that fit modern networks

Micro-fulfillment and back-of-store operations require compact, quiet, and easily sanitized units. Vendors are responding with modular conveyor-edge dimensioners that slot into tight footprints and connect over standard fieldbuses/Ethernet. For air cargo and LTL cross-docks, high-throughput tunnel systems measure irregular freight at speed, enabling better ULD and trailer cube.
Market Segment Analysis

Logistics & Warehousing Leads Application Demand

In Motion Dimensioning Systems Market By Application

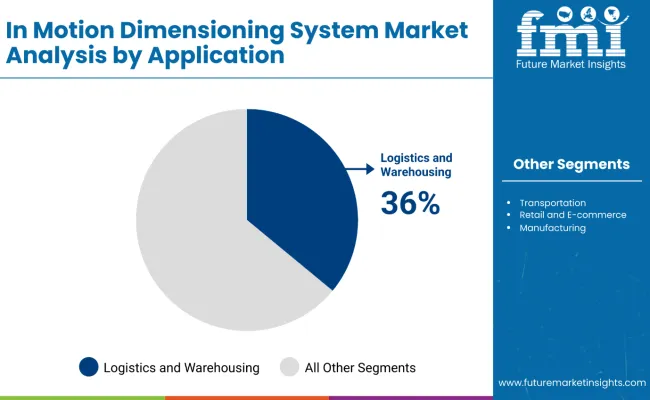
Logistics & Warehousing is the largest application at 36% of global revenue in 2025. Parcel hubs, postal centers, and 3PL campuses integrate laser tunnels and dimension-weigh-scan (DWS) stations to capture cube, weight, and barcode in a single pass. The Retail & E-commerce segment follows at 27%, where omnichannel networks deploy compact, conveyor-edge units for store-fulfillment and returns processing. Transportation (16%) includes air cargo ramps, LTL cross-docks, and port logistics; Manufacturing with 11% share uses in-motion dimensioning for inbound verification and pack-and-ship lines.

Laser-Based Systems Anchor Technology Mix

Laser-based dimensioning accounts for 48% of technology share in 2025, favored for speed, accuracy, and tolerance to varied box geometry. Infrared systems with 27% share win where cost and ease of integration matter, particularly on shorter conveyors or where safety constraints limit laser use. Ultrasonic systems with 10%share, is selected for dusty, reflective, or low-light environments, while Integrated dimensioning systems with 15% share combine laser/IR + vision + scale to deliver audit-grade records with image evidencean emerging standard for large 3PLs.
Hardware Dominates the Component Stack, but Software Grows Faster

In Motion Dimensioning Systems Market By Component

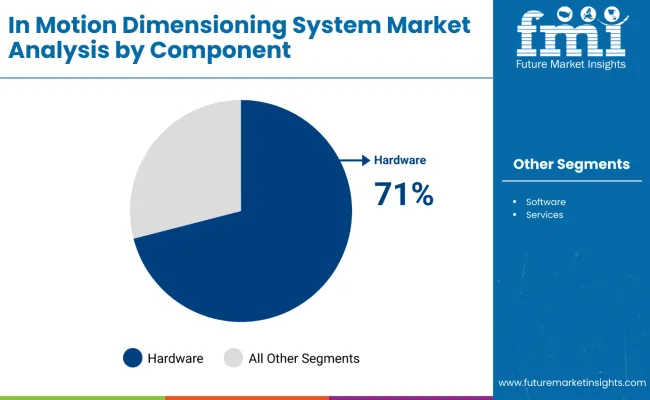
Hardware represents 71% of spend in 2025 (sensors, scanners, scales, conveyors, frames, controllers). Software with 17% share is the fastest-expanding piece as users require data orchestration, carrier rules engines, image storage, and dashboards. Services calibration, MRO, and retrofitsrise with fleet sizes and multi-site SLAs.

Key Trends Shaping the In Motion Dimensioning Systems Market

Demand for In Motion Dimensioning Systems is being supported by factors such as image-backed “proof of measurement” becoming mainstream, inclusion of Sensor fusion for difficult parcels and higher read rates, evolution of Edge AI and anomaly detection on the conveyor, among several others.

Image-backed “proof of measurement” becomes standard

Shippers and 3PLs are moving beyond raw L×W×H to dimension + weight + barcode + image as a single, time-stamped record. This audit-ready bundle shortens dispute cycles with carriers and customers and is increasingly written into SLAs for large parcel hubs and retailersdriving upgrades from basic sensors to integrated dimensioning systems (already 15% of tech mix).

Sensor fusion for difficult parcels and higher read rates

To handle polybags, shrink-wrap, tubes, and irregulars at speed, vendors are fusing laser with infrared, ultrasonic, and machine vision. Multi-sensor tunnels raise first-pass yield and keep conveyors at target throughput, which is critical as Logistics & Warehousing and Retail & E-commerce push peak-season volumes.

Edge AI and anomaly detection on the conveyor

New systems run on-device analytics to flag mis-measures, shadows, and occlusions in real time and auto-trigger re-measurement without stopping the line. Edge inference also identifies damaged packaging, overhanging items, and unsafe load profilesshrinking exception labor and protecting service levels.

Micro-fulfillment and back-of-store footprints

Dark stores and urban micro-DCs need compact, quiet, low-maintenancedimensioners that hug existing conveyors or sit at pack benches. Modular frames, tool-less height adjustments, and plug-and-play scales are replacing bespoke installs, allowing rollouts in hours rather than days.

Returns and reverse-logistics readiness

With returns climbing, DCs are deploying bidirectional or dedicated inbound lanes where dimensioning data feeds triage (restock, refurbish, re-pack, recycle). Image evidence shortens customer credit cycles and informs packaging redesign to reduce future damage and void.

Metrology, compliance, and chain-of-custody

Procurement specs increasingly call for NTEP/MID compliance, certified uncertainty, and encrypted data trails from sensor to host system. Regulated industries (postal, air cargo, cross-border trade) now require immutable measurement records retained for set periodspushing upgrades to integrated, calibrated systems with remote verification.

Sustainability and packaging optimization

Dimension data powers cartonization algorithms and right-sizing initiatives that cut corrugate, dunnage, and trailer count. Operators can quantify CO₂ savings per order, tying dimensioning ROI to corporate ESG goals and accelerating refresh cycles in Europe and Japan.

Service models and multi-site SLAs

As fleets scale, operators prefer calibration-as-a-service, remote health monitoring, and guaranteed uptime SLAs. Vendors win multi-year contracts by bundling commissioning, training, and periodic metrology checksturning one-off CAPEX into predictable OPEX with faster enterprise adoption.
Country Wise Growth Outlook

In Motion Dimensioning Systems Market By Country

Parcel Audit & Micro-Fulfilment Propel USA In-Motion Dimensioning Systems Adoption

In Motion Dimensioning Systems Market Usa

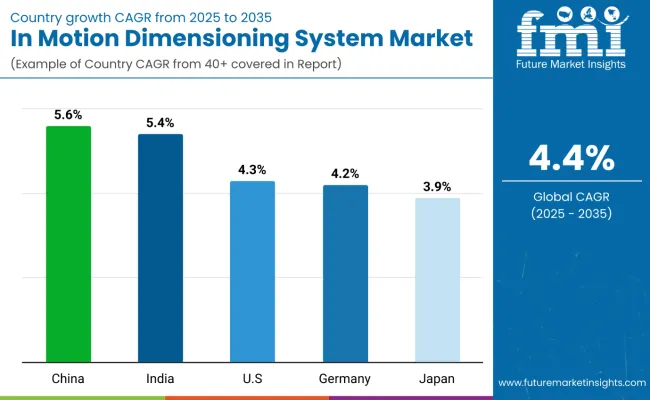
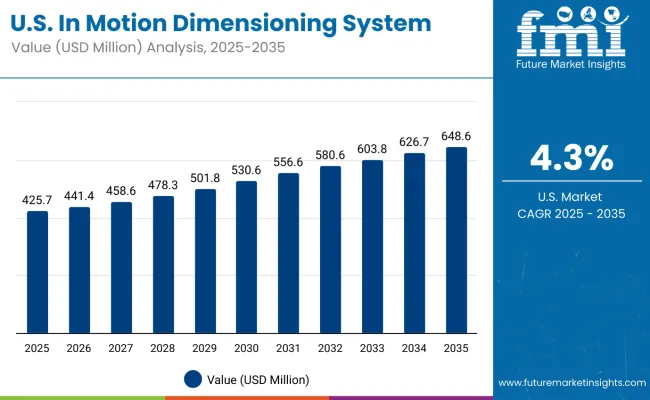
The USA in-motion dimensioning systems market is projected to grow at a CAGR of 4.3% during 2025-2035, underpinned by parcel networks’ shift to dimensional-weight billing, the build-out of micro-fulfilment and dark-store operations, and continued automation across national retailers and 3PLs. Carriers and shippers are standardizing dimension-weigh-scan (DWS) tunnels and conveyor-edge units to capture audit-grade length/width/height + weight + image without slowing throughput.

Regional clusters amplify demand: large hubs around Kentucky/Ohio, the Inland Empire (CA), and Dallas-Fort Worth are retrofitting high-speed sortation with image-backed proof of measurement, while airport and LTL cross-docks add in-motion dimensioning to streamline ULD/trailer cube. “Local-for-local” procurement favors vendors with USA assembly, calibrated service fleets, and API-first software that plugs into WMS/TMS/ERP.

  • Image-backed proof of measurement reduces chargebacks and dispute cycles.
  • Micro-fulfillment and returns lanes rely on compact, quiet conveyor-edge units.
  • API-first platforms integrate with WMS/TMS for cartonization and cube analytics.
  • NTEP/MID compliance and encrypted data trails are becoming bid requirements.

Scale E-Commerce & Cross-Border Logistics Drive China’s Market

China is the fastest-growing in-motion dimensioning market at 5.6% CAGR during 2025-2035, propelled by mega-hubs in Guangdong, Zhejiang, and the Yangtze River Delta, rapid growth of cross-border e-commerce, and greenfield 3PL campuses. High-throughput laser tunnels dominate parcel sortation, while cost-efficient IR/laser hybrids are deployed on short conveyors in regional DCs. Local suppliers shorten lead times with domestically sourced sensors and controllers, and software stacks expose APIs for carrier rules, image storage, and billing audit.

  • Manufacturing logistics adds another leg of growth: inbound verification and pack-out stations at electronics and appliance campuses are adopting in-motion dimensioning to reconcile parts flows and optimize cartonization.
  • Laser-based systems lead for speed/accuracy; IR hybrids scale in cost-sensitive sites.
  • Localized supply chains compress delivery times and total cost of ownership.
  • Integrated DWS records (dims + weight + image) standardize chargeback control.
  • Greenfield DC buildouts enable multi-site, centrally managed software rollouts.

Industry 4.0, CEP Networks, and Metrology Standards Sustain Germany

Germany’s market will expand at 4.2% CAGR through 2035, driven by CEP networks, automated retail DCs, and Mittelstand manufacturing that prioritizes traceable, image-backed measurement. Plants and DCs specify MID-compliant systems with certified uncertainty, integrating laser tunnels and integrated dimensioning at pack lines to support lean/OEE targets and export documentation.

Procurement favors vendors offering predictive calibration, remote health monitoring, and deterministic integration to MES/WMS. Compact, guarded frames and low-glare enclosures are preferred for operator safety in high-speed tunnels.

  • MID/NTEP-grade accuracy and image evidence are core to RFP scoring.
  • Integrated systems (dims + image + barcode + weight) cut audit time and claims.
  • Tight MES/WMS coupling enables cartonization and cost-to-serve analytics.
  • Energy-efficient conveyors and auto-calibration reduce lifetime operating cost.

3PL Campuses & Postal Modernization Accelerate India

The market in India is projected at 5.4% CAGR, led by expansion of 3PL campuses, modernization of postal networks, and D2C brand logistics. Urban DCs with narrow conveyor footprints prefer modular, quick-install units; Tier-2/3 cities deploy IR/laser combinations that balance accuracy with budget. Software attach rates climb as operators adopt rules engines for carrier billing, image-backed dispute resolution, and packaging optimization.

In manufacturing and FMCG, in-motion dimensioning at inbound and pack-and-ship cuts mismatch errors, speeds ASN reconciliation, and informs carton selection, key to trailer cube and cost per order.

  • Modular frames and plug-and-play scales speed brownfield retrofits.
  • IR/laser hybrids win cost-sensitive sites; laser tunnels anchor high-volume hubs.
  • Software subscriptions for cartonization and chargeback control show fastest growth.
  • Multi-site SLAs involving calibration and uptime increasingly favored over one-off buys.

Accuracy, Compact Footprints, and Quiet Operation Define Japan

Japan’s market is expected to grow at 3.9% CAGR, reflecting dense urban DCs, convenience-store parcel flows, and high expectations for measurement fidelity and traceability. Operators prioritize compact, quiet systems that integrate cleanly with existing conveyors and maintain workplace comfort. The component mix skews toward higher software value (Hardware 65%, Software 25%, Services 10%) to support long-term record retention, image evidence, and strict host-system integration.

Manufacturers employ in-motion dimensioning on precision pack lines for export compliance, while retailers deploy conveyor-edge units at back-of-store micro-fulfilment and returns stations. Vendors win on quality, calibration stability, and responsive local service.

  • Compact, low-noise systems favored for back-of-store and urban DC footprints.
  • Higher software share reflects emphasis on traceability and long lifecycle support.
  • Image-assisted records reduce disputes and speed customer credit on returns.
  • Clean, guarded designs and automatic height compensation improve ergonomics.

Europe In Motion Dimensioning SystemsMarket Split by Country

Countries 2025
Germany 23%
Italy 9%
France 14%
UK 18%
Spain 7%
BENELUX 12%
Russia 4%
Rest of Europe 13%
Countries 2035
Germany 21%
Italy 9%
France 14%
UK 17%
Spain 8%
BENELUX 14%
Russia 3%
Rest of Europe 14%

The European In-Motion Dimensioning Systems market is projected to grow at a CAGR of 4.1% from 2025 to 2035, reaching USD 742.3 million by 2035, up from USD 496.7 million in 2025. Growth follows sustained investment in dimension-weight (DIM) billing compliance, network upgrades across parcel/CEP hubs, and the spread of micro-fulfillment and back-of-store operations that need audit-grade measurement without slowing conveyors. Vendors that combine MID-compliant accuracy, image-backed proof of measurement, and API-first integration with WMS/TMS/ERP are winning multi-site rollouts.

Europe’s demand is anchored in replacement-led upgrades in mature Western markets and greenfield logistics capacity in Southern and parts of Central/Eastern Europe. As retailers push faster delivery and tighter cost-to-serve analytics, buyers favor IMDS platforms with sensor fusion (laser/IR + vision + scales), remote calibration, and lifecycle SLAs that guarantee uptime during peak season.

Germany with nearly 23% of the European market in 2025; easing toward remains the regional anchor. CEP networks and Mittelstand manufacturers specify laser tunnels and integrated DWS stations at pack lines to deliver traceable, image-assisted measurements that stand up in audits and export documentation. Machine-builder clusters in Baden-Württemberg and Bavaria prioritize MID-certified uncertainty, deterministic handshakes to MES/WMS, and automatic height compensation for mixed flows of cartons, polybags, and irregulars. Plants value deep diagnostics and remote health monitoring that feed TPM/OEE programs.

UK with18% of the market in Europe, together with Germany, accounts for around 40% of regional demand. UK integrators are rolling out IMDS upgrades across packaging, grocery e-commerce, and specialty retail DCs, pairing compact conveyor-edge units with image storage and rules engines to cut chargeback disputes. National parcel carriers retrofit high-speed sortation with laser tunnels and encrypted data trails, while back-of-store micro-fulfillmentfavors quiet, modular frames that fit tight footprints and install quickly in brownfield estates.

France with 14% regional share, sees demand split between Toulouse-centered air-cargo and aerospace logistics and large Île-de-France retail/omni-channel DCs. Buyers favor quiet, clean, compact IMDS units that integrate with existing conveyors and deliver proof-of-measurement (dims + weight + barcode + image) for returns triage and customer-credit acceleration. Food & beverage and cosmetics sites extend adoption on inspection/pack lines, with software features, cartonization guidance and exception workflows, tied to sustainability and service-level KPIs.

With 9% share, the market in Italy is driven by fashion/apparel, machinery exports, and 3PL campuses in Lombardy and Emilia-Romagna. Operators specify modular, quick-install dimensioners for mezzanines and narrow aisles, balancing accuracy with cost using IR/laser combinations on shorter conveyors and laser tunnels in flagship hubs. Retrofits emphasize returns handling, ASN reconciliation, and predictive calibration to minimize downtime in multi-shift operations.

Spain with nearly 7% share in 2025; is expected to gain share on the strength of logistics corridors around Zaragoza, Madrid, and Barcelona. EV-adjacent supply chains and fast-growing e-commerce programs expand IMDS use on body-shop parts logistics, retail fulfillment, and food processing. DCs adopt low-maintenance, integrated DWS systems that provide image evidence and API connections for carrier-invoice audit. Regional grants for efficiency and automation help sites migrate from static cubing to high-throughput in-motion platforms.

BENELUX accounting for 12% regional share in 2025,isbeing driven by Rotterdam/Antwerp port gateways, pharma cold-chain campuses, and dense multi-tenant logistics parks. Procurement specs emphasize hygienic, sealed IMDS enclosures, remote monitoring, and long-term data retention to meet pharma/GxP and customer-audit needs. Cold-chain and automated warehouses standardize on image-backed records and secure Industrial Ethernet, while AMR/AGV deployments drive demand for compact conveyor-edge dimensioners at induction and sort points.

Component-based Analysis of the In-Motion Dimensioning Systems Market in Japan

Japan’s in-motion dimensioning systems market is set for steady growth through 2035, with demand concentrated in hardware, which accounts for 65% of spend in 2025. Dense, automation-heavy logistics networks, convenience-store parcels, urban micro-fulfillment, and export-grade manufacturing, prioritize compact, quiet hardware that can be dropped into existing conveyors without disturbing clean, organized workspaces.

At the same time, Japanese operators attach higher-value software with 25% for traceability, long-term record retention, and seamless WMS/TMS/ERP integration, while services (10%) cover calibration, periodic metrology checks, and uptime SLAs across multi-site fleets. Preference skews toward low-noise, cleanroom-compatible frames with image-backed proof of measurement and deterministic connectivity into host systems, features that reduce dispute cycles and support compliance in export documentation.

  • Hardware leads at 65%, reflecting compact, quiet, conveyor-ready units tuned for urban DCs and back-of-store fulfillment.
  • Software contributes 25%, driven by image storage, carrier rules engines, and strict traceability requirements in retail and export manufacturing.
  • Service share (10%) stems from calibration programs and multi-site maintenance SLAs that preserve measurement integrity over long lifecycles.
  • Buyers emphasize cleanroom-friendly enclosures, deterministic Industrial Ethernet, and validated data retention to align with Japan’s quality and audit expectations.

Technology-Based Outlook for the In-Motion Dimensioning Systems Market in South Korea

South Korea’s market reflects high-throughput electronics exports and multi-tenant logistics parks, with laser-based systems holding the lead at 45% in 2025. Parcel hubs around Seoul-Incheon and manufacturing corridors in Gyeonggi-Chungcheong deploy laser tunnels for speed and accuracy on cartons and mixed freight. Infrared systems (25%) gain traction in cost-sensitive, short-conveyor installations common to SME DCs and back-of-store setups.

Ultrasonic (15%) is favored where reflective films and shrink-wrap challenge optics, typical in component and display packaging, while integrated dimensioning systems (15%) combine laser/IR with machine vision and scales to deliver image-backed, audit-ready records for large 3PL campuses and cross-border operators.
  • Laser with 45% share anchors high-speed sortation and export-oriented hubs that require accuracy at conveyor rates.
  • Infrared with 25% share supports quick retrofits on shorter lines in SME DCs and omnichannel backrooms.
  • Ultrasonic with 15% share mitigates optical issues on reflective or film-wrapped goods common in electronics packaging.
  • Integrated systems with 15% share provide dims + weight + barcode + image for dispute-free billing and centralized analytics across multi-site Korean 3PL networks.

Competition Outlook

In Motion Dimensioning Systems Market By Company

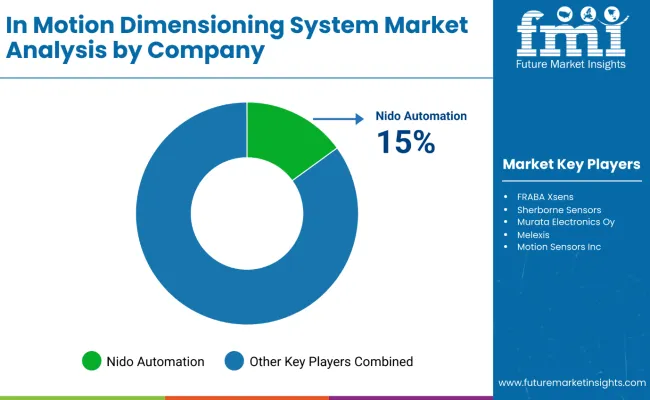
The IMDS market is intensely competitive and increasingly solution-driven. Buyers are no longer procuring a stand-alone sensor; they want a dimension-weigh-scan (DWS) stack that delivers audit-grade proof of measurement (L×W×H + weight + barcode + image), plugs cleanly into WMS/TMS/ERP, and is backed by fleet-level SLAs. That shift favors vendors that combine reliable hardware with API-first software, remote calibration, and multi-site rollout experience.

  • In March 2024, International Road Dynamics (IRD) won a USD3.9 million Tennessee Department of Transportation contract to deploy 28 weigh-in-motion (WiM) sites statewide, with completion slated for May 2025, expanding IRD’s USA enforcement and asset-management footprint.
  • In February 2024, NIDO Automation broadened its sensor-based DWS portfolio listings in India by promoting Cubiscan integrated static and in-motion dimensioning lines, adding models such as the Cubiscan 150/110 ND for conveyor induction and outbound operations.
  • In March 2024, NIDO Group announced expansion into 12 new Indian markets, scaling intralogistics automation (including DWS deployments) for Tier II/III cities and 3PLs.
  • In March 2025, OptiSense showcased its latest PaintChecker Line and PaintChecker Angle coating-thickness sensors at European Coatings Show 2025, highlighting faster installation designs for in-line optical measurement cells across EU factories.
  • In May 2025, OptiSense completed a USA roadshow and distributor push (including Detroit events), positioning its laser/photothermal sensors for North American automotive and battery-plant QA programs.
  • In May 2025, FRABA (POSITAL) detailed new investments and ventures to accelerate growth after 2024 headwinds, supporting next-gen encoders and sensing components used in automated material-handling and dimensioning lines.
  • In May 2025, Movella (Xsens) released XsensAnalyze 2025, adding new male and female anatomical models to improve inertial motion-capture analytics for robotics, healthcare and research use cases.

Companies

  • Nido Automation
  • OptiSense
  • International Road Dynamics (IRD)
  • FRABA
  • Xsens
  • Sherborne Sensors
  • Murata Electronics Oy
  • Melexis
  • Motion Sensors Inc.

Report Scope

Item Value
Quantitative Units USD 2.4 billion (2025)
Component Hardware, Software, Services
Technology Laser-Based Dimensioning Systems, Infrared Dimensioning Systems, Ultrasonic Dimensioning Systems, Integrated Dimensioning Systems
Application Logistics and Warehousing, Transportation, Retail and E-commerce, Manufacturing, Automotive, Others
Regions Covered North America, Europe, East Asia, South Asia & Pacific, Latin America, Middle East & Africa
Countries Covered United States, Germany, United Kingdom, Japan, China, France, Italy, South Korea, Spain, BENELUX
Key Companies Profiled Nido Automation, OptiSense, International Road Dynamics (IRD), FRABA, Xsens, Sherborne Sensors, Murata Electronics Oy, Melexis, Motion Sensors Inc.

Key Segments

By Application:

  • Logistics and Warehousing
  • Transportation
  • Retail and E-commerce
  • Manufacturing
  • Automotive
  • Others

By Technology:

  • Laser-Based Dimensioning Systems
  • Infrared Dimensioning Systems
  • Ultrasonic Dimensioning Systems
  • Integrated Dimensioning Systems

By Component:

  • Hardware
  • Software
  • Services

By Region:

  • North America
  • Latin America
  • Western Europe
  • Eastern Europe
  • East Asia
  • South Asia & Pacific
  • Middle East & Africa

Table of Content

  1. Executive Summary
    • Global Market Outlook
    • Demand-side Trends
    • Supply-side Trends
    • Technology Roadmap Analysis
    • Analysis and Recommendations
  2. Market Overview
    • Market Coverage / Taxonomy
    • Market Definition / Scope / Limitations
  3. Market Background
    • Market Dynamics
      • Drivers
      • Restraints
      • Opportunity
      • Trends
    • Scenario Forecast
      • Demand in Optimistic Scenario
      • Demand in Likely Scenario
      • Demand in Conservative Scenario
    • Key Success Factors
    • Industry Developments
    • Supply Chain Analysis
      • Sourcing and Procurement
        • Raw Material / Component Suppliers
        • Technology Providers
      • Product Manufacturers
      • Channel Partners
      • End Users / Customers
    • Market Assessment Factors
      • Macro-economic Factors
      • Forecast Factors
  4. 3.10. Parent Market Outlook
  5. 3.11. Export Import Analysis
  6. 3.12. Supply Demand Analysis
  7. Global Market Analysis 2020 to 2024 and Forecast, 2025 to 2035
    • Historical Market Size Value (USD Billion) & Volume (Units) Analysis, 2020 to 2024
    • Current and Future Market Size Value (USD Billion) & Volume (Units) Projections, 2025 to 2035
      • Y-o-Y Growth Trend Analysis
      • Absolute $ Opportunity Analysis
  8. Global Market Pricing Analysis 2020 to 2024 and Forecast 2025 to 2035
  9. Global Market Analysis 2020 to 2024 and Forecast 2025 to 2035, By Application
    • Introduction / Key Findings
    • Historical Market Size Value (USD Billion) & Volume (Units) Analysis By Application, 2020 to 2024
    • Current and Future Market Size Value (USD Billion) & Volume (Units) Analysis and Forecast By Application, 2025 to 2035
      • Logistics and Warehousing
      • Transportation
      • Retail and E-commerce
      • Manufacturing
      • Automotive
      • Others
    • Y-o-Y Growth Trend Analysis By Application, 2020 to 2024
    • Absolute $ Opportunity Analysis By Application, 2025 to 2035
  10. Global Market Analysis 2020 to 2024 and Forecast 2025 to 2035, By Technology
    • Introduction / Key Findings
    • Historical Market Size Value (USD Billion) & Volume (Units) Analysis By Technology, 2020 to 2024
    • Current and Future Market Size Value (USD Billion) & Volume (Units) Analysis and Forecast By Technology, 2025 to 2035
      • Laser-Based Dimensioning Systems
      • Infrared Dimensioning Systems
      • Ultrasonic Dimensioning Systems
      • Integrated Dimensioning Systems
    • Y-o-Y Growth Trend Analysis By Technology, 2020 to 2024
    • Absolute $ Opportunity Analysis By Technology, 2025 to 2035
  11. Global Market Analysis 2020 to 2024 and Forecast 2025 to 2035, By Component
    • Introduction / Key Findings
    • Historical Market Size Value (USD Billion) & Volume (Units) Analysis By Component, 2020 to 2024
    • Current and Future Market Size Value (USD Billion) & Volume (Units) Analysis and Forecast By Component, 2025 to 2035
      • Hardware
      • Software
      • Services
    • Y-o-Y Growth Trend Analysis By Component, 2020 to 2024
    • Absolute $ Opportunity Analysis By Component, 2025 to 2035
  12. Global Market Analysis 2020 to 2024 and Forecast 2025 to 2035, By Region
    • Introduction
    • Historical Market Size Value (USD Billion) & Volume (Units) Analysis By Region, 2020 to 2024
    • Current Market Size Value (USD Billion) & Volume (Units) Analysis and Forecast By Region, 2025 to 2035
      • North America
      • Latin America
      • Western Europe
      • Eastern Europe
      • East Asia
      • South Asia & Pacific
      • Middle East & Africa
    • Market Attractiveness Analysis By Region
  13. North America Market Analysis 2020 to 2024 and Forecast 2025 to 2035, By Country
    • Historical Market Size Value (USD Billion) & Volume (Units) Trend Analysis By Market Taxonomy, 2020 to 2024
    • Market Size Value (USD Billion) & Volume (Units) Forecast By Market Taxonomy, 2025 to 2035
      • By Country
        • USA
        • Canada
        • Mexico
      • By Application
      • By Technology
      • By Component
    • Market Attractiveness Analysis
      • By Country
      • By Application
      • By Technology
      • By Component
    • Key Takeaways
  14. Latin America Market Analysis 2020 to 2024 and Forecast 2025 to 2035, By Country
    • Historical Market Size Value (USD Billion) & Volume (Units) Trend Analysis By Market Taxonomy, 2020 to 2024
    • Market Size Value (USD Billion) & Volume (Units) Forecast By Market Taxonomy, 2025 to 2035
      • By Country
        • Brazil
        • Argentina
        • Rest of Latin America
      • By Application
      • By Technology
      • By Component
    • Market Attractiveness Analysis
      • By Country
      • By Application
      • By Technology
      • By Component
    • Key Takeaways
  15. Western Europe Market Analysis 2020 to 2024 and Forecast 2025 to 2035, By Country
    • Historical Market Size Value (USD Billion) & Volume (Units) Trend Analysis By Market Taxonomy, 2020 to 2024
    • Market Size Value (USD Billion) & Volume (Units) Forecast By Market Taxonomy, 2025 to 2035
      • By Country
        • Germany
        • Italy
        • France
        • UK
        • Spain
        • BENELUX
        • Nordics
        • Rest of W. Europe
      • By Application
      • By Technology
      • By Component
    • Market Attractiveness Analysis
      • By Country
      • By Application
      • By Technology
      • By Component
    • Key Takeaways
  16. Eastern Europe Market Analysis 2020 to 2024 and Forecast 2025 to 2035, By Country
    • Historical Market Size Value (USD Billion) & Volume (Units) Trend Analysis By Market Taxonomy, 2020 to 2024
    • Market Size Value (USD Billion) & Volume (Units) Forecast By Market Taxonomy, 2025 to 2035
      • By Country
        • Hungary
        • Poland
        • Russia
        • Balkan & Baltics
        • Rest of E.Europe
      • By Application
      • By Technology
      • By Component
    • Market Attractiveness Analysis
      • By Country
      • By Application
      • By Technology
      • By Component
    • Key Takeaways
  17. East Asia Market Analysis 2020 to 2024 and Forecast 2025 to 2035, By Country
    • Historical Market Size Value (USD Billion) & Volume (Units) Trend Analysis By Market Taxonomy, 2020 to 2024
    • Market Size Value (USD Billion) & Volume (Units) Forecast By Market Taxonomy, 2025 to 2035
      • By Country
        • China
        • Japan
        • South Korea
      • By Application
      • By Technology
      • By Component
    • Market Attractiveness Analysis
      • By Country
      • By Application
      • By Technology
      • By Component
    • Key Takeaways
  18. South Asia & Pacific Market Analysis 2020 to 2024 and Forecast 2025 to 2035, By Country
    • Historical Market Size Value (USD Billion) & Volume (Units) Trend Analysis By Market Taxonomy, 2020 to 2024
    • Market Size Value (USD Billion) & Volume (Units) Forecast By Market Taxonomy, 2025 to 2035
      • By Country
        • India
        • ASEAN
        • Australia & New Zealand
      • By Application
      • By Technology
      • By Component
    • Market Attractiveness Analysis
      • By Country
      • By Application
      • By Technology
      • By Component
    • Key Takeaways
  19. Middle East & Africa Market Analysis 2020 to 2024 and Forecast 2025 to 2035, By Country
    • Historical Market Size Value (USD Billion) & Volume (Units) Trend Analysis By Market Taxonomy, 2020 to 2024
    • Market Size Value (USD Billion) & Volume (Units) Forecast By Market Taxonomy, 2025 to 2035
      • By Country
        • GCC Countries
        • Turkiye
        • Northern Africa
        • South Africa
        • Rest of MEA
      • By Application
      • By Technology
      • By Component
    • Market Attractiveness Analysis
      • By Country
      • By Application
      • By Technology
      • By Component
    • Key Takeaways
  20. Key Countries Market Analysis
    • USA
      • Pricing Analysis
      • Market Share Analysis, 2024
        • By Application
        • By Technology
        • By Component
    • Canada
      • Pricing Analysis
      • Market Share Analysis, 2024
        • By Application
        • By Technology
        • By Component
    • Mexico
      • Pricing Analysis
      • Market Share Analysis, 2024
        • By Application
        • By Technology
        • By Component
    • Brazil
      • Pricing Analysis
      • Market Share Analysis, 2024
        • By Application
        • By Technology
        • By Component
    • Argentina
      • Pricing Analysis
      • Market Share Analysis, 2024
        • By Application
        • By Technology
        • By Component
    • Germany
      • Pricing Analysis
      • Market Share Analysis, 2024
        • By Application
        • By Technology
        • By Component
    • Italy
      • Pricing Analysis
      • Market Share Analysis, 2024
        • By Application
        • By Technology
        • By Component
    • France
      • Pricing Analysis
      • Market Share Analysis, 2024
        • By Application
        • By Technology
        • By Component
    • UK
      • Pricing Analysis
      • Market Share Analysis, 2024
        • By Application
        • By Technology
        • By Component
    • Spain
      • Pricing Analysis
      • Market Share Analysis, 2024
        • By Application
        • By Technology
        • By Component
    • BENELUX
      • Pricing Analysis
      • Market Share Analysis, 2024
        • By Application
        • By Technology
        • By Component
    • Nordics
      • Pricing Analysis
      • Market Share Analysis, 2024
        • By Application
        • By Technology
        • By Component
    • Russia
      • Pricing Analysis
      • Market Share Analysis, 2024
        • By Application
        • By Technology
        • By Component
    • Hungary
      • Pricing Analysis
      • Market Share Analysis, 2024
        • By Application
        • By Technology
        • By Component
    • Poland
      • Pricing Analysis
      • Market Share Analysis, 2024
        • By Application
        • By Technology
        • By Component
    • Balkan & Baltics
      • Pricing Analysis
      • Market Share Analysis, 2024
        • By Application
        • By Technology
        • By Component
    • China
      • Pricing Analysis
      • Market Share Analysis, 2024
        • By Application
        • By Technology
        • By Component
    • Japan
      • Pricing Analysis
      • Market Share Analysis, 2024
        • By Application
        • By Technology
        • By Component
    • South Korea
      • Pricing Analysis
      • Market Share Analysis, 2024
        • By Application
        • By Technology
        • By Component
    • India
      • Pricing Analysis
      • Market Share Analysis, 2024
        • By Application
        • By Technology
        • By Component
    • ASEAN
      • Pricing Analysis
      • Market Share Analysis, 2024
        • By Application
        • By Technology
        • By Component
    • Australia & New Zealand
      • Pricing Analysis
      • Market Share Analysis, 2024
        • By Application
        • By Technology
        • By Component
    • GCC Countries
      • Pricing Analysis
      • Market Share Analysis, 2024
        • By Application
        • By Technology
        • By Component
    • Turkiye
      • Pricing Analysis
      • Market Share Analysis, 2024
        • By Application
        • By Technology
        • By Component
    • Northern Africa
      • Pricing Analysis
      • Market Share Analysis, 2024
        • By Application
        • By Technology
        • By Component
    • South Africa
      • Pricing Analysis
      • Market Share Analysis, 2024
        • By Application
        • By Technology
        • By Component
  21. Market Structure Analysis
    • Competition Dashboard
    • Competition Benchmarking
    • Market Share Analysis of Top Players
      • By Regional
      • By Application
      • By Technology
      • By Component
  22. Competition Analysis
    • Competition Deep Dive
      • Nido Automation
        • Overview
        • Product Portfolio
        • Profitability by Market Segments
        • Sales Footprint
        • Strategy Overview
      • OptiSense
        • Overview
        • Product Portfolio
        • Profitability by Market Segments
        • Sales Footprint
        • Strategy Overview
      • International Road Dynamics (IRD)
        • Overview
        • Product Portfolio
        • Profitability by Market Segments
        • Sales Footprint
        • Strategy Overview
      • FRABA
        • Overview
        • Product Portfolio
        • Profitability by Market Segments
        • Sales Footprint
        • Strategy Overview
      • Xsens
        • Overview
        • Product Portfolio
        • Profitability by Market Segments
        • Sales Footprint
        • Strategy Overview
      • Sherborne Sensors
        • Overview
        • Product Portfolio
        • Profitability by Market Segments
        • Sales Footprint
        • Strategy Overview
      • Murata Electronics Oy
        • Overview
        • Product Portfolio
        • Profitability by Market Segments
        • Sales Footprint
        • Strategy Overview
      • Melexis
        • Overview
        • Product Portfolio
        • Profitability by Market Segments
        • Sales Footprint
        • Strategy Overview
      • Motion Sensors Inc.
        • Overview
        • Product Portfolio
        • Profitability by Market Segments
        • Sales Footprint
        • Strategy Overview
  23. Assumptions & Acronyms Used
  24. Research Methodology

List of Tables

  • Table 1: Global Market Value (USD Billion) Forecast by Region, 2020-2035
  • Table 2: Global Market Volume (Units) Forecast by Region, 2020-2035
  • Table 3: Global Market Value (USD Billion) Forecast by Application, 2020-2035
  • Table 4: Global Market Volume (Units) Forecast by Application, 2020-2035
  • Table 5: Global Market Value (USD Billion) Forecast by Technology, 2020-2035
  • Table 6: Global Market Volume (Units) Forecast by Technology, 2020-2035
  • Table 7: Global Market Value (USD Billion) Forecast by Component, 2020-2035
  • Table 8: Global Market Volume (Units) Forecast by Component, 2020-2035
  • Table 9: North America Market Value (USD Billion) Forecast by Country, 2020-2035
  • Table 10: North America Market Volume (Units) Forecast by Country, 2020-2035
  • Table 11: North America Market Value (USD Billion) Forecast by Application, 2020-2035
  • Table 12: North America Market Volume (Units) Forecast by Application, 2020-2035
  • Table 13: North America Market Value (USD Billion) Forecast by Technology, 2020-2035
  • Table 14: North America Market Volume (Units) Forecast by Technology, 2020-2035
  • Table 15: North America Market Value (USD Billion) Forecast by Component, 2020-2035
  • Table 16: North America Market Volume (Units) Forecast by Component, 2020-2035
  • Table 17: Latin America Market Value (USD Billion) Forecast by Country, 2020-2035
  • Table 18: Latin America Market Volume (Units) Forecast by Country, 2020-2035
  • Table 19: Latin America Market Value (USD Billion) Forecast by Application, 2020-2035
  • Table 20: Latin America Market Volume (Units) Forecast by Application, 2020-2035
  • Table 21: Latin America Market Value (USD Billion) Forecast by Technology, 2020-2035
  • Table 22: Latin America Market Volume (Units) Forecast by Technology, 2020-2035
  • Table 23: Latin America Market Value (USD Billion) Forecast by Component, 2020-2035
  • Table 24: Latin America Market Volume (Units) Forecast by Component, 2020-2035
  • Table 25: Western Europe Market Value (USD Billion) Forecast by Country, 2020-2035
  • Table 26: Western Europe Market Volume (Units) Forecast by Country, 2020-2035
  • Table 27: Western Europe Market Value (USD Billion) Forecast by Application, 2020-2035
  • Table 28: Western Europe Market Volume (Units) Forecast by Application, 2020-2035
  • Table 29: Western Europe Market Value (USD Billion) Forecast by Technology, 2020-2035
  • Table 30: Western Europe Market Volume (Units) Forecast by Technology, 2020-2035
  • Table 31: Western Europe Market Value (USD Billion) Forecast by Component, 2020-2035
  • Table 32: Western Europe Market Volume (Units) Forecast by Component, 2020-2035
  • Table 33: Eastern Europe Market Value (USD Billion) Forecast by Country, 2020-2035
  • Table 34: Eastern Europe Market Volume (Units) Forecast by Country, 2020-2035
  • Table 35: Eastern Europe Market Value (USD Billion) Forecast by Application, 2020-2035
  • Table 36: Eastern Europe Market Volume (Units) Forecast by Application, 2020-2035
  • Table 37: Eastern Europe Market Value (USD Billion) Forecast by Technology, 2020-2035
  • Table 38: Eastern Europe Market Volume (Units) Forecast by Technology, 2020-2035
  • Table 39: Eastern Europe Market Value (USD Billion) Forecast by Component, 2020-2035
  • Table 40: Eastern Europe Market Volume (Units) Forecast by Component, 2020-2035
  • Table 41: East Asia Market Value (USD Billion) Forecast by Country, 2020-2035
  • Table 42: East Asia Market Volume (Units) Forecast by Country, 2020-2035
  • Table 43: East Asia Market Value (USD Billion) Forecast by Application, 2020-2035
  • Table 44: East Asia Market Volume (Units) Forecast by Application, 2020-2035
  • Table 45: East Asia Market Value (USD Billion) Forecast by Technology, 2020-2035
  • Table 46: East Asia Market Volume (Units) Forecast by Technology, 2020-2035
  • Table 47: East Asia Market Value (USD Billion) Forecast by Component, 2020-2035
  • Table 48: East Asia Market Volume (Units) Forecast by Component, 2020-2035
  • Table 49: South Asia & Pacific Market Value (USD Billion) Forecast by Country, 2020-2035
  • Table 50: South Asia & Pacific Market Volume (Units) Forecast by Country, 2020-2035
  • Table 51: South Asia & Pacific Market Value (USD Billion) Forecast by Application, 2020-2035
  • Table 52: South Asia & Pacific Market Volume (Units) Forecast by Application, 2020-2035
  • Table 53: South Asia & Pacific Market Value (USD Billion) Forecast by Technology, 2020-2035
  • Table 54: South Asia & Pacific Market Volume (Units) Forecast by Technology, 2020-2035
  • Table 55: South Asia & Pacific Market Value (USD Billion) Forecast by Component, 2020-2035
  • Table 56: South Asia & Pacific Market Volume (Units) Forecast by Component, 2020-2035
  • Table 57: Middle East & Africa Market Value (USD Billion) Forecast by Country, 2020-2035
  • Table 58: Middle East & Africa Market Volume (Units) Forecast by Country, 2020-2035
  • Table 59: Middle East & Africa Market Value (USD Billion) Forecast by Application, 2020-2035
  • Table 60: Middle East & Africa Market Volume (Units) Forecast by Application, 2020-2035
  • Table 61: Middle East & Africa Market Value (USD Billion) Forecast by Technology, 2020-2035
  • Table 62: Middle East & Africa Market Volume (Units) Forecast by Technology, 2020-2035
  • Table 63: Middle East & Africa Market Value (USD Billion) Forecast by Component, 2020-2035
  • Table 64: Middle East & Africa Market Volume (Units) Forecast by Component, 2020-2035

List of Figures

  • Figure 1: Global Market Volume (Units) Forecast 2020-2035
  • Figure 2: Global Market Pricing Analysis
  • Figure 3: Global Market Value (USD Billion) Forecast 2020-2035
  • Figure 4: Global Market Value Share and BPS Analysis by Application, 2025 and 2035
  • Figure 5: Global Market Y-o-Y Growth Comparison by Application, 2025-2035
  • Figure 6: Global Market Attractiveness Analysis by Application
  • Figure 7: Global Market Value Share and BPS Analysis by Technology, 2025 and 2035
  • Figure 8: Global Market Y-o-Y Growth Comparison by Technology, 2025-2035
  • Figure 9: Global Market Attractiveness Analysis by Technology
  • Figure 10: Global Market Value Share and BPS Analysis by Component, 2025 and 2035
  • Figure 11: Global Market Y-o-Y Growth Comparison by Component, 2025-2035
  • Figure 12: Global Market Attractiveness Analysis by Component
  • Figure 13: Global Market Value (USD Billion) Share and BPS Analysis by Region, 2025 and 2035
  • Figure 14: Global Market Y-o-Y Growth Comparison by Region, 2025-2035
  • Figure 15: Global Market Attractiveness Analysis by Region
  • Figure 16: North America Market Incremental $ Opportunity, 2025-2035
  • Figure 17: Latin America Market Incremental $ Opportunity, 2025-2035
  • Figure 18: Western Europe Market Incremental $ Opportunity, 2025-2035
  • Figure 19: Eastern Europe Market Incremental $ Opportunity, 2025-2035
  • Figure 20: East Asia Market Incremental $ Opportunity, 2025-2035
  • Figure 21: South Asia & Pacific Market Incremental $ Opportunity, 2025-2035
  • Figure 22: Middle East & Africa Market Incremental $ Opportunity, 2025-2035
  • Figure 23: North America Market Value Share and BPS Analysis by Country, 2025 and 2035
  • Figure 24: North America Market Value Share and BPS Analysis by Application, 2025 and 2035
  • Figure 25: North America Market Y-o-Y Growth Comparison by Application, 2025-2035
  • Figure 26: North America Market Attractiveness Analysis by Application
  • Figure 27: North America Market Value Share and BPS Analysis by Technology, 2025 and 2035
  • Figure 28: North America Market Y-o-Y Growth Comparison by Technology, 2025-2035
  • Figure 29: North America Market Attractiveness Analysis by Technology
  • Figure 30: North America Market Value Share and BPS Analysis by Component, 2025 and 2035
  • Figure 31: North America Market Y-o-Y Growth Comparison by Component, 2025-2035
  • Figure 32: North America Market Attractiveness Analysis by Component
  • Figure 33: Latin America Market Value Share and BPS Analysis by Country, 2025 and 2035
  • Figure 34: Latin America Market Value Share and BPS Analysis by Application, 2025 and 2035
  • Figure 35: Latin America Market Y-o-Y Growth Comparison by Application, 2025-2035
  • Figure 36: Latin America Market Attractiveness Analysis by Application
  • Figure 37: Latin America Market Value Share and BPS Analysis by Technology, 2025 and 2035
  • Figure 38: Latin America Market Y-o-Y Growth Comparison by Technology, 2025-2035
  • Figure 39: Latin America Market Attractiveness Analysis by Technology
  • Figure 40: Latin America Market Value Share and BPS Analysis by Component, 2025 and 2035
  • Figure 41: Latin America Market Y-o-Y Growth Comparison by Component, 2025-2035
  • Figure 42: Latin America Market Attractiveness Analysis by Component
  • Figure 43: Western Europe Market Value Share and BPS Analysis by Country, 2025 and 2035
  • Figure 44: Western Europe Market Value Share and BPS Analysis by Application, 2025 and 2035
  • Figure 45: Western Europe Market Y-o-Y Growth Comparison by Application, 2025-2035
  • Figure 46: Western Europe Market Attractiveness Analysis by Application
  • Figure 47: Western Europe Market Value Share and BPS Analysis by Technology, 2025 and 2035
  • Figure 48: Western Europe Market Y-o-Y Growth Comparison by Technology, 2025-2035
  • Figure 49: Western Europe Market Attractiveness Analysis by Technology
  • Figure 50: Western Europe Market Value Share and BPS Analysis by Component, 2025 and 2035
  • Figure 51: Western Europe Market Y-o-Y Growth Comparison by Component, 2025-2035
  • Figure 52: Western Europe Market Attractiveness Analysis by Component
  • Figure 53: Eastern Europe Market Value Share and BPS Analysis by Country, 2025 and 2035
  • Figure 54: Eastern Europe Market Value Share and BPS Analysis by Application, 2025 and 2035
  • Figure 55: Eastern Europe Market Y-o-Y Growth Comparison by Application, 2025-2035
  • Figure 56: Eastern Europe Market Attractiveness Analysis by Application
  • Figure 57: Eastern Europe Market Value Share and BPS Analysis by Technology, 2025 and 2035
  • Figure 58: Eastern Europe Market Y-o-Y Growth Comparison by Technology, 2025-2035
  • Figure 59: Eastern Europe Market Attractiveness Analysis by Technology
  • Figure 60: Eastern Europe Market Value Share and BPS Analysis by Component, 2025 and 2035
  • Figure 61: Eastern Europe Market Y-o-Y Growth Comparison by Component, 2025-2035
  • Figure 62: Eastern Europe Market Attractiveness Analysis by Component
  • Figure 63: East Asia Market Value Share and BPS Analysis by Country, 2025 and 2035
  • Figure 64: East Asia Market Value Share and BPS Analysis by Application, 2025 and 2035
  • Figure 65: East Asia Market Y-o-Y Growth Comparison by Application, 2025-2035
  • Figure 66: East Asia Market Attractiveness Analysis by Application
  • Figure 67: East Asia Market Value Share and BPS Analysis by Technology, 2025 and 2035
  • Figure 68: East Asia Market Y-o-Y Growth Comparison by Technology, 2025-2035
  • Figure 69: East Asia Market Attractiveness Analysis by Technology
  • Figure 70: East Asia Market Value Share and BPS Analysis by Component, 2025 and 2035
  • Figure 71: East Asia Market Y-o-Y Growth Comparison by Component, 2025-2035
  • Figure 72: East Asia Market Attractiveness Analysis by Component
  • Figure 73: South Asia & Pacific Market Value Share and BPS Analysis by Country, 2025 and 2035
  • Figure 74: South Asia & Pacific Market Value Share and BPS Analysis by Application, 2025 and 2035
  • Figure 75: South Asia & Pacific Market Y-o-Y Growth Comparison by Application, 2025-2035
  • Figure 76: South Asia & Pacific Market Attractiveness Analysis by Application
  • Figure 77: South Asia & Pacific Market Value Share and BPS Analysis by Technology, 2025 and 2035
  • Figure 78: South Asia & Pacific Market Y-o-Y Growth Comparison by Technology, 2025-2035
  • Figure 79: South Asia & Pacific Market Attractiveness Analysis by Technology
  • Figure 80: South Asia & Pacific Market Value Share and BPS Analysis by Component, 2025 and 2035
  • Figure 81: South Asia & Pacific Market Y-o-Y Growth Comparison by Component, 2025-2035
  • Figure 82: South Asia & Pacific Market Attractiveness Analysis by Component
  • Figure 83: Middle East & Africa Market Value Share and BPS Analysis by Country, 2025 and 2035
  • Figure 84: Middle East & Africa Market Value Share and BPS Analysis by Application, 2025 and 2035
  • Figure 85: Middle East & Africa Market Y-o-Y Growth Comparison by Application, 2025-2035
  • Figure 86: Middle East & Africa Market Attractiveness Analysis by Application
  • Figure 87: Middle East & Africa Market Value Share and BPS Analysis by Technology, 2025 and 2035
  • Figure 88: Middle East & Africa Market Y-o-Y Growth Comparison by Technology, 2025-2035
  • Figure 89: Middle East & Africa Market Attractiveness Analysis by Technology
  • Figure 90: Middle East & Africa Market Value Share and BPS Analysis by Component, 2025 and 2035
  • Figure 91: Middle East & Africa Market Y-o-Y Growth Comparison by Component, 2025-2035
  • Figure 92: Middle East & Africa Market Attractiveness Analysis by Component
  • Figure 93: Global Market - Tier Structure Analysis
  • Figure 94: Global Market - Company Share Analysis

Frequently Asked Questions

How big is the In Motion Dimensioning Systems Market in 2025?

The global IMDS market is estimated at USD 2.4 billion in 2025, driven by parcel networks’ shift to dimension-weight (DIM) billing, automation in logistics hubs, and the need for audit-grade, image-backed measurements in high-throughput fulfilment.

What will be the size of the In-Motion Dimensioning Systems market in 2035?

The market is projected to reach USD 3.6 billion by 2035, reflecting wider adoption of sensor-fusion dimension-weigh-scan (DWS) tunnels and API-first software that integrates with WMS/TMS/ERP across multi-site operations.

What is the expected CAGR for the In-Motion Dimensioning Systems market from 2025 to 2035?

The market is forecast to expand at a CAGR of 4.4% over 2025–2035, supported by micro-fulfillment build-outs, reverse-logistics growth, and compliance needs for traceable proof-of-measurement.

Which technology type is expected to dominate the In-Motion Dimensioning Systems market?

Laser-based dimensioning systems are expected to lead in 2025 with 48% share.

Which application segment leads the In-Motion Dimensioning Systems market?

Logistics & Warehousing is the largest segment at 36% of 2025 revenue.

Who are the key players in the global In-Motion Dimensioning Systems market?

Key companies referenced in this study include Nido Automation, OptiSense, International Road Dynamics (IRD), FRABA, Xsens, Sherborne Sensors, Murata Electronics Oy, Melexis, and Motion Sensors Inc.

Explore Similar Insights

Future Market Insights

In Motion Dimensioning Systems Market