Reports
- Global Locations -
Headquarters
Future Market Insights, Inc.
Christiana Corporate, 200
Continental Drive, Suite 401,
Newark, Delaware - 19713,
United States
Americas
Future Market Insights, Inc.
616 Corporate Way, Suite 2-9018,
Valley Cottage, NY 10989, United States
MEA
Future Market Insights
1602-6 Jumeirah Bay X2 Tower, Plot No: JLT-PH2-X2A,
Jumeirah Lakes Towers, Dubai,
United Arab Emirates
Europe
Future Market Insights
3rd Floor, 207 Regent Street,
W1B 3HH London
United Kingdom
Asia Pacific
Future Market Insights
Office No. 401-A, 4th Floor,
VANTAGE 9, S.No. 36/1/1,
Baner, Pune 411045, India
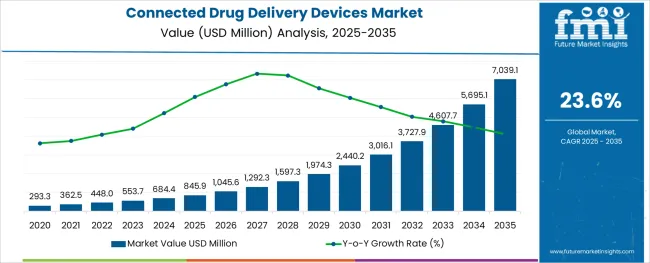
[228 Pages Report] The global Connected Drug Delivery Devices Market size was estimated at US$ 330 Million in 2021, and is expected to reach US$ 1.6 Billion by 2028, expanding at a stellar CAGR of 23.6%.
Attribute | Details |
---|---|
Connected Drug Delivery Devices Market Size (2022) | US$ 448 Million |
Sales Forecast (2028) | US$ 1.6 Billion |
Projected Market Growth Forecast (2022 to 2028) | 23.6% CAGR |
Regional Market With Highest Share | North America - 51.5% |
Sales of connected drug delivery devices contribute 3.7% share to the global novel drug delivery system market. Drug delivery in nanotechnology has been extensively researched on, and this is expected to spawn new innovative drug delivery methods going ahead.
Don't pay for what you don't need
Customize your report by selecting specific countries or regions and save 30%!
Particulars | Details |
---|---|
H1, 2021 | 25.73% |
H1, 2022 Projected | 23.59% |
H1, 2022 Outlook | 22.79% |
BPS Change - H1, 2022 (O) - H1, 2022 (P) | (-) 80 ↓ |
BPS Change - H1, 2022 (O) - H1, 2021 | (-) 294 ↓ |
With the influence of various macroeconomic, industrial and regulatory variables, the comparative analysis of market growth rate of global connected drug delivery devices market has been studied by Future Market Insights.
As per the study, the global market will show a negative BPS growth in H1-2022 outlook as compared to H1-2022 projected period by 80 BPS, and, a decline in BPS growth is expected in H1-2022 over H1- 2021 duration with 294 Basis Point Share (BPS).
Key barriers to the broader adoption of connected devices include data privacy laws that may prevent data sharing with HCPs in some countries, as well as the need to demonstrate that the tools are consistently used and generate a high-quality and reproducible database. These factors impose a negative impact as observed in the BPS value change.
However, there are some positive factors that will help push the market growth in the upcoming years which includes growing development of connected drug delivery systems with features like adherence trackers, patient education tools, dose reminders, patient diaries to gather patient-reported outcomes, and monitoring systems with interfaces between patients and healthcare professionals (HCPs).
This will enable patient monitoring and counselling in a home setting, thereby providing lucrative growth opportunities for the market players.
The healthcare industry has seen major changes over the past years, and most of these were driven by increased technological proliferation in the industry. Drug delivery has become one of the most researched areas in the healthcare industry, and since patient engagement has become essential in the medical sector, demand for connected drug delivery devices has also risen significantly.
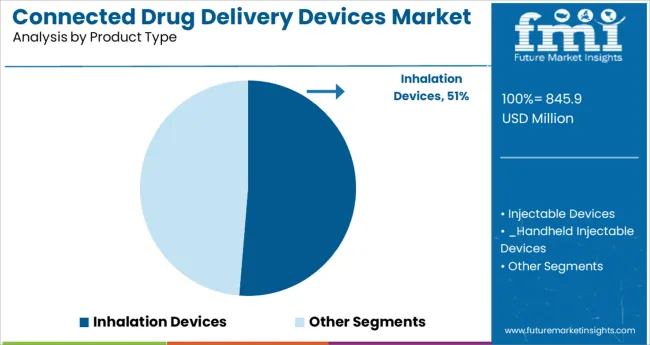
Injectable drug delivery devices are expected to be most popular over the next few years as they have multiple functionalities and can be used for drug tracking, drug delivery, as well as drug identification. Rising preference for these among the population is expected to boost sales of injectable drug delivery devices over the forecast period.
Rising penetration of IoT (Internet of Things) in the medical industry, advances in drug delivery nanotechnology, innovative product launches, increasing awareness about connected drug therapy, and rising trend of home care are some of the major factors that are positively influencing the sales of connected drug delivery devices across the globe.
Demand for connected drug delivery devices increased at a phenomenal CAGR of 26.3% from 2015 to 2021, and is slated to continue surging at 23.6% CAGR from 2022 to 2028,
This research details the global connected drug delivery devices industry across North America, Latin America, Europe, East Asia, South Asia & Pacific, and the Middle East & Africa (MEA).
The North America connected drug delivery devices market, which is set to hold a significant market share of 51.5% in 2022, is expected to maintain this dominance over the forecast period as well. Increasing healthcare expenditure and rising awareness are majorly propelling the sales of connected drug delivery devices in the region.
The market for connected drug delivery devices in Europe holds the second-highest market share of over 28%. Demand for connected drug delivery products in Europe is expected to rise at the fastest CAGR among all regions. Rapid growth can be attributed to increasing prevalence of chronic diseases in the region.
Market growth of connected drug delivery devices in East Asia, South Asia, and the Pacific is expected to see limited due to major factors influencing the sales and adoption of connected drug delivery devices. Majorly, high cost of connected drug delivery devices is restraining the market potential in these regions.
Connected drug delivery system manufacturers can target these regions to gain from the untapped market potential with competitive pricing and affordable products.
The connected drug delivery devices market in the MEA region, which merely contributes 1.9% to the global market share, is expected to rise at a sluggish CAGR. This is majorly due to high costs and little to no awareness about connected drug delivery devices.
However, as the region develops, it would offer some good opportunities for manufacturers and distributors of connected drug delivery devices to boost their sales.
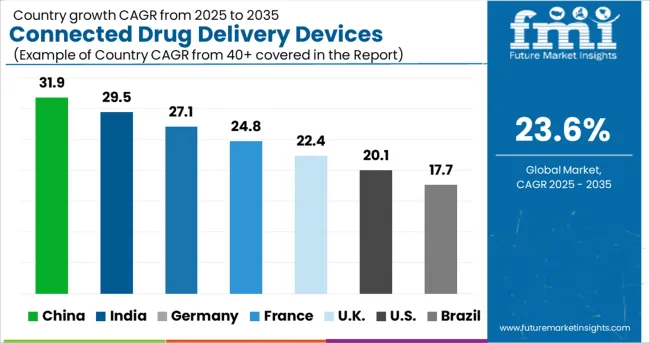
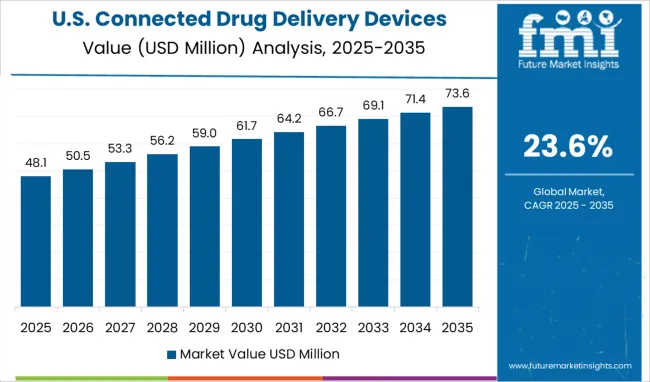
The healthcare industry in the U.S. has been experiencing great growth over the past few years, and is expected to continue to do so over the forecast period as well. The nation has seen substantial increase in the adoption of connected drug delivery equipment.
Factors such as high per capita healthcare spending, rising adoption of new medical technologies, and increasing awareness about the adverse effects of non-compliance with drug therapy are majorly driving the sales of connected drug delivery products in the U.S.
The Japanese connected drug delivery devices market in 2022 is slated to hold 5.1% share of the global market. The nation is always regarded as one of the most technologically advanced in the world, and it only befits that Japan is leading the adoption of healthcare and medical technologies than most nations.
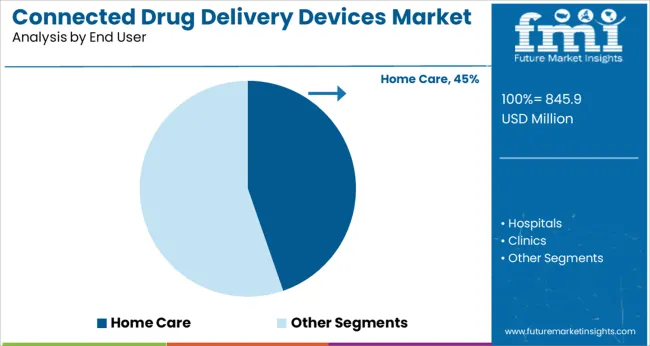
Japan has very high technological proliferation in the healthcare sector, and this makes it a very lucrative market for connected drug delivery device suppliers. Demand for connected drug delivery equipment is also expected to be boosted by the rising geriatric population in Japan, which is also fuelling demand for home care solutions in the nation.
Sales of connected drug delivery systems are expected to see a rise over the forecast period as the popularity and effectiveness of these devices rise.
Connected drug delivery devices work majorly on two technologies - Bluetooth and near field communication (NFC). Bluetooth technology connected drug delivery devices contribute more than 3/5 of the global revenue of the industry. This segment is expected to further grow as advancements in Bluetooth technology pace over the coming years. Low cost of implementation and easy availability make Bluetooth the first choice for many connected drug delivery device manufacturers.
However, NFC technology connected drug delivery devices are expected to rise at the fastest CAGR as these devices are becoming popular for drug identification and tracking purposes, along with having more flexibility and versatility than Bluetooth-operated devices.
Get the data you need at a Fraction of the cost
Personalize your report by choosing insights you need
and save 40%!
The COVID-19 pandemic of 2020 took the world by storm and exposed the healthcare system. This fueled the already increasing trend of revolutionizing the healthcare infrastructure to better accommodate technological proliferation.
While most markets toppled across the globe in 2020, the connected drug delivery devices market showed good growth even in the face of tough times where most of the world was in lockdown.
Demand for connected drug delivery devices was driven by sudden surge in demand for drug delivery solutions for home care use, since people were prohibited to go out under lockdown restrictions. This led to an increase in the adoption of connected drug delivery devices technology, which has been gaining momentum over the past few years.
Sales of connected drug delivery device producers are expected to continue to grow in the post-pandemic era as awareness about their uses increases on a global scale.
Attribute | Details |
---|---|
Forecast Period | 2022 to 2028 |
Historical Data Available for | 2015 to 2021 |
Market Analysis | US$ Million for Value, Units for Volume |
Key Regions Covered |
|
Key Countries Covered |
|
Key Market Segments Covered |
|
Key Companies Profiled |
|
Pricing | Available upon Request |
Connected Drug Delivery Devices Market by Product Type:
Connected Drug Delivery Devices Market by End User:
Connected Drug Delivery Devices Market by Application:
Connected Drug Delivery Devices Market by Technology:
Connected Drug Delivery Devices Market by Region:
1. Executive Summary 1.1. Market Overview 1.2. Market Analysis 1.3. FMI Analysis and Recommendations 1.4. Wheel of Fortune 2. Market Introduction 2.1. Market Taxonomy 2.2. Market Definition 2.3. Market Inclusion and Exclusion 3. Connected Drug Delivery Devices Market Opportunity Analysis 3.1. Macro-Economic Factors 3.2. Opportunity Analysis 3.3. Drivers 3.3.1. Supply Side Drivers 3.3.2. Demand Side Drivers 3.4. Restraints 3.5. Trends 4. Global Economic Outlook 4.1. Global Gross Domestic Product by Region & Country 4.2. Global Healthcare Market Indicator 5. North America Connected Drug Delivery Devices Market Analysis and Forecast 2013–2028 5.1. Introduction 5.2. Historical Market Size (US$ Mn) Analysis By Country, 2013-2028 5.2.1. U.S. 5.2.2. Canada 5.3. Historical Market Size (US$ Mn) Trend Analysis By Product Type, 2013-2028 5.3.1. Inhalation Devices 5.3.2. Injectable Devices 5.3.2.1. Handheld Injectable Devices 5.3.2.2. Wearable Injectable Devices 5.4. Historical Market Size (US$ Mn) Trend Analysis By Technology, 2013-2021 5.4.1. Bluetooth 5.4.2. Near Field Communication 5.5. Market Size (US$ Mn) Forecast By Application, 2013-2028 5.5.1. Anaphylaxis 5.5.2. Cardiovascular 5.5.3. Diabetes 5.5.4. Hormone Replacement 5.5.5. Others 5.6. Historical Market Size (US$ Mn) Trend Analysis By End User, 2013-2028 5.6.1. Hospitals 5.6.2. Clinics 5.6.3. Homecare 5.7. Market Attractiveness Analysis 5.7.1. By Product Type 5.7.2. Technology 5.7.3. By Application 5.7.4. By End User 5.7.5. By Country 5.8. Drivers and Restraints: Impact Analysis 5.9. Key Market Participants – Intensity Mapping 6. Latin America Connected Drug Delivery Devices Market Analysis and Forecast 2013–2028 6.1. Introduction 6.2. Historical Market Size (US$ Mn) Analysis By Country, 2013-2028 6.2.1. Brazil 6.2.2. Mexico 6.2.3. Argentina 6.2.4. Rest of Latin America 6.3. Historical Market Size (US$ Mn) Trend Analysis By Product Type, 2013-2028 6.3.1. Inhalation Devices 6.3.2. Injectable Devices 6.3.2.1. Handheld Injectable Devices 6.3.2.2. Wearable Injectable Devices 6.4. Historical Market Size (US$ Mn) Trend Analysis By Technology, 2013-2021 6.4.1. Bluetooth 6.4.2. Near Field Communication 6.5. Market Size (US$ Mn) Forecast By Application, 2013-2028 6.5.1. Anaphylaxis 6.5.2. Cardiovascular 6.5.3. Diabetes 6.5.4. Hormone Replacement 6.5.5. Others 6.6. Historical Market Size (US$ Mn) Trend Analysis By End User, 2013-2028 6.6.1. Hospitals 6.6.2. Clinics 6.6.3. Homecare 6.7. Market Attractiveness Analysis 6.7.1. By Product Type 6.7.2. Technology 6.7.3. By Application 6.7.4. By End User 6.7.5. By Country 6.8. Drivers and Restraints: Impact Analysis 6.9. Key Market Participants – Intensity Mapping 7. Western Europe Connected Drug Delivery Devices Market Analysis and Forecast 2013–2028 7.1. Introduction 7.2. Market Size (US$ Mn) Forecast By Country, 2013-2028 7.2.1. Germany 7.2.2. U.K 7.2.3. France 7.2.4. Italy 7.2.5. Spain 7.2.6. Rest of Western Europe 7.3. Historical Market Size (US$ Mn) Trend Analysis By Product Type, 2013-2028 7.3.1. Inhalation Devices 7.3.2. Injectable Devices 7.3.2.1. Handheld Injectable Devices 7.3.2.2. Wearable Injectable Devices 7.4. Historical Market Size (US$ Mn) Trend Analysis By Technology, 2013-2021 7.4.1. Bluetooth 7.4.2. Near Field Communication 7.5. Market Size (US$ Mn) Forecast By Application, 2013-2028 7.5.1. Anaphylaxis 7.5.2. Cardiovascular 7.5.3. Diabetes 7.5.4. Hormone Replacement 7.5.5. Others 7.6. Historical Market Size (US$ Mn) Trend Analysis By End User, 2013-2028 7.6.1. Hospitals 7.6.2. Clinics 7.6.3. Homecare 7.7. Market Attractiveness Analysis 7.7.1. By Product Type 7.7.2. Technology 7.7.3. By Application 7.7.4. By End User 7.7.5. By Country 7.8. Drivers and Restraints: Impact Analysis 7.9. Key Market Participants – Intensity Mapping 8. Eastern Europe Connected Drug Delivery Devices Market Analysis and Forecast 2013–2028 8.1. Introduction 8.2. Market Size (US$ Mn) Forecast By Country, 2013-2028 8.2.1. Russia 8.2.2. Poland 8.2.3. Rest of Eastern Europe 8.3. Historical Market Size (US$ Mn) Trend Analysis By Product Type, 2013-2028 8.3.1. Inhalation Devices 8.3.2. Injectable Devices 8.3.2.1. Handheld Injectable Devices 8.3.2.2. Wearable Injectable Devices 8.4. Historical Market Size (US$ Mn) Trend Analysis By Technology, 2013-2021 8.4.1. Bluetooth 8.4.2. Near Field Communication 8.5. Market Size (US$ Mn) Forecast By Application, 2013-2028 8.5.1. Anaphylaxis 8.5.2. Cardiovascular 8.5.3. Diabetes 8.5.4. Hormone Replacement 8.5.5. Others 8.6. Historical Market Size (US$ Mn) Trend Analysis By End User, 2013-2028 8.6.1. Hospitals 8.6.2. Clinics 8.6.3. Homecare 8.7. Market Attractiveness Analysis 8.7.1. By Product Type 8.7.2. Technology 8.7.3. By Application 8.7.4. By End User 8.7.5. By Country 8.8. Drivers and Restraints: Impact Analysis 8.9. Key Market Participants – Intensity Mapping 9. Asia Pacific Excluding China & Japan Connected Drug Delivery Devices Market Analysis and Forecast 2013–2028 9.1. Introduction 9.2. Market Size (US$ Mn) Forecast By Country, 2013-2028 9.2.1. India 9.2.2. Australia and New Zealand 9.2.3. ASEAN 9.2.4. Rest of APECJ 9.3. Historical Market Size (US$ Mn) Trend Analysis By Product Type, 2013-2028 9.3.1. Inhalation Devices 9.3.2. Injectable Devices 9.3.2.1. Handheld Injectable Devices 9.3.2.2. Wearable Injectable Devices 9.4. Historical Market Size (US$ Mn) Trend Analysis By Technology, 2013-2021 9.4.1. Bluetooth 9.4.2. Near Field Communication 9.5. Market Size (US$ Mn) Forecast By Application, 2013-2028 9.5.1. Anaphylaxis 9.5.2. Cardiovascular 9.5.3. Diabetes 9.5.4. Hormone Replacement 9.5.5. Others 9.6. Historical Market Size (US$ Mn) Trend Analysis By End User, 2013-2028 9.6.1. Hospitals 9.6.2. Clinics 9.6.3. Homecare 9.7. Market Attractiveness Analysis 9.7.1. By Product Type 9.7.2. Technology 9.7.3. By Application 9.7.4. By End User 9.7.5. By Country 9.8. Drivers and Restraints: Impact Analysis 9.9. Key Market Participants – Intensity Mapping 10. China Connected Drug Delivery Devices Market Analysis and Forecast 2013–2028 10.1. Introduction 10.2. Historical Market Size (US$ Mn) Trend Analysis By Product Type, 2013-2028 10.2.1. Inhalation Devices 10.2.2. Injectable Devices 10.2.2.1. Handheld Injectable Devices 10.2.2.2. Wearable Injectable Devices 10.3. Historical Market Size (US$ Mn) Trend Analysis By Technology, 2013-2021 10.3.1. Bluetooth 10.3.2. Near Field Communication 10.4. Market Size (US$ Mn) Forecast By Application, 2013-2028 10.4.1. Anaphylaxis 10.4.2. Cardiovascular 10.4.3. Diabetes 10.4.4. Hormone Replacement 10.4.5. Others 10.5. Historical Market Size (US$ Mn) Trend Analysis By End User, 2013-2028 10.5.1. Hospitals 10.5.2. Clinics 10.5.3. Homecare 10.6. Market Attractiveness Analysis 10.6.1. By Product Type 10.6.2. Technology 10.6.3. By Application 10.6.4. By End User 10.7. Drivers and Restraints: Impact Analysis 10.8.Key Market Participants – Intensity Mapping 11. Japan Connected Drug Delivery Devices Market Analysis and Forecast 2013–2028 11.1.Introduction 11.2. Historical Market Size (US$ Mn) Trend Analysis By Product Type, 2013-2028 11.2.1. Inhalation Devices 11.2.2. Injectable Devices 11.2.2.1. Handheld Injectable Devices 11.2.2.2. Wearable Injectable Devices 11.3. Historical Market Size (US$ Mn) Trend Analysis By Technology, 2013-2021 11.3.1. Bluetooth 11.3.2. Near Field Communication 11.4. Market Size (US$ Mn) Forecast By Application, 2013-2028 11.4.1. Anaphylaxis 11.4.2. Cardiovascular 11.4.3. Diabetes 11.4.4. Hormone Replacement 11.4.5. Others 11.5. Historical Market Size (US$ Mn) Trend Analysis By End User, 2013-2028 11.5.1. Hospitals 11.5.2. Clinics 11.5.3. Homecare 11.6. Market Attractiveness Analysis 11.6.1. By Product Type 11.6.2. Technology 11.6.3. By Application 11.6.4. By End User 11.7. Drivers and Restraints: Impact Analysis 11.8. Key Market Participants – Intensity Mapping 12. Middle East and Africa Connected Drug Delivery Devices Market Analysis and Forecast 2013–2028 12.1. Introduction 12.2. Regional Market Trends 12.3. Market Size (US$ Mn) Forecast By Country, 2013-2028 12.3.1. GCC Countries 12.3.2. South Africa 12.3.3. Rest of Middle East and Africa 12.4. Historical Market Size (US$ Mn) Trend Analysis By Product Type, 2013-2028 12.4.1. Inhalation Devices 12.4.2. Injectable Devices 12.4.2.1. Handheld Injectable Devices 12.4.2.2. Wearable Injectable Devices 12.5. Historical Market Size (US$ Mn) Trend Analysis By Technology, 2013-2021 12.5.1. Bluetooth 12.5.2. Near Field Communication 12.6. Market Size (US$ Mn) Forecast By Application, 2013-2028 12.6.1. Anaphylaxis 12.6.2. Cardiovascular 12.6.3. Diabetes 12.6.4. Hormone Replacement 12.6.5. Others 12.7. Historical Market Size (US$ Mn) Trend Analysis By End User, 2013-2028 12.7.1. Hospitals 12.7.2. Clinics 12.7.3. Homecare 12.8. Market Attractiveness Analysis 12.8.1. By Product Type 12.8.2. Technology 12.8.3. By Application 12.8.4. By End User 12.8.5. By Country 12.9. Drivers and Restraints: Impact Analysis 12.10. Key Market Participants – Intensity Mapping 13. Forecast Factors: Relevance and Impact 14. Forecast Assumptions 15. Market Structure Analysis 15.1.Market Structure by Tier 15.2.Market Share Analysis (2016) for Top Players, By Region 16. Competition Analysis 16.1.Competition Dashboard 16.2.Competitors Deep Dive 16.2.1. Bayer AG 16.2.1.1. Overview 16.2.1.2. Product and Application Portfolio 16.2.1.3. Production Footprint 16.2.1.4. Sales Footprint 16.2.1.5. Channel Footprint 16.2.1.6. Strategy 16.2.1.6.1. Marketing Strategy 16.2.1.6.2. Product Strategy 16.2.1.6.3. Channel Strategy 16.2.2. Propeller Health 16.2.2.1. Overview 16.2.2.2. Product and Application Portfolio 16.2.2.3. Production Footprint 16.2.2.4. Sales Footprint 16.2.2.5. Channel Footprint 16.2.2.6. Strategy 16.2.2.6.1. Marketing Strategy 16.2.2.6.2. Product Strategy 16.2.2.6.3. Channel Strategy 16.2.3. West Pharmaceutical Services, Inc. 16.2.3.1. Overview 16.2.3.2. Product and Application Portfolio 16.2.3.3. Production Footprint 16.2.3.4. Sales Footprint 16.2.3.5. Channel Footprint 16.2.3.6. Strategy 16.2.3.6.1. Marketing Strategy 16.2.3.6.2. Product Strategy 16.2.3.6.3. Channel Strategy 16.2.4. 3M Company 16.2.4.1. Overview 16.2.4.2. Product and Application Portfolio 16.2.4.3. Production Footprint 16.2.4.4. Sales Footprint 16.2.4.5. Channel Footprint 16.2.4.6. Strategy 16.2.4.6.1. Marketing Strategy 16.2.4.6.2. Product Strategy 16.2.4.6.3. Channel Strategy 16.2.5. OPKO Health 16.2.5.1. Overview 16.2.5.2. Product and Application Portfolio 16.2.5.3. Production Footprint 16.2.5.4. Sales Footprint 16.2.5.5. Channel Footprint 16.2.5.6. Strategy 16.2.5.6.1. Marketing Strategy 16.2.5.6.2. Product Strategy 16.2.5.6.3. Channel Strategy 16.2.6. Sagentia (Science Group) 16.2.6.1. Overview 16.2.6.2. Product and Application Portfolio 16.2.6.3. Production Footprint 16.2.6.4. Sales Footprint 16.2.6.5. Channel Footprint 16.2.6.6. Strategy 16.2.6.6.1. Marketing Strategy 16.2.6.6.2. Product Strategy 16.2.6.6.3. Channel Strategy 16.2.7. Cohero Health 16.2.7.1. Overview 16.2.7.2. Product and Application Portfolio 16.2.7.3. Production Footprint 16.2.7.4. Sales Footprint 16.2.7.5. Channel Footprint 16.2.7.6. Strategy 16.2.7.6.1. Marketing Strategy 16.2.7.6.2. Product Strategy 16.2.7.6.3. Channel Strategy 16.2.8. Care TRx 16.2.8.1. Overview 16.2.8.2. Product and Application Portfolio 16.2.8.3. Production Footprint 16.2.8.4. Sales Footprint 16.2.8.5. Channel Footprint 16.2.8.6. Strategy 16.2.8.6.1. Marketing Strategy 16.2.8.6.2. Product Strategy 16.2.8.6.3. Channel Strategy 16.2.9. CeQur SA 16.2.9.1. Overview 16.2.9.2. Product and Application Portfolio 16.2.9.3. Production Footprint 16.2.9.4. Sales Footprint 16.2.9.5. Channel Footprint 16.2.9.6. Strategy 16.2.9.6.1. Marketing Strategy 16.2.9.6.2. Product Strategy 16.2.9.6.3. Channel Strategy 16.2.10. Biocorp Production SA 16.2.10.1. Overview 16.2.10.2. Product and Application Portfolio 16.2.10.3. Production Footprint 16.2.10.4. Sales Footprint 16.2.10.5. Channel Footprint 16.2.10.6. Strategy 16.2.10.6.1. Marketing Strategy 16.2.10.6.2. Product Strategy 16.2.10.6.3. Channel Strategy 17. Global Connected Drug Delivery Devices Market Analysis Forecast 2013–2028, By Region 17.1. Introduction / Key Findings 17.2. Market Size (US$ Mn) Forecast By Region 17.2.1. North America 17.2.2. Western Europe 17.2.3. Eastern Europe 17.2.4. Latin America 17.2.5. Asia Pacific Excluding Japan And China 17.2.6. China 17.2.7. Japan 17.2.8. Middle East and Africa 17.3. Market Attractiveness Analysis By Region 18. Global Connected Drug Delivery Devices Market Analysis Forecast 2013–2028, By Product Type 18.1. Introduction/Key Finding 18.2. Market Size (US$ Mn) Forecast By Product Type, 2013-2028 18.2.1. Inhalation Devices 18.2.2. Injectable Devices 18.2.2.1. Handheld Injectable Devices 18.2.2.2. Wearable Injectable Devices 18.3. Market Attractiveness Analysis By Product Type 19. Global Connected Drug Delivery Devices Market Analysis Forecast 2013–2028, By Technology 19.1. Introduction/Key Finding 19.2. Market Size (US$ Mn) Forecast By Technology, 2013-2028 19.2.1. Bluetooth 19.2.2. Near Field Communication 19.3. Market Attractiveness Analysis By Technology 20. Global Connected Drug Delivery Devices Market Analysis Forecast 2013–2028, By Application 20.1. Introduction/Key Finding 20.2. Market Size (US$ Mn) Forecast By Application, 2013-2028 20.2.1. Anaphylaxis 20.2.2. Cardiovascular 20.2.3. Diabetes 20.2.4. Hormone Replacement 20.2.5. Others 20.3. Market Attractiveness Analysis By Application 21. Global Connected Drug Delivery Devices Market Analysis Forecast 2013–2028, By End User 21.1. Introduction/Key Finding 21.2.Market Size (US$ Mn) Forecast By End User, 2013-2028 21.2.1. Hospitals 21.2.2. Clinics 21.2.3. Homecare 21.3.Market Attractiveness Analysis By End User 22. Global Connected Drug Delivery Devices Market Analysis Forecast 2013–2028 22.1.Market Value Share Analysis By All Segment 22.2.Y-o-Y Growth Analysis By All Segment 22.3.Absolute $ Opportunity 23. Assumptions and Acronyms Used 24. Research Methodology
Don't pay for what you don't need
Customize your report by selecting specific countries or regions and save 30%!
Table 01: North America Connected Drug Delivery Devices Market Value (US$ Mn) Analysis and Opportunity Assessment 2013–2028, By Country Table 02: North America Connected Drug Delivery Devices Market Value (US$ Mn) Analysis and Opportunity Assessment 2013–2028, By Product Type Table 03: North America Connected Drug Delivery Devices Market Value (US$ Mn) Analysis and Opportunity Assessment 2013–2028, By Technology Table 04: North America Connected Drug Delivery Devices Market Value (US$ Mn) Analysis and Opportunity Assessment 2013–2028, By Application Table 05: North America Connected Drug Delivery Devices Market Value (US$ Mn) Analysis and Opportunity Assessment 2013–2028, By End User Table 06: Latin America Connected Drug Delivery Devices Market Value (US$ Mn) Analysis and Opportunity Assessment 2013–2028, By Country Table 07: Latin America Connected Drug Delivery Devices Market Value (US$ Mn) Analysis and Opportunity Assessment 2013–2028, By Product Type Table 08: Latin America Connected Drug Delivery Devices Market Value (US$ Mn) Analysis and Opportunity Assessment 2013–2028, By Technology Table 09: Latin America Connected Drug Delivery Devices Market Value (US$ Mn) Analysis and Opportunity Assessment 2013–2028, By Application Table 10: Latin America Connected Drug Delivery Devices Market Value (US$ Mn) Analysis and Opportunity Assessment 2013–2028, By End User Table 11: Western Europe Connected Drug Delivery Devices Market Value (US$ Mn) Analysis and Opportunity Assessment 2013–2028, By Country Table 12: Western Europe Connected Drug Delivery Devices Market Value (US$ Mn) Analysis and Opportunity Assessment 2013–2028, By Product Type Table 13: Western Europe Connected Drug Delivery Devices Market Value (US$ Mn) Analysis and Opportunity Assessment 2013–2028, By Technology Table 14: Western Europe Connected Drug Delivery Devices Market Value (US$ Mn) Analysis and Opportunity Assessment 2013–2028, By Application Table 15: Western Europe Connected Drug Delivery Devices Market Value (US$ Mn) Analysis and Opportunity Assessment 2013–2028, By End User Table 16: Eastern Europe Connected Drug Delivery Devices Market Value (US$ Mn) Analysis and Opportunity Assessment 2013–2028, By Country Table 17: Eastern Europe Connected Drug Delivery Devices Market Value (US$ Mn) Analysis and Opportunity Assessment 2013–2028, By Product Type Table 18: Eastern Europe Connected Drug Delivery Devices Market Value (US$ Mn) Analysis and Opportunity Assessment 2013–2028, By Technology Table 19: Eastern Europe Connected Drug Delivery Devices Market Value (US$ Mn) Analysis and Opportunity Assessment 2013–2028, By Application Table 20: Eastern Europe Connected Drug Delivery Devices Market Value (US$ Mn) Analysis and Opportunity Assessment 2013–2028, By End User Table 21: APECJ Connected Drug Delivery Devices Market Value (US$ Mn) Analysis and Opportunity Assessment 2013–2028, By Country Table 22: APECJ Connected Drug Delivery Devices Market Value (US$ Mn) Analysis and Opportunity Assessment 2013–2028, By Product Type Table 23: APECJ Connected Drug Delivery Devices Market Value (US$ Mn) Analysis and Opportunity Assessment 2013–2028, By Technology Table 24: APECJ Connected Drug Delivery Devices Market Value (US$ Mn) Analysis and Opportunity Assessment 2013–2028, By Application Table 25: APECJ Connected Drug Delivery Devices Market Value (US$ Mn) Analysis and Opportunity Assessment 2013–2028, By End User Table 26: China Connected Drug Delivery Devices Market Value (US$ Mn) Analysis and Opportunity Assessment 2013–2028, By Product Type Table 27: China Connected Drug Delivery Devices Market Value (US$ Mn) Analysis and Opportunity Assessment 2013–2028, By Technology Table 28: China Connected Drug Delivery Devices Market Value (US$ Mn) Analysis and Opportunity Assessment 2013–2028, By Application Table 29: China Connected Drug Delivery Devices Market Value (US$ Mn) Analysis and Opportunity Assessment 2013–2028, By End User Table 30: Japan Connected Drug Delivery Devices Market Value (US$ Mn) Analysis and Opportunity Assessment 2013–2028, By Product Type Table 31: Japan Connected Drug Delivery Devices Market Value (US$ Mn) Analysis and Opportunity Assessment 2013–2028, By Technology Table 32: Japan Connected Drug Delivery Devices Market Value (US$ Mn) Analysis and Opportunity Assessment 2013–2028, By Application Table 33: Japan Connected Drug Delivery Devices Market Value (US$ Mn) Analysis and Opportunity Assessment 2013–2028, By End User Table 34: MEA Connected Drug Delivery Devices Market Value (US$ Mn) Analysis and Opportunity Assessment 2013–2028, By Country Table 35: MEA Connected Drug Delivery Devices Market Value (US$ Mn) Analysis and Opportunity Assessment 2013–2028, By Product Type Table 36: MEA Connected Drug Delivery Devices Market Value (US$ Mn) Analysis and Opportunity Assessment 2013–2028, By Technology Table 37: MEA Connected Drug Delivery Devices Market Value (US$ Mn) Analysis and Opportunity Assessment 2013–2028, By Application Table 38: MEA Connected Drug Delivery Devices Market Value (US$ Mn) Analysis and Opportunity Assessment 2013–2028, By End User Table 39: Global Connected Drug Delivery Devices Market Value (US$ Mn) Analysis and Opportunity Assessment 2013–2028, By Region Table 40: Global Connected Drug Delivery Devices Market Value (US$ Mn) Analysis- and Opportunity Assessment 2013–2028, By Product Type Table 41: Global Connected Drug Delivery Devices Market Value (US$ Mn) Analysis and Opportunity Assessment 2013–2028, By Technology Table 42: Global Connected Drug Delivery Devices Market Value (US$ Mn) Analysis- and Opportunity Assessment 2013–2028, By Application Table 43: Global Connected Drug Delivery Devices Market Value (US$ Mn) Analysis-and Opportunity Assessment 2013–2028, By End User
Figure 01: North America Connected Drug Delivery Devices Market Value Share By Product Type (2022 E) Figure 02: North America Connected Drug Delivery Devices Market Value Share By Technology (2022 E) Figure 03: North America Connected Drug Delivery Devices Market Value Share By Application (2022 E) Figure 03: North America Connected Drug Delivery Devices Market Value Share By Country (2022 E) Figure 04: North America Connected Drug Delivery Devices Market Value Share By End User (2022 E) Figure 06: North America Connected Drug Delivery Devices Market Value Analysis and Forecast (US$ Mn), 2013-2028 Figure 07: U.S. Connected Drug Delivery Devices Market Value Analysis (US$ Mn), 2013–2028 Figure 08: Canada Connected Drug Delivery Devices Market Value Analysis (US$ Mn), 2013–2028 Figure 08: Western Europe Connected Drug Delivery Devices Market Value Analysis and Forecast (US$ Mn), 2013-2028 Figure 09: North America Connected Drug Delivery Devices Market Attractiveness Analysis by Product Type, 2022-2028 Figure 10: North America Connected Drug Delivery Devices Market Attractiveness Analysis by Technology, 2022-2028 Figure 11: North America Connected Drug Delivery Devices Market Attractiveness Analysis by Application, 2022-2028 Figure 12: North America Connected Drug Delivery Devices Market Attractiveness Analysis by End User, 2022-2028 Figure 13: North America Connected Drug Delivery Devices Market Attractiveness Analysis by Country, 2022-2028 Figure 14: Latin America Connected Drug Delivery Devices Market Value Share By Product Type (2022 E) Figure 15: Latin America Connected Drug Delivery Devices Market Value Share By Technology (2022 E) Figure 16: Latin America Connected Drug Delivery Devices Market Value Share By Application (2022 E) Figure 17: Latin America Connected Drug Delivery Devices Market Value Share By End User (2022 E) Figure 18: Latin America Connected Drug Delivery Devices Market Value Share By Country (2022 E) Figure 19: Latin America Connected Drug Delivery Devices Market Value Analysis and Forecast (US$ Mn), 2013-2028 Figure 20: Brazil Connected Drug Delivery Devices Market Value Analysis (US$ Mn), 2013–2028 Figure 21: Mexico Connected Drug Delivery Devices Market Value Analysis (US$ Mn), 2013–2028 Figure 22: Argentina Connected Drug Delivery Devices Market Value Analysis (US$ Mn), 2013–2028 Figure 23: Rest of Latin America Connected Drug Delivery Devices Market Value Analysis (US$ Mn), 2013–2028 Figure 24: Latin America Connected Drug Delivery Devices Market Attractiveness Analysis by Product Type, 2022-2028 Figure 25: Latin America Connected Drug Delivery Devices Market Attractiveness Analysis by Technology, 2022-2028 Figure 26: Latin America Connected Drug Delivery Devices Market Attractiveness Analysis by Application, 2022-2028 Figure 27: Latin America Connected Drug Delivery Devices Market Attractiveness Analysis by End User, 2022-2028 Figure 28: Latin America Connected Drug Delivery Devices Market Attractiveness Analysis by Country, 2022-2028 Figure 29: Western Europe Connected Drug Delivery Devices Market Value Share By Product Type (2022 E) Figure 30: Western Europe Connected Drug Delivery Devices Market Value Share By Technology (2022 E) Figure 31: Western Europe Connected Drug Delivery Devices Market Value Share By Application (2022 E) Figure 32: Western Europe Connected Drug Delivery Devices Market Value Share By End User (2022 E) Figure 33: Western Europe Connected Drug Delivery Devices Market Value Share By Country (2022 E) Figure 34: U.K. Connected Drug Delivery Devices Market Value Analysis (US$ Mn), 2013–2028 Figure 35: Germany Connected Drug Delivery Devices Market Value Analysis (US$ Mn), 2013–2028 Figure 36: France Connected Drug Delivery Devices Market Value Analysis (US$ Mn), 2013–2028 Figure 37: Italy Connected Drug Delivery Devices Market Value Analysis (US$ Mn), 2013–2028 Figure 38: Spain Connected Drug Delivery Devices Market Value Analysis (US$ Mn), 2013–2028 Figure 39: Rest of Western Europe Connected Drug Delivery Devices Market Value Analysis (US$ Mn), 2013–2028 Figure 40: Western Europe Connected Drug Delivery Devices Market Attractiveness Analysis by Product Type, 2022-2028 Figure 41: Western Europe Connected Drug Delivery Devices Market Attractiveness Analysis by Technology, 2022-2028 Figure 42: Western Europe Connected Drug Delivery Devices Market Attractiveness Analysis by Application, 2022-2028 Figure 43: Western Europe Connected Drug Delivery Devices Market Attractiveness Analysis by End User, 2022-2028 Figure 44: Western Europe Connected Drug Delivery Devices Market Attractiveness Analysis by Country, 2022-2028 Figure 45: Eastern Europe Connected Drug Delivery Devices Market Value Share By Product Type (2022 E) Figure 46: Eastern Europe Connected Drug Delivery Devices Market Value Share By Technology (2022 E) Figure 47: Eastern Europe Connected Drug Delivery Devices Market Value Share By Application (2022 E) Figure 48: Eastern Europe Connected Drug Delivery Devices Market Value Share By End User (2022 E) Figure 49: Eastern Europe Connected Drug Delivery Devices Market Value Share By Country (2022 E) Figure 50: Eastern Europe Connected Drug Delivery Devices Market Value Analysis and Forecast (US$ Mn), 2013-2028 Figure 51: Russia Connected Drug Delivery Devices Market Value Analysis (US$ Mn), 2013–2028 Figure 52: Poland Connected Drug Delivery Devices Market Value Analysis (US$ Mn), 2013–2028 Figure 53: Rest of Eastern Europe Connected Drug Delivery Devices Market Value Analysis (US$ Mn), 2013–2028 Figure 54: Eastern Europe Connected Drug Delivery Devices Market Attractiveness Analysis by Product Type, 2022-2028 Figure 55: Eastern Europe Connected Drug Delivery Devices Market Attractiveness Analysis by Technology, 2022-2028 Figure 56: Eastern Europe Connected Drug Delivery Devices Market Attractiveness Analysis by Application, 2022-2028 Figure 57: Eastern Europe Connected Drug Delivery Devices Market Attractiveness Analysis by End User, 2022-2028 Figure 58 : Eastern Europe Connected Drug Delivery Devices Market Attractiveness Analysis by Country, 2022-2028 Figure 59: APECJ Connected Drug Delivery Devices Market Value Share By Product Type (2022 E) Figure 60: APECJ Connected Drug Delivery Devices Market Value Share By Technology (2022 E) Figure 61: APECJ Connected Drug Delivery Devices Market Value Share By Application (2022 E) Figure 62: APECJ Connected Drug Delivery Devices Market Value Share By End User (2022 E) Figure 63: APECJ Connected Drug Delivery Devices Market Value Share By Country (2022 E) Figure 64: APECJ Connected Drug Delivery Devices Market Value Analysis and Forecast (US$ Mn), 2013-2028 Figure 65: India Connected Drug Delivery Devices Market Value Analysis (US$ Mn), 2013–2028 Figure 66: ANZ Connected Drug Delivery Devices Market Value Analysis (US$ Mn), 2013–2028 Figure 67: ASEAN Connected Drug Delivery Devices Market Value Analysis (US$ Mn), 2013–2028 Figure 68: Rest of APECJ Connected Drug Delivery Devices Market Value Analysis (US$ Mn), 2013–2028 Figure 69: APECJ Connected Drug Delivery Devices Market Attractiveness Analysis by Product Type, 2022-2028 Figure 70: APECJ Connected Drug Delivery Devices Market Attractiveness Analysis by Technology, 2022-2028 Figure 71: APECJ Connected Drug Delivery Devices Market Attractiveness Analysis by Application, 2022-2028 Figure 72: APECJ Connected Drug Delivery Devices Market Attractiveness Analysis by End User, 2022-2028 Figure 73: APECJ Connected Drug Delivery Devices Market Attractiveness Analysis by Country, 2022-2028 Figure 74: China Connected Drug Delivery Devices Market Value Share By Product Type (2022 E) Figure 75: China Connected Drug Delivery Devices Market Value Share By Technology (2022 E) Figure 76: China Connected Drug Delivery Devices Market Value Share By Application (2022 E) Figure 77: China Connected Drug Delivery Devices Market Value Share By End User (2022 E) Figure 78: China Connected Drug Delivery Devices Market Value Analysis and Forecast (US$ Mn), 2013-2028 Figure 79: China Connected Drug Delivery Devices Market Attractiveness Analysis by Product Type, 2022-2028 Figure 80: China Connected Drug Delivery Devices Market Attractiveness Analysis by Technology, 2022-2028 Figure 81: China Connected Drug Delivery Devices Market Attractiveness Analysis by Application, 2022-2028 Figure 82: China Connected Drug Delivery Devices Market Attractiveness Analysis by End User, 2022-2028 Figure 83: Japan Connected Drug Delivery Devices Market Value Share By Product Type (2022 E) Figure 84: Japan Connected Drug Delivery Devices Market Value Share By Technology (2022 E) Figure 85: Japan Connected Drug Delivery Devices Market Value Share By Application (2022 E) Figure 86: Japan Connected Drug Delivery Devices Market Value Share By End User (2022 E) Figure 87: Japan Connected Drug Delivery Devices Market Value Analysis and Forecast (US$ Mn), 2013-2028 Figure 88: Japan Connected Drug Delivery Devices Market Attractiveness Analysis by Product Type, 2022-2028 Figure 89: Japan Connected Drug Delivery Devices Market Attractiveness Analysis by Technology, 2022-2028 Figure 90: Japan Connected Drug Delivery Devices Market Attractiveness Analysis by Application, 2022-2028 Figure 91: Japan Connected Drug Delivery Devices Market Attractiveness Analysis by End User, 2022-2028 Figure 91: MEA Connected Drug Delivery Devices Market Value Share By Product Type (2022 E) Figure 92: MEA Connected Drug Delivery Devices Market Value Share By Technology (2022 E) Figure 93: MEA Connected Drug Delivery Devices Market Value Share By Country (2022 E) Figure 94: MEA Connected Drug Delivery Devices Market Value Share By Application (2022 E) Figure 95: MEA Connected Drug Delivery Devices Market Value Share By End User (2022 E) Figure 96: MEA Connected Drug Delivery Devices Market Value Analysis and Forecast (US$ Mn), 2013-2028 Figure 97: South Africa Connected Drug Delivery Devices Market Value Analysis (US$ Mn), 2013–2028 Figure 98: GCC Countries Connected Drug Delivery Devices Market Value Analysis (US$ Mn), 2013–2028 Figure 100: Rest of MEA Connected Drug Delivery Devices Market Value Analysis (US$ Mn), 2013–2028 Figure 101: MEA Connected Drug Delivery Devices Market Attractiveness Analysis by Product Type, 2022-2028 Figure 102: MEA Connected Drug Delivery Devices Market Attractiveness Analysis by Technology, 2022-2028 Figure 103: MEA Connected Drug Delivery Devices Market Attractiveness Analysis by Application, 2022-2028 Figure 104: MEA Connected Drug Delivery Devices Market Attractiveness Analysis by End User, 2022-2028 Figure 105: MEA Connected Drug Delivery Devices Market Attractiveness Analysis by Country, 2022-2028 Figure 106: Global Connected Drug Delivery Devices Market Attractiveness Analysis by Region, 2022-2028 Figure 107: Global Connected Drug Delivery Devices Market Value Analysis (US$ Mn), 2013–2028, By Inhalation Devices Figure 108: Global Connected Drug Delivery Devices Market Value Analysis (US$ Mn), 2013–2028, By Injectable Devices Figure 109: Global Connected Drug Delivery Devices Market Attractiveness Analysis by Product Type, 2022-2028 Figure 110: Global Connected Drug Delivery Devices Market Value Analysis (US$ Mn), 2013–2028, By Bluetooth Figure 111: Global Connected Drug Delivery Devices Market Value Analysis (US$ Mn), 2013–2028, By NFC Figure 112: Global Connected Drug Delivery Devices Market Attractiveness Analysis by Technology, 2022-2028 Figure 113: Global Connected Drug Delivery Devices Market Value Analysis (US$ Mn), 2013–2028, By Anaphylaxis Figure 114: Global Connected Drug Delivery Devices Market Value Analysis (US$ Mn), 2013–2028, By Cardiovascular Figure 115: Global Connected Drug Delivery Devices Market Value Analysis (US$ Mn), 2013–2028, By Diabetes Figure 116: Global Connected Drug Delivery Devices Market Value Analysis (US$ Mn), 2013–2028, By Hormone Replacement Figure 117: Global Connected Drug Delivery Devices Market Value Analysis (US$ Mn), 2013–2028, By Others Figure 118: Global Connected Drug Delivery Devices Market Attractiveness Analysis by Application, 2022-2028 Figure 119: Global Connected Drug Delivery Devices Market Value Analysis (US$ Mn), 2013–2028, By Hospitals Figure 120: Global Connected Drug Delivery Devices Market Value Analysis (US$ Mn), 2013–2028, By Clinics Figure 121: Global Connected Drug Delivery Devices Market Value Analysis (US$ Mn), 2013–2028, By Homecare Figure 122: Global Connected Drug Delivery Devices Market Attractiveness Analysis by End User, 2022-2028 Figure 123: Global Connected Drug Delivery Devices Market Value Analysis (US$ Mn), 2013-2028 Figure 124: Global Connected Drug Delivery Devices Market Absolute $ Opportunity, 2022 - 2028
Recommendations
Explore Healthcare Insights
View Reports