Next Generation Optical Biometry Devices Market Snapshot

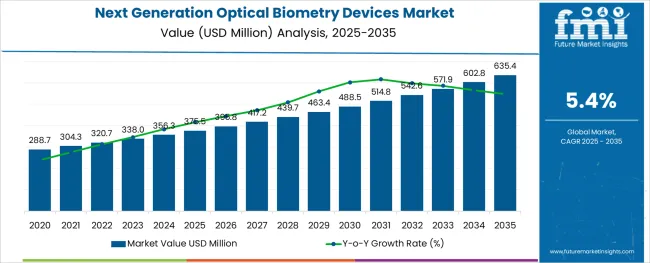
[248 Pages Report] As per Future Market Insight’s latest published report, the global Next Generation Optical Biometry Devices Market was valued at US$ 320.7 Million in 2021.

Attribute Details
Next Generation Optical Biometry Devices Market Size (2021) US$ 320.7 Million
Sales Forecast for Next Generation Optical Biometry Devices (2028) US$ 461.3 Million
Global Market Growth (2022 to 2028) 5.4% CAGR
Market Share of Top 5 Next Generation Optical Biometry Device Manufacturers 60%

Sales of next generation optical biometry devices are slated to rise at a CAGR of 5.4% to reach US$ 461.3 Million by 2028.

In 2021, next generation optical biometry device shipments represented 16.1% share of the global ophthalmic imaging devices market. Hospitals account for 41.8% revenue share of the next generation optical biometry devices

Don't pay for what you don't need

Customize your report by selecting specific countries or regions and save 30%!

How The Market Progressed Till June 2022?

Particulars Details
H1, 2021 5.11%
H1, 2022 Projected 5.36%
H1, 2022 Outlook 4.76%
BPS Change - H1, 2022 (O) - H1, 2022 (P) (-) 60 ↓
BPS Change - H1, 2022 (O) - H1, 2021 (-) 35 ↓

According to Future Market Insights analysis, the global next generation optical biometry devices market expects to drop by 35 Basis Point Share (BPS) in H1-2022 as compared to H1- 2021. Whereas in comparison to H1-2022 projected value, the market during H1-2022 outlook period will show a dip of 60 BPS.

Major factors attributed to this dip includes lack of trained professionals, and a high cost of optical biometry devices which is set to provide a restrictive impact upon the market growth through the forecasted years.

Moreover, advances in product design and integration of digitalized solutions together with product adoption scenario may be impacted with the cost constraints of initial equipment setting up, as well as the gradual maintenance and upgrade costs to follow.

Following several restrictive scenarios, the market has observed a change in the BPS values, and thus will be likely to experience a slow progression towards sales adoption over the next few years.

However, increasing incidence of eye diseases such as cataract and refractive errors coupled with rising number of eye care clinics and hospitals across the world are factors driving adoption of next generation optical biometry devices.

With advancements in technology, automated versions of next generation optical biometry devices have been developed aiding measurement of eyes before refractive and cataract surgeries. Such factors are expected to influence the market growth in upcoming years.

Sales Analysis of Next Generation Optical Biometry Devices (2013 to 2021) Vs Market Estimates (2022 to 2028)

As per FMI, the global next generation optical biometry devices market was valued at US$ 320.7 Mn in 2021.

Increasing incidence of eye diseases such as cataract and refractive errors coupled with rising number of eye care clinics and hospitals across the world are factors driving adoption of next generation optical biometry devices.

With advancements in technology, next generation optical biometry devices have been developed aiding measurement of eyes before refractive and cataract surgeries.

Next generation optical biometry devices are automated and measure various parameters such as axial length, anterior chamber depth, thickness of lens, retinal thickness, pupil size, and much more.

Next Generation Optical Biometry Devices Market

Next generation optical biometry devices are an accurate alternative for precise measurements and provide efficient results. Also, next generation optical biometry equipment avoid operator variations in measurements.

Rapid increase in the number of probe infections due to usage of ultrasound devices lead to post-operative errors, fueling demand for next generation optical biometry devices instead of ultrasound devices.

Manufacturers of next generation optical biometry devices are introducing automated instruments that are more efficient in measuring the segments of the eyes. Next generation optical biometry device suppliers are working on strengthening the related software to provide detailed information about the eye segments.

Companies manufacturing optical biometry devices are collaborating with local distributors/retailers to increase the product penetration of next generation optical biometry equipment.

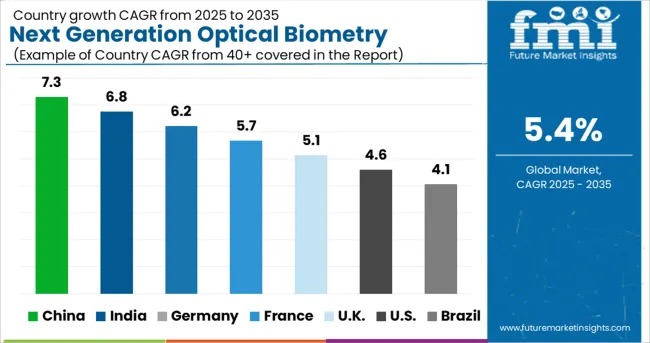
Considering this, it is expected that the global next generation optical biometry devices market will rise at a CAGR of 5.4% over the forecast period.

Sabyasachi Ghosh
Sabyasachi Ghosh

Principal Consultant

Talk to Analyst

Find your sweet spots for generating winning opportunities in this market.

Which Regional Market is Set to Showcase Exceptional Growth in Next Generation Optical Biometry Devices?

The North American next generation optical biometry devices market is projected to account for 26.8% of the global market share in 2022.

According to the Prevent Blindness organization, 25 Mn Americans having cataract require medical care every year in the U.S., thereby boosting demand for next generation optical biometry equipment in the region.

Rising acceptance of advanced optical biometry equipment, quick development of eye care infrastructure, and changing lifestyles are some of the factors that are predicted to contribute to next generation optical biometry devices market expansion in the region.
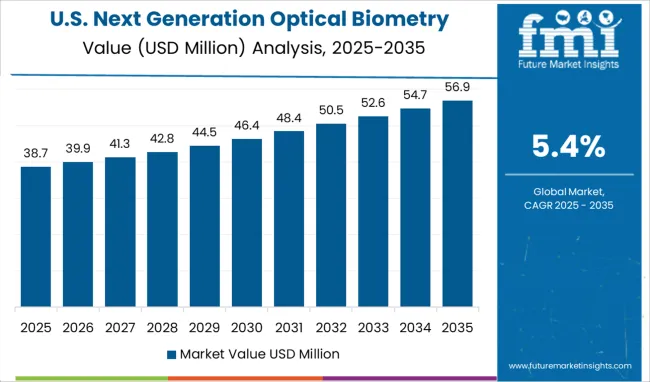
Next Generation Optical Biometry Devices Market - Country-wise Analysis

How is the USA Emerging as an Attractive Investment Destination for Next Generation Optical Biometry Device Suppliers?

The USA government has increased its healthcare expenditure to approximately 7% by providing Medicare and Medicaid services - fueling availability of reimbUSAment for cataract surgeries. This is driving demand for advanced next generation optical biometry devices.

Patient safety is of topmost priority in the USA, which signals demand for faster and better ocular imaging. Emergence of optical devices, high potency and fastness of these devices, and growing number of hospitals are factors driving market growth of next generation optical biometry instruments and devices in the USA

What is the Driving Force Behind Demand Growth of Next Generation Optical Biometry Devices in the UK?

Growing demand for next generation optical biometry devices is being noted in the UKdue to rising number of cataract surgeries.

Growing use of next generation optical biometry devices for cataract surgeries in hospitals as well as progressive increase in the number of government and private hospitals in the UKare expected to boost demand growth of next generation optical biometry devices.

Increase in the number of cataract treatments performed and rising adoption of innovative practices for such procedures will also propel the market forward.

Get the data you need at a Fraction of the cost

Personalize your report by choosing insights you need
and save 40%!

Next Generation Optical Biometry Devices Market - Category-wise Analysis

Which Type of Next Generation Optical Biometry Devices are Most Popular?

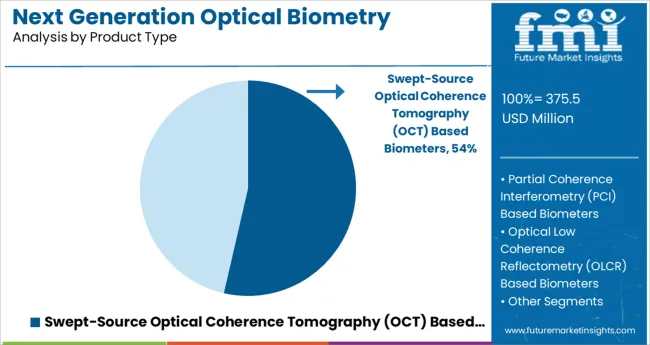
In terms of revenue, swept-source optical coherent based biometry devices will account for significant revenue share in the next generation optical biometry devices industry over the forecast period. Swept-source optical coherent based biometry devices are set to exhibit highest revenue share in the next generation optical biometry devices market

Swept-source optical coherent based optical biometry devices are gaining popularity in the USA market. This category of next generation optical biometry devices is used especially at hospitals and ophthalmology clinics and specialized eye centers.

Some of the qualities driving demand for swept-source optical coherent based biometry devices include fast data capture, several measurements in a single process, enhanced wavelength, and the capacity to overcome ocular opacities.

The superiority of swept-source optical coherent based biometry devices over partial coherent interferometry is demonstrated by their ability to measure the axial length along six separate axes.

Which End User Generates High Revenue from Next Generation Optical Biometry Device Sales?

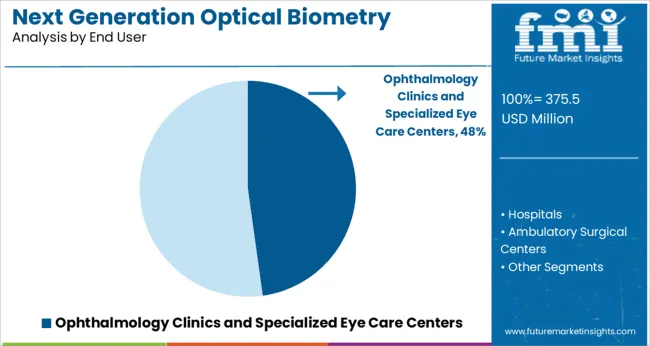
Hospitals account for 41.8% revenue share in next generation optical biometry device demand.

The market is predicted to grow as the number of private and government hospitals gradually increases. Growing use of next generation optical biometry devices in medical settings, such as hospitals, is expected to boost overall market expansion.

Medical services and vision benefits offered under Medicare include cataract surgeries, which will increase demand for next generation optical biometry devices over the coming years. Patients' increased trust in hospitals that are committed to providing all types of medical solutions will further fuel market growth.
COVID-19 Impact on Demand for Next Generation Optical Biometry Devices

COVID-19 posed significant challenges to the optical biometry devices market in recent months, pushing market participants to the limit. Companies are finding it harder to make informed judgments regarding their products, supply networks, and regulatory duties while the COVID-19 pandemic continues to unfold.

COVID-19 forced a lot of people to postpone medical treatment, which has the potential to have a significant influence on the healthcare industry. Manufacturers are figuring out how to recover from the current situation by reorganizing their sales channels and introducing new products. The global market for next generation optical biometry devices is likely to stabilize over the coming years.

Next Generation Optical Biometry Devices Market - Competitive Landscape

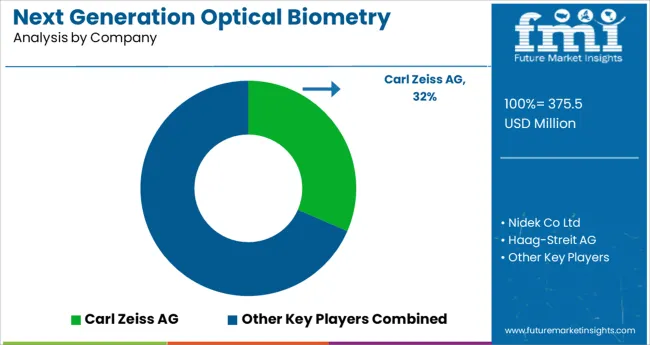
The competition section of the next generation optical biometry devices industry report features the profiles of key players based on their market shares, differentiating strategies, product offerings, and marketing approach.

  • Carl Zeiss AG offers diversified next generation optical biometry devices, which include IOL master 500 with Partial coherence interferometry (PCI) and IOL master 700 with swept-source optical coherent technology. Next generation optical biometry devices provide accuracy and efficiency, which are the foundation for calculating the IOL power.

Key manufacturers of next generation optical biometry devices are focusing on novel marketing strategies to increase product penetration. Companies supplying next generation optical biometry products are concentrating on price floor strategies and offering lucrative discounts.

Next Generation Optical Biometry Devices Market Report Scope

Attribute Details
Forecast Period 2022 to 2028
Historical Data Available for 2013 to 2021
Market Analysis Value in US$ Million, Volume in Units
Key Regions Covered North America; Latin America; Europe; East Asia; South Asia & Pacific; Middle East & Africa (MEA)
Key Countries Covered USA, Canada, Mexico, Brazil, Mexico, Argentina, Germany, Italy, France, UK, Nordic, Spain, Japan, China, India, Malaysia, Thailand, Australia, GCC Countries, South Africa, Turkey
Key Market Segments Covered Product Type, End User, Region
Key Companies Profiled Nidek Co Ltd.; Ziemer Ophthalmic Systems; TOMEY GmbH; Movu Inc.; OCULUS Optikgeräte GmbH.; Bausch & Lomb Incorporated; Topcon Corporation; Heine Optotechnik GmbH & Co. KG; AMETEK, Inc.; Optovue, Incorporated; Leica Microsystems GmbH
Pricing Available upon Request

Key Segments of Next Generation Optical Biometry Devices Industry Survey

By Product Type:

  • Swept-Source Optical Coherence Tomography (OCT) Based Biometers
  • Partial Coherence Interferometry (PCI) Based Biometers
  • Optical Low Coherence Reflectometry (OLCR) Based Biometers

By End User:

  • Hospitals
  • Ophthalmology Clinics and Specialized Eye Care Centers
  • Ambulatory Surgical Centers

By Region:

  • North America
  • Latin America
  • Europe
  • East Asia
  • South Asia & Pacific
  • Middle East & Africa (MEA)

Frequently Asked Questions

What is the Projected Growth of the Next Generation Optical Biometry Devices Market?

The next generation optical biometry devices market is anticipated to experience a CAGR of 5.4%, culminating in a market valuation of US$ 461.3 million by 2028.

What Obstacles are Hindering the Broader Adoption of Next Generation Optical Biometry Devices?

Challenges encompass high initial costs, data security concerns, privacy issues, and adapting to evolving reimbursement policies.

Which Region is the Primary User of Next Generation Optical Biometry Devices?

Fueled by the demand of 25 million people needing cataract care annually, North America leads the global next generation optical biometry devices market.

What Type of Next Generation Optical Biometry Devices Are Currently in High Demand?

Swept-source optical coherence-based biometry devices secure significant revenue due to advanced imaging, better accuracy, and suitability for complex ocular conditions.

What Factors are Driving the Demand for Next Generation Optical Biometry Devices?

Rising eye disease prevalence, growing elderly population, accuracy-boosting tech advancements, and demand for minimally invasive surgeries drive product demand.

What are the Recent Developments in the Next Generation Optical Biometry Devices Market?

A recent key development in the market involves the introduction of portable handheld devices for telemedicine applications.

Table of Content
1. Executive Summary
    1.1. Market Overview
    1.2. Market Analysis
    1.3. FMI Analysis and Recommendations
    1.4. Wheel of Fortune
2. Market Introduction
    2.1. Market Taxonomy
    2.2. Market Definition
3. Next Generation Optical Biometry Devices Market Opportunity Analysis
    3.1. Macro-Economic Factors
    3.2. Opportunity Analysis
4. Global Economic Outlook
    4.1. Global Gross Domestic Product by Region & Healthcare spending
5. Market Background
    5.1. Value Chain Analysis
    5.2. Market Dynamics
        5.2.1. Drivers
        5.2.2. Restraints
        5.2.3. Trends
6. Macroeconomic Assumptions
7. Key Inclusions
    7.1. Pricing Analysis
    7.2. Value Chain Analysis
    7.3. Regulatory Scenario
8. North America Next Generation Optical Biometry Devices Market Analysis 2013-2021 and Forecast 2022–2028
    8.1. Introduction
    8.2. Historical Market Value (US$ Mn) Analysis by Country, 2013-2021
        8.2.1. U.S.
        8.2.2. Canada
    8.3. Market Value (US$ Mn) Forecast By Country, 2022–2028
    8.4. Historical Market Value (US$ Mn) and Volume Analysis by Product Type, 2013-2021
        8.4.1. Swept-source Optical Coherence Tomography (OCT) based Biometers
        8.4.2. Partial coherence interferometry (PCI) based Biometers
        8.4.3. Optical Low Coherence Reflectometry (OLCR) based Biometers
    8.5. Market value (US$ Mn) and Volume Forecast by Product Type, 2022–2028
    8.6. Historical Market Value (US$ Mn) Trend Analysis by End User, 2013-2021
        8.6.1. Hospitals
        8.6.2. Ophthalmology clinics and specialized eye care centers
        8.6.3. Ambulatory Surgical centers
    8.7. Market Value (US$ Mn) Forecast By End User 2022–2028
    8.8. Market Attractiveness Analysis
        8.8.1. By Country
        8.8.2. By Product Type
        8.8.3. By End User
    8.9. Key Market Participants – Intensity Mapping
    8.10. Drivers and Restraints: Impact Analysis
9. Western Europe Next Generation Optical Biometry Devices Market Analysis 2013-2021 and Forecast 2022–2028
    9.1. Introduction
    9.2. Historical Market Value (US$ Mn) Analysis by Country, 2013-2021
        9.2.1. Germany
        9.2.2. U.K
        9.2.3. France
        9.2.4. Italy
        9.2.5. Spain
        9.2.6. Rest of Western Europe
    9.3. Market Value (US$ Mn) Forecast By Country, 2022–2028
    9.4. Historical Market Value (US$ Mn) and Volume Analysis by Product Type, 2013-2021
        9.4.1. Swept-source Optical Coherence Tomography (OCT) based Biometers
        9.4.2. Partial coherence interferometry (PCI) based Biometers
        9.4.3. Optical Low Coherence Reflectometry (OLCR) based Biometers
    9.5. Market value (US$ Mn) and Volume Forecast by Product Type, 2022–2028
    9.6. Historical Market Value (US$ Mn) Trend Analysis by End User, 2013-2021
        9.6.1. Hospitals
        9.6.2. Ophthalmology clinics and specialized eye care centers
        9.6.3. Ambulatory Surgical centers
    9.7. Market Value (US$ Mn) Forecast By End User 2022–2028
    9.8. Market Attractiveness Analysis
        9.8.1. By Country
        9.8.2. By Product Type
        9.8.3. By End User
    9.9. Key Market Participants – Intensity Mapping
    9.10. Drivers and Restraints: Impact Analysis
10. Eastern Europe Next Generation Optical Biometry Devices Market Analysis 2013-2021 and Forecast 2022–2028
    10.1. Introduction
    10.2. Regional Market Trends
    10.3. Historical Market Value (US$ Mn) Analysis by Country, 2013-2021
        10.3.1. Russia
        10.3.2. Poland
        10.3.3. Rest of Eastern Europe
    10.4. Market Value (US$ Mn) Forecast By Country, 2022–2028
    10.5. Historical Market Value (US$ Mn) and Volume Analysis by Product Type, 2013-2021
        10.5.1. Swept-source Optical Coherence Tomography (OCT) based Biometers
        10.5.2. Partial coherence interferometry (PCI) based Biometers
        10.5.3. Optical Low Coherence Reflectometry (OLCR) based Biometers
    10.6. Market value (US$ Mn) and Volume Forecast by Product Type, 2022–2028
    10.7. Historical Market Value (US$ Mn) Trend Analysis by End User, 2013-2021
        10.7.1. Hospitals
        10.7.2. Ophthalmology clinics and specialized eye care centers
        10.7.3. Ambulatory Surgical centers
    10.8. Market Value (US$ Mn) Forecast By End User 2022–2028
    10.9. Market Attractiveness Analysis
        10.9.1. By Country
        10.9.2. By Product Type
        10.9.3. By End User
    10.10. Key Market Participants – Intensity Mapping
    10.11. Drivers and Restraints: Impact Analysis
11. Latin America Next Generation Optical Biometry Devices Market Analysis 2013-2021 and Forecast 2022–2028
    11.1. Introduction
    11.2. Historical Market Value (US$ Mn) Analysis by Country, 2013-2021
        11.2.1. Brazil
        11.2.2. Mexico
        11.2.3. Rest of Latin America
    11.3. Market Value (US$ Mn) Forecast By Country, 2022–2028
    11.4. Historical Market Value (US$ Mn) and Volume Analysis by Product Type, 2013-2021
        11.4.1. Swept-source Optical Coherence Tomography (OCT) based Biometers
        11.4.2. Partial coherence interferometry (PCI) based Biometers
        11.4.3. Optical Low Coherence Reflectometry (OLCR) based Biometers
    11.5. Market value (US$ Mn) and Volume Forecast by Product Type, 2022–2028
    11.6. Historical Market Value (US$ Mn) Trend Analysis by End User, 2013-2021
        11.6.1. Hospitals
        11.6.2. Ophthalmology clinics and specialized eye care centers
        11.6.3. Ambulatory Surgical centers
    11.7. Market Value (US$ Mn) Forecast By End User 2022–2028
    11.8. Market Attractiveness Analysis
        11.8.1. By Country
        11.8.2. By Product Type
        11.8.3. By End User
    11.9. Key Market Participants – Intensity Mapping
    11.10. Drivers and Restraints: Impact Analysis
12. Asia Pacific Excluding China & Japan Next Generation Optical Biometry Devices Market Analysis 2013-2021 and Forecast 2022–2028
    12.1. Introduction
    12.2. Historical Market Value (US$ Mn) Analysis by Country, 2013-2021
        12.2.1. India
        12.2.2. Australia and New Zealand
        12.2.3. ASEAN
        12.2.4. Rest of APEJ
    12.3. Market Value (US$ Mn) Forecast By Country, 2022–2028
    12.4. Historical Market Value (US$ Mn) and Volume Analysis by Product Type, 2013-2021
        12.4.1. Swept-source Optical Coherence Tomography (OCT) based Biometers
        12.4.2. Partial coherence interferometry (PCI) based Biometers
        12.4.3. Optical Low Coherence Reflectometry (OLCR) based Biometers
    12.5. Market value (US$ Mn) and Volume Forecast by Product Type, 2022–2028
    12.6. Historical Market Value (US$ Mn) Trend Analysis by End User, 2013-2021
        12.6.1. Hospitals
        12.6.2. Ophthalmology clinics and specialized eye care centers
        12.6.3. Ambulatory Surgical centers
    12.7. Market Value (US$ Mn) Forecast By End User 2022–2028
    12.8. Market Attractiveness Analysis
        12.8.1. By Country
        12.8.2. By Product Type
        12.8.3. By End User
    12.9. Key Market Participants – Intensity Mapping
    12.10. Drivers and Restraints: Impact Analysis
13. Japan Next Generation Optical Biometry Devices Market Analysis 2013-2021 and Forecast 2022–2028
    13.1. Introduction
    13.2. Historical Market Value (US$ Mn) and Volume Analysis by Product Type, 2013-2021
        13.2.1. Swept-source Optical Coherence Tomography (OCT) based Biometers
        13.2.2. Partial coherence interferometry (PCI) based Biometers
        13.2.3. Optical Low Coherence Reflectometry (OLCR) based Biometers
    13.3. Market value (US$ Mn) and Volume Forecast by Product Type, 2022–2028
    13.4. Historical Market Value (US$ Mn) Trend Analysis by End User, 2013-2021
        13.4.1. Hospitals
        13.4.2. Ophthalmology clinics and specialized eye care centers
        13.4.3. Ambulatory Surgical centers
    13.5. Market Value (US$ Mn) Forecast By End User 2022–2028
    13.6. Market Attractiveness Analysis
        13.6.1. By Country
        13.6.2. By Product Type
        13.6.3. By End User
    13.7. Key Market Participants – Intensity Mapping
    13.8. Drivers and Restraints: Impact Analysis
14. Middle East and Africa Next Generation Optical Biometry Devices Market Analysis 2013-2021 and Forecast 2022–2028
    14.1. Introduction
    14.2. Historical Market Value (US$ Mn) Analysis by Country, 2013-2021
        14.2.1. GCC Countries
        14.2.2. South Africa
        14.2.3. Rest of MEA
    14.3. Market Value (US$ Mn) Forecast By Country, 2022–2028
    14.4. Historical Market Value (US$ Mn) and Volume Analysis by Product Type, 2013-2021
        14.4.1. Swept-source Optical Coherence Tomography (OCT) based Biometers
        14.4.2. Partial coherence interferometry (PCI) based Biometers
        14.4.3. Optical Low Coherence Reflectometry (OLCR) based Biometers
    14.5. Market value (US$ Mn) and Volume Forecast by Product Type, 2022–2028
    14.6. Historical Market Value (US$ Mn) Trend Analysis by End User, 2013-2021
        14.6.1. Hospitals
        14.6.2. Ophthalmology clinics and specialized eye care centers
        14.6.3. Ambulatory Surgical centers
    14.7. Market Value (US$ Mn) Forecast By End User 2022–2028
    14.8. Market Attractiveness Analysis
        14.8.1. By Country
        14.8.2. By Product Type
        14.8.3. By End User
    14.9. Key Market Participants – Intensity Mapping
    14.10. Drivers and Restraints: Impact Analysis
15. Forecast Factors: Relevance and Impact
16. Forecast Assumptions
17. Market Structure Analysis
    17.1. Market Structure by Tier
    17.2. Product Mapping by Key Manufacturer
18. Competition Analysis
    18.1. Competition Dashboard
    18.2. Competition Benchmarking
    18.3. Profitability and Gross Margin Analysis by Competition
    18.4. Competitors Deep Dive
        18.4.1. Carl Zeiss AG
            18.4.1.1. Overview
            18.4.1.2. Product and Application Portfolio
            18.4.1.3. Production Footprint
            18.4.1.4. Sales Footprint
            18.4.1.5. Channel Footprint
            18.4.1.6. Strategy
                18.4.1.6.1. Marketing Strategy
                18.4.1.6.2. Product Strategy
                18.4.1.6.3. Channel Strategy
        18.4.2. Nidek Co Ltd
            18.4.2.1. Overview
            18.4.2.2. Product and Application Portfolio
            18.4.2.3. Production Footprint
            18.4.2.4. Sales Footprint
            18.4.2.5. Channel Footprint
            18.4.2.6. Strategy
                18.4.2.6.1. Marketing Strategy
                18.4.2.6.2. Product Strategy
                18.4.2.6.3. Channel Strategy
        18.4.3. Haag-Streit AG
            18.4.3.1. Overview
            18.4.3.2. Product and Application Portfolio
            18.4.3.3. Production Footprint
            18.4.3.4. Sales Footprint
            18.4.3.5. Channel Footprint
            18.4.3.6. Strategy
                18.4.3.6.1. Marketing Strategy
                18.4.3.6.2. Product Strategy
                18.4.3.6.3. Channel Strategy
        18.4.4. Ziemer Ophthalmic Systems
            18.4.4.1. Overview
            18.4.4.2. Product and Application Portfolio
            18.4.4.3. Production Footprint
            18.4.4.4. Sales Footprint
            18.4.4.5. Channel Footprint
            18.4.4.6. Strategy
                18.4.4.6.1. Marketing Strategy
                18.4.4.6.2. Product Strategy
                18.4.4.6.3. Channel Strategy
        18.4.5. Optovue, Incorporated
            18.4.5.1. Overview
            18.4.5.2. Product and Application Portfolio
            18.4.5.3. Production Footprint
            18.4.5.4. Sales Footprint
            18.4.5.5. Channel Footprint
            18.4.5.6. Strategy
                18.4.5.6.1. Marketing Strategy
                18.4.5.6.2. Product Strategy
                18.4.5.6.3. Channel Strategy
        18.4.6. Topcon Corporation
            18.4.6.1. Overview
            18.4.6.2. Product and Application Portfolio
            18.4.6.3. Production Footprint
            18.4.6.4. Sales Footprint
            18.4.6.5. Channel Footprint
            18.4.6.6. Strategy
                18.4.6.6.1. Marketing Strategy
                18.4.6.6.2. Product Strategy
                18.4.6.6.3. Channel Strategy
        18.4.7. TOMEY GmbH
            18.4.7.1. Overview
            18.4.7.2. Product and Application Portfolio
            18.4.7.3. Production Footprint
            18.4.7.4. Sales Footprint
            18.4.7.5. Channel Footprint
            18.4.7.6. Strategy
                18.4.7.6.1. Marketing Strategy
                18.4.7.6.2. Product Strategy
                18.4.7.6.3. Channel Strategy
        18.4.8. Movu Inc.
            18.4.8.1. Overview
            18.4.8.2. Product and Application Portfolio
            18.4.8.3. Production Footprint
            18.4.8.4. Sales Footprint
            18.4.8.5. Channel Footprint
            18.4.8.6. Strategy
                18.4.8.6.1. Marketing Strategy
                18.4.8.6.2. Product Strategy
                18.4.8.6.3. Channel Strategy
        18.4.9. Newway Technology
            18.4.9.1. Overview
            18.4.9.2. Product and Application Portfolio
            18.4.9.3. Production Footprint
            18.4.9.4. Sales Footprint
            18.4.9.5. Channel Footprint
            18.4.9.6. Strategy
                18.4.9.6.1. Marketing Strategy
                18.4.9.6.2. Product Strategy
                18.4.9.6.3. Channel Strategy
19. Global Next Generation Optical Biometry Devices Market Analysis 2013-2021 and Forecast 2022–2028 by Region
    19.1. Introduction / Key Findings
    19.2. Historical Market Size (US$ Mn) Analysis by Region
        19.2.1. North America
        19.2.2. Western Europe
        19.2.3. Eastern Europe
        19.2.4. Latin America
        19.2.5. Asia Pacific Excluding Japan
        19.2.6. Japan
        19.2.7. Middle East and Africa
    19.3. Market Size (US$ Mn) Forecast By Region
    19.4. Market Attractiveness Analysis by Region
20. Next Generation Optical Biometry Devices Market Analysis 2013-2021 and Forecast 2022–2028, By Product Type
    20.1. Introduction/Key Finding
    20.2. Historical Market Value (US$ Mn) and Volume Analysis by Product Type, 2013-2021
        20.2.1. Swept-source Optical Coherence Tomography (OCT) based Biometers
        20.2.2. Partial coherence interferometry (PCI) based Biometers
        20.2.3. Optical Low Coherence Reflectometry (OLCR)based Biometers
    20.3. Market Size (US$ Mn) Forecast By Product Type, 2022–2028
    20.4. Market Attractiveness Analysis by Product Type
21. Next Generation Optical Biometry Devices Market Analysis 2013-2021 and Forecast 2022–2028, By End User
    21.1. Introduction/Key Finding
    21.2. Historical Market Size (US$ Mn) Analysis by End User, 2013-2021
        21.2.1. Hospitals
        21.2.2. Ophthalmology clinics and specialized eye care centers
        21.2.3. Ambulatory Surgical centers
    21.3. Market Size (US$ Mn) Forecast By End User, 2022–2028
    21.4. Market Attractiveness Analysis by End User
22. Next Generation Optical Biometry Devices Market Analysis 2013-2021 and Forecast 2022–2028
    22.1. Market Value Share Analysis by All Segment
    22.2. Y-o-Y Growth Analysis by All Segment
    22.3. Absolute $ Opportunity
23. Assumptions and Acronyms Used
24. Research Methodology
Recommendations

Healthcare

Ophthalmic Diagnostic Equipment Market

March 2024

REP-GB-771

347 pages

Healthcare

Ophthalmic Eye Drop Market

March 2024

REP-GB-13140

495 pages

Healthcare

Optical Coherence Tomography Market

November 2023

REP-GB-3362

342 pages

Healthcare

Ophthalmic Lasers Market

June 2022

REP-GB-1529

294 pages

Explore Healthcare Insights

View Reports
Future Market Insights

Next Generation Optical Biometry Devices Market

Schedule a Call