Reports

- Global Locations -

Headquarters

Future Market Insights, Inc.

Christiana Corporate, 200
Continental Drive, Suite 401,
Newark, Delaware - 19713,
United States

T: +1-845-579-5705

Americas

Future Market Insights, Inc.

616 Corporate Way, Suite 2-9018,
Valley Cottage, NY 10989, United States

T: +1-347-918-3531

MEA

Future Market Insights

1602-6 Jumeirah Bay X2 Tower, Plot No: JLT-PH2-X2A,
Jumeirah Lakes Towers, Dubai,
United Arab Emirates

Europe

Future Market Insights

3rd Floor, 207 Regent Street,
W1B 3HH London
United Kingdom

T: + 44 (0) 20 8123 9659
D: +44 (0) 20 3287 4268

Asia Pacific

Future Market Insights

IndiaLand Global Tech Park, Unit UG-1, Behind Grand HighStreet, Phase 1, Hinjawadi, MH, Pune – 411057, India

Next Generation Packaging Market Outlook for 2023 to 2033

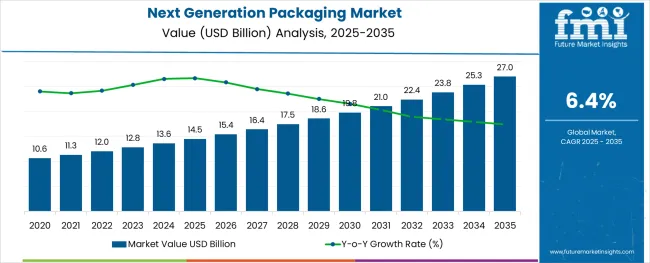
The global next generation packaging market is on track to achieve a market valuation of US$ 12,847.9 million by 2023. Demand is set to gain momentum at a projected CAGR of 6.43% from 2023 to 2033. The market is expected to reach US$ 23,952.9 million by 2033.

Key Trends and Highlights

  • The increasing emphasis on sustainability and eco-friendly packaging solutions is driving market growth. Growing environmental concerns and stricter regulations, manufacturers are facilitating a shift towards recyclable and biodegradable packaging materials.
  • The integration of Internet of Things (IoT) technology in packaging is gaining momentum. Smart packaging solutions, including sensors, indicators, and tags, are being used to provide real-time information about product quality, freshness, and usage.
  • In an era of personalization, brands are increasingly focusing on creating customized packaging to connect with consumers on a personal level. Personalized packaging not only attracts attention but also enhances brand loyalty.
  • A booming e-commerce industry has led to innovations in packaging to meet the unique needs of online retail. Companies are designing packaging solutions that are not only protective but also cost-effective and environmentally friendly.
Attributes Key Insights
Next Generation Packaging Market Estimated Size in 2023 US$ 12,847.9 million
Projected Market Size in 2033 US$ 23,952.9 million
Value-based CAGR from 2023 to 2033 6.43%

Don't pay for what you don't need

Customize your report by selecting specific countries or regions and save 30%!

2018 to 2022 Historical Analysis vs. 2023 to 2033 Market Forecast Projections

The scope for global next-generation packaging market insights rose at a 2.76% CAGR between 2018 and 2022. The next-generation packaging market is anticipated to develop at a moderate CAGR of 6.43% over the forecast period from 2023 to 2033.

Attributes Details
Market Value in 2018 US$ 11,480.2 million
Market Value in 2022 US$ 12,800.3 million
CAGR from 2018 to 2022 2.76%

The global next-generation packaging market is poised for substantial growth in the coming years, primarily driven by several key factors. The aging global population is creating a heightened demand for packaging solutions that cater to the specific needs of elderly consumers, such as easy-open features and clear labeling.

Advancements in packaging materials are further contributing to the market's expansion, as innovative materials offer improved preservation and protection of products while aligning with sustainability goals.

A notable trend accompanying this growth is the increasing investment in research and development within the packaging technology sector. Companies are keen on enhancing their packaging offerings, whether through smart packaging solutions or eco-friendly materials.

The widespread adoption of QR codes on packaging is another significant trend, enabling brands to provide consumers with valuable information, promotions, and engagement opportunities.

The development of advanced sensors is revolutionizing the way packaging interacts with products, ensuring freshness, authenticity, and quality assurance. The trends collectively shape the future landscape of the next-generation packaging market, promising further innovation and sustainability in the industry.

Next Generation Packaging Market Advancing Factors

  • One prominent driver is the growing emphasis on product quality information and traceability. Modern consumers are increasingly concerned about the origin and quality of products, which has led to the adoption of advanced packaging technologies that enable detailed tracking and monitoring throughout the supply chain.
  • The need for products with extended shelf life is a significant driving force in this market. As businesses strive to reduce food waste and ensure product freshness, next-generation packaging solutions offer innovative ways to extend the lifespan of perishable goods, which resonates with both consumers and producers.
  • Sustainability and environmental consciousness are driving the adoption of eco-friendly packaging materials and techniques. Brands are recognizing the importance of minimizing their ecological footprint, which is prompting the shift towards more sustainable packaging options.
  • The increasing integration of technology in packaging, such as smart labels and sensors, is enhancing the functionality and value proposition of next-generation packaging. The technologies provide real-time data, improve convenience, and enhance the overall consumer experience, driving market growth in this technologically driven era.
Ismail Sutaria
Ismail Sutaria

Principal Consultant

Talk to Analyst

Find your sweet spots for generating winning opportunities in this market.

Comparative View of Adjacent Next Generation Packaging Market

Future Market Insights has analyzed three markets, namely the next generation packaging market, intelligent packaging market, and the time temperature indicator labels market.

The analysis showcases that the next generation packaging industry is set to dominate among these three markets over the forecast period from 2023 to 2033.

Next Generation Packaging Market:

CAGR from 2023 to 2033 6.43%
Market Value in 2033 US$ 23,952.9 million
Key Trends
  • The growth of the next-generation packaging market includes increasing research and development spending on packaging technology.
Opportunity
  • Product quality information and traceability helps in monitoring and tracking the product during transportation.

Intelligent Packaging Market:

CAGR from 2023 to 2033 5.93%
Market Value in 2033 US$ 20,490 million
Key Trends
  • Track & trace packaging drives smart and connected packaging sales.
Opportunity
  • Technology-based packaging helps to reduce the sales of counterfeit products & provides the product with a unique identity that protects the product from counterfeit issues.

Time Temperature Indicator Labels Market:

CAGR from 2023 to 2033 5.88%
Market Value in 2033 US$ 19,999.9 million
Key Trends
  • Consumers’ growing preference for optimal temperature handling is poised to provide a boost to market acceleration.
Opportunity
  • Diagnoses product degradation and notify users via alerts, presenting a significant opportunity to ensure product quality and safety throughout the supply chain.

Category-wise Insights

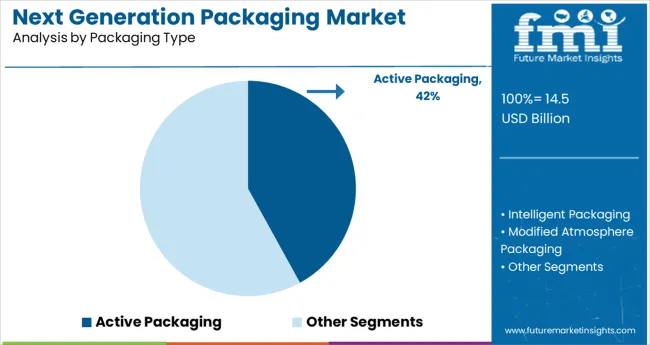
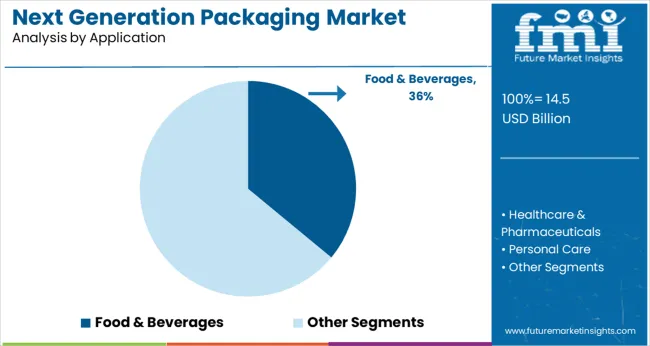
From the below table, it is evident that active packaging is expected to acquire a 43.6% revenue share in 2033. The table further continues with details about how food & beverage are anticipated to witness a market share of 41.2% through 2033.

Category Market Share by 2033
Active Packaging 43.6%
Food & Beverage 41.2%

Positive Impacts of Next-Generation Packaging in the Food & Beverage Sector

The food and beverage sector within the next-generation packaging market offers a range of significant advantages. These include safeguarding food against contamination, extending the shelf life of food products, and enhancing overall operational efficiency.

These factors are poised to drive substantial growth within the food packaging industry. Changing demographics, such as smaller household sizes, increasing disposable incomes, and a growing population, are expected to have a positive influence on the market.

Dominance of Active Packaging in the Next-Generation Packaging Market

Active packaging, with its diverse range of benefits such as enhanced product freshness, prolonged shelf life, and protection against contamination, commands a substantial share of over 43.6% in the global next-generation packaging market.

This dominance is anticipated to persist steadily throughout the forecast period, underlining its pivotal role in shaping the future of packaging solutions across various industries.

Get the data you need at a Fraction of the cost

Personalize your report by choosing insights you need
and save 40%!

Region-wise Insights

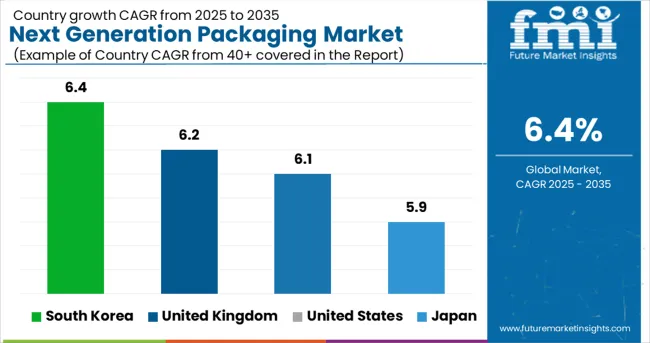
The below table showcases revenues in terms of the five regions, spearheaded by North America, Europe, Asia Pacific, and Latin America. Out of these countries, North America is leading followed by Europe.

Market Share in 2023

North America 19.3%
Europe 10.3%
Asia Pacific 8.7%
Latin America 7.1%

North America a Thriving Retail Hub and Manufacturing Powerhouse

The retail sector in North America is experiencing robust growth, fueled by consumer preferences for convenient and packaged food products. The trend is poised to significantly boost the demand for advanced packaging solutions in the region. North America enjoys a competitive advantage with a multitude of packaging manufacturers operating within its borders, further supporting the industry's expansion.

The combination of a thriving retail landscape and a well-established manufacturing base positions North America as a key player in the global packaging market. As consumers continue to seek convenience and reliable packaging for their purchases, the region is primed for sustained growth in the packaging sector, offering innovative solutions to meet evolving market demands.

Resilient European Market Poised for Growth despite Saturation

Europe, despite reaching a high level of market saturation, is poised for continued growth in the next-generation packaging sector. The region's single market policy, which facilitates free trade among European countries, is a key driver of this optimistic outlook. The seamless flow of goods within the European Union encourages exports, providing a conducive environment for industry expansion. The region’s analysis includes both Western and Eastern Europe.

Europe’s consumers and businesses are increasingly embracing sustainability and environmental consciousness, which aligns with the goals of next-generation packaging technologies.

As the demand for eco-friendly and smart packaging solutions continues to rise, Europe is likely to witness sustained growth in the next-generation packaging market, driven by the need for innovative and environmentally responsible packaging solutions.

Booming Food Packaging Sector in Asia Pacific Poised for Growth

The food packaging industry in the Asia Pacific is on the brink of significant expansion, driven by a confluence of factors. The region covers an analysis of the next generation packaging landscape in East Asia and South Asia & Pacific.

Rising per capita income, a steadily increasing population, and a surging demand for packaged food are particularly fuelling this growth trajectory. Emerging economies such as India, Japan, and China are leading the charge in the region, experiencing a growing appetite for packaged food products.

As consumers' disposable income levels continue to rise, there is a notable shift towards convenience and processed foods across the Asia Pacific. This trend, coupled with the region's burgeoning population, presents a substantial market opportunity for food packaging solutions. Manufacturers are increasingly focusing on innovative and sustainable packaging technologies to meet evolving consumer demands and capitalize on the burgeoning food packaging sector in the region.

Latin America's Food Packaging Sector Set for Rapid Growth

The food packaging industry in Latin America is poised for substantial growth, driven primarily by two key factors. Firstly, the region's expanding middle class, accompanied by a considerable increase in purchasing power, is changing consumption patterns and fueling the demand for packaged food products. This rising affluence is leading to a shift towards convenience and packaged foods, propelling the food packaging industry forward.

On another front, India stands out as the fastest-growing market in the food packaging sector. The country's burgeoning retail chains are experiencing a surge in popularity, contributing significantly to the increased demand for food packaging solutions.

As more consumers turn to organized retail outlets and modern supermarkets, the need for efficient and appealing food packaging becomes paramount. This trend is expected to continue driving the growth of the food packaging industry in India, making it a prominent player in the global landscape.

Competitive Landscape

Major next-generation packaging market players are innovating to address critical care requirements and boost user confidence, fostering market expansion. The growing elderly population is expected to significantly impact market growth, driving manufacturers to develop competitive products.

Some of the recent developments are:

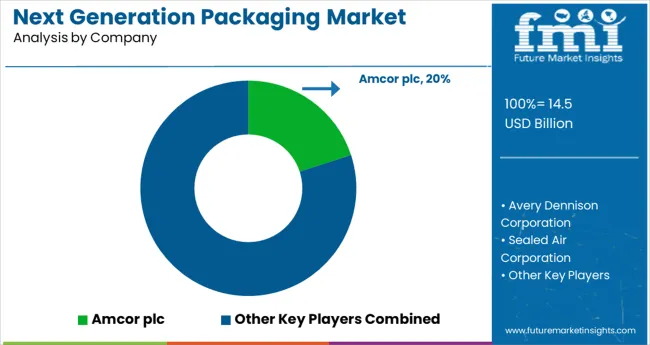
  • In December 2021, Amcor acquired Packaging India Private Ltd. (PIPL) from Essel Propack, a publicly listed specialty packaging company, for INR 1,650 million (US$ 26.4 million).
  • Amcor has launched AmLite Ultra Recyclable, its first packaging product made from the company's revolutionary, more sustainable high-barrier polyolefin film that the company had announced previously.
  • Sonoco, one of the largest sustainable global packaging companies, announced the completion of its inaugural offering of green bonds to support the Company’s sustainability strategy.
  • Sonoco announced at its annual shareholders meeting that it will increase production capabilities and support R&D innovation through several significant growth projects for its Consumer Packaging businesses.

Report Scope

Attributes Details
Estimated Market Size in 2023 US$ 12,847.9 million
Projected Market Valuation in 2033 US$ 23,952.9 million
CAGR Share from 2023 to 2033 6.43%
Forecast Period 2023 to 2033
Historical Data Available for 2018 to 2022
Market Analysis Value in US$ million
Key Regions Covered
  • North America
  • Latin America
  • Western Europe
  • Eastern Europe
  • South Asia and Pacific
  • East Asia
  • The Middle East & Africa
Key Market Segments Covered
  • Packaging Type
  • Application
  • Region
Key Countries Profiled
  • The United States
  • Canada
  • Brazil
  • Mexico
  • Germany
  • The United Kingdom
  • France
  • Spain
  • Italy
  • Russia
  • Poland
  • Czech Republic
  • Romania
  • India
  • Bangladesh
  • Australia
  • New Zealand
  • China
  • Japan
  • South Korea
  • GCC countries
  • South Africa
  • Israel
Key Companies Profiled
  • Amcor Limited
  • WestRock Company
  • Sonoco Products Company
  • Sealed Air Corporation
  • Stora Enso Oyj
  • Bemis Company, Inc.
  • MULTIVAC
  • WS Packaging Group, Inc.
  • Active Packaging Limited
  • ULMA Packaging
  • S. Coop

Key Segments Covered

Packaging Type:

  • Active Packaging
    • Antimicrobials
    • Gas Scavengers
    • Gas Emitters
    • Others (Moisture & Corrosion Control)
  • Intelligent Packaging
    • Sensors
    • Indicators
    • Tags
  • Modified Atmosphere Packaging

By Application:

  • Food & Beverages
  • Healthcare & Pharmaceuticals
  • Personal Care
  • Logistics & Supply Chain
  • Others (Automotive & Industrial)

By Region:

  • North America
  • Latin America
  • Western Europe
  • Eastern Europe
  • East Asia
  • South Asia & Pacific
  • The Middle East & Africa

Frequently Asked Questions

What is the expected Next Generation Packaging Market valuation on 2023?

The market is expected to reach a valuation of US$ 12,847.9 million in 2023.

What is the Projected CAGR for the Market through 2033?

The market is set to expand by a CAGR of 6.43% by 2033.

How much Valuation is Projected for the Market in 2033?

The market is forecasted to reach US$ 23,952.9 million by 2033.

Which is the Leading Packaging Type in the market?

Active packaging is preferred and are expected to rise at a market share of 43.6% through 2033

Table of Content

1. Executive Summary

    1.1. Global Market Outlook

    1.2. Demand-side Trends

    1.3. Supply-side Trends

    1.4. Technology Roadmap Analysis

    1.5. Analysis and Recommendations

2. Market Overview

    2.1. Market Coverage / Taxonomy

    2.2. Market Definition / Scope / Limitations

3. Market Background

    3.1. Market Dynamics

        3.1.1. Drivers

        3.1.2. Restraints

        3.1.3. Opportunity

        3.1.4. Trends

    3.2. Scenario Forecast

        3.2.1. Demand in Optimistic Scenario

        3.2.2. Demand in Likely Scenario

        3.2.3. Demand in Conservative Scenario

    3.3. Opportunity Map Analysis

    3.4. Product Life Cycle Analysis

    3.5. Supply Chain Analysis

        3.5.1. Supply Side Participants and their Roles

            3.5.1.1. Producers

            3.5.1.2. Mid-Level Participants (Traders/ Agents/ Brokers)

            3.5.1.3. Wholesalers and Distributors

        3.5.2. Value Added and Value Created at Node in the Supply Chain

        3.5.3. List of Raw Material Suppliers

        3.5.4. List of Existing and Potential Buyer’s

    3.6. Investment Feasibility Matrix

    3.7. Value Chain Analysis

        3.7.1. Profit Margin Analysis

        3.7.2. Wholesalers and Distributors

        3.7.3. Retailers

    3.8. PESTLE and Porter’s Analysis

    3.9. Regulatory Landscape

        3.9.1. By Key Regions

        3.9.2. By Key Countries

    3.10. Regional Parent Market Outlook

    3.11. Production and Consumption Statistics

    3.12. Import and Export Statistics

4. Global Market Analysis 2018 to 2022 and Forecast, 2023 to 2033

    4.1. Historical Market Size Value (US$ Million) & Volume (Units) Analysis, 2018 to 2022

    4.2. Current and Future Market Size Value (US$ Million) & Volume (Units) Projections, 2023 to 2033

        4.2.1. Y-o-Y Growth Trend Analysis

        4.2.2. Absolute $ Opportunity Analysis

5. Global Market Analysis 2018 to 2022 and Forecast 2023 to 2033, By Packaging Type

    5.1. Introduction / Key Findings

    5.2. Historical Market Size Value (US$ Million) & Volume (Units) Analysis By Packaging Type, 2018 to 2022

    5.3. Current and Future Market Size Value (US$ Million) & Volume (Units) Analysis and Forecast By Packaging Type, 2023 to 2033

        5.3.1. Active Packaging

            5.3.1.1. Antimicrobials

            5.3.1.2. Gas Scavengers

            5.3.1.3. Gas Emitters

            5.3.1.4. Others

        5.3.2. Intelligent Packaging

            5.3.2.1. Sensors

            5.3.2.2. Indicators

            5.3.2.3. Tags

        5.3.3. Modified Atmosphere Packaging

    5.4. Y-o-Y Growth Trend Analysis By Packaging Type, 2018 to 2022

    5.5. Absolute $ Opportunity Analysis By Packaging Type, 2023 to 2033

6. Global Market Analysis 2018 to 2022 and Forecast 2023 to 2033, By Application

    6.1. Introduction / Key Findings

    6.2. Historical Market Size Value (US$ Million) & Volume (Units) Analysis By Application, 2018 to 2022

    6.3. Current and Future Market Size Value (US$ Million) & Volume (Units) Analysis and Forecast By Application, 2023 to 2033

        6.3.1. Food & Beverages

        6.3.2. Healthcare & Pharmaceuticals

        6.3.3. Personal Care

        6.3.4. Logistics & Supply Chain

        6.3.5. Others

    6.4. Y-o-Y Growth Trend Analysis By Application, 2018 to 2022

    6.5. Absolute $ Opportunity Analysis By Application, 2023 to 2033

7. Global Market Analysis 2018 to 2022 and Forecast 2023 to 2033, By Region

    7.1. Introduction

    7.2. Historical Market Size Value (US$ Million) & Volume (Units) Analysis By Region, 2018 to 2022

    7.3. Current Market Size Value (US$ Million) & Volume (Units) Analysis and Forecast By Region, 2023 to 2033

        7.3.1. North America

        7.3.2. Latin America

        7.3.3. Western Europe

        7.3.4. Eastern Europe

        7.3.5. South Asia and Pacific

        7.3.6. East Asia

        7.3.7. Middle East and Africa

    7.4. Market Attractiveness Analysis By Region

8. North America Market Analysis 2018 to 2022 and Forecast 2023 to 2033, By Country

    8.1. Historical Market Size Value (US$ Million) & Volume (Units) Trend Analysis By Market Taxonomy, 2018 to 2022

    8.2. Market Size Value (US$ Million) & Volume (Units) Forecast By Market Taxonomy, 2023 to 2033

        8.2.1. By Country

            8.2.1.1. The USA

            8.2.1.2. Canada

        8.2.2. By Packaging Type

        8.2.3. By Application

    8.3. Market Attractiveness Analysis

        8.3.1. By Country

        8.3.2. By Packaging Type

        8.3.3. By Application

    8.4. Key Takeaways

9. Latin America Market Analysis 2018 to 2022 and Forecast 2023 to 2033, By Country

    9.1. Historical Market Size Value (US$ Million) & Volume (Units) Trend Analysis By Market Taxonomy, 2018 to 2022

    9.2. Market Size Value (US$ Million) & Volume (Units) Forecast By Market Taxonomy, 2023 to 2033

        9.2.1. By Country

            9.2.1.1. Brazil

            9.2.1.2. Mexico

            9.2.1.3. Rest of Latin America

        9.2.2. By Packaging Type

        9.2.3. By Application

    9.3. Market Attractiveness Analysis

        9.3.1. By Country

        9.3.2. By Packaging Type

        9.3.3. By Application

    9.4. Key Takeaways

10. Western Europe Market Analysis 2018 to 2022 and Forecast 2023 to 2033, By Country

    10.1. Historical Market Size Value (US$ Million) & Volume (Units) Trend Analysis By Market Taxonomy, 2018 to 2022

    10.2. Market Size Value (US$ Million) & Volume (Units) Forecast By Market Taxonomy, 2023 to 2033

        10.2.1. By Country

            10.2.1.1. Germany

            10.2.1.2. United Kingdom

            10.2.1.3. France

            10.2.1.4. Spain

            10.2.1.5. Italy

            10.2.1.6. Rest of Western Europe

        10.2.2. By Packaging Type

        10.2.3. By Application

    10.3. Market Attractiveness Analysis

        10.3.1. By Country

        10.3.2. By Packaging Type

        10.3.3. By Application

    10.4. Key Takeaways

11. Eastern Europe Market Analysis 2018 to 2022 and Forecast 2023 to 2033, By Country

    11.1. Historical Market Size Value (US$ Million) & Volume (Units) Trend Analysis By Market Taxonomy, 2018 to 2022

    11.2. Market Size Value (US$ Million) & Volume (Units) Forecast By Market Taxonomy, 2023 to 2033

        11.2.1. By Country

            11.2.1.1. Poland

            11.2.1.2. Russia

            11.2.1.3. Czech Republic

            11.2.1.4. Romania

            11.2.1.5. Rest of Eastern Europe

        11.2.2. By Packaging Type

        11.2.3. By Application

    11.3. Market Attractiveness Analysis

        11.3.1. By Country

        11.3.2. By Packaging Type

        11.3.3. By Application

    11.4. Key Takeaways

12. South Asia and Pacific Market Analysis 2018 to 2022 and Forecast 2023 to 2033, By Country

    12.1. Historical Market Size Value (US$ Million) & Volume (Units) Trend Analysis By Market Taxonomy, 2018 to 2022

    12.2. Market Size Value (US$ Million) & Volume (Units) Forecast By Market Taxonomy, 2023 to 2033

        12.2.1. By Country

            12.2.1.1. India

            12.2.1.2. Bangladesh

            12.2.1.3. Australia

            12.2.1.4. New Zealand

            12.2.1.5. Rest of South Asia and Pacific

        12.2.2. By Packaging Type

        12.2.3. By Application

    12.3. Market Attractiveness Analysis

        12.3.1. By Country

        12.3.2. By Packaging Type

        12.3.3. By Application

    12.4. Key Takeaways

13. East Asia Market Analysis 2018 to 2022 and Forecast 2023 to 2033, By Country

    13.1. Historical Market Size Value (US$ Million) & Volume (Units) Trend Analysis By Market Taxonomy, 2018 to 2022

    13.2. Market Size Value (US$ Million) & Volume (Units) Forecast By Market Taxonomy, 2023 to 2033

        13.2.1. By Country

            13.2.1.1. China

            13.2.1.2. Japan

            13.2.1.3. South Korea

        13.2.2. By Packaging Type

        13.2.3. By Application

    13.3. Market Attractiveness Analysis

        13.3.1. By Country

        13.3.2. By Packaging Type

        13.3.3. By Application

    13.4. Key Takeaways

14. Middle East and Africa Market Analysis 2018 to 2022 and Forecast 2023 to 2033, By Country

    14.1. Historical Market Size Value (US$ Million) & Volume (Units) Trend Analysis By Market Taxonomy, 2018 to 2022

    14.2. Market Size Value (US$ Million) & Volume (Units) Forecast By Market Taxonomy, 2023 to 2033

        14.2.1. By Country

            14.2.1.1. GCC Countries

            14.2.1.2. South Africa

            14.2.1.3. Israel

            14.2.1.4. Rest of MEA

        14.2.2. By Packaging Type

        14.2.3. By Application

    14.3. Market Attractiveness Analysis

        14.3.1. By Country

        14.3.2. By Packaging Type

        14.3.3. By Application

    14.4. Key Takeaways

15. Key Countries Market Analysis

    15.1. USA

        15.1.1. Pricing Analysis

        15.1.2. Market Share Analysis, 2022

            15.1.2.1. By Packaging Type

            15.1.2.2. By Application

    15.2. Canada

        15.2.1. Pricing Analysis

        15.2.2. Market Share Analysis, 2022

            15.2.2.1. By Packaging Type

            15.2.2.2. By Application

    15.3. Brazil

        15.3.1. Pricing Analysis

        15.3.2. Market Share Analysis, 2022

            15.3.2.1. By Packaging Type

            15.3.2.2. By Application

    15.4. Mexico

        15.4.1. Pricing Analysis

        15.4.2. Market Share Analysis, 2022

            15.4.2.1. By Packaging Type

            15.4.2.2. By Application

    15.5. Germany

        15.5.1. Pricing Analysis

        15.5.2. Market Share Analysis, 2022

            15.5.2.1. By Packaging Type

            15.5.2.2. By Application

    15.6. United Kingdom

        15.6.1. Pricing Analysis

        15.6.2. Market Share Analysis, 2022

            15.6.2.1. By Packaging Type

            15.6.2.2. By Application

    15.7. France

        15.7.1. Pricing Analysis

        15.7.2. Market Share Analysis, 2022

            15.7.2.1. By Packaging Type

            15.7.2.2. By Application

    15.8. Spain

        15.8.1. Pricing Analysis

        15.8.2. Market Share Analysis, 2022

            15.8.2.1. By Packaging Type

            15.8.2.2. By Application

    15.9. Italy

        15.9.1. Pricing Analysis

        15.9.2. Market Share Analysis, 2022

            15.9.2.1. By Packaging Type

            15.9.2.2. By Application

    15.10. Poland

        15.10.1. Pricing Analysis

        15.10.2. Market Share Analysis, 2022

            15.10.2.1. By Packaging Type

            15.10.2.2. By Application

    15.11. Russia

        15.11.1. Pricing Analysis

        15.11.2. Market Share Analysis, 2022

            15.11.2.1. By Packaging Type

            15.11.2.2. By Application

    15.12. Czech Republic

        15.12.1. Pricing Analysis

        15.12.2. Market Share Analysis, 2022

            15.12.2.1. By Packaging Type

            15.12.2.2. By Application

    15.13. Romania

        15.13.1. Pricing Analysis

        15.13.2. Market Share Analysis, 2022

            15.13.2.1. By Packaging Type

            15.13.2.2. By Application

    15.14. India

        15.14.1. Pricing Analysis

        15.14.2. Market Share Analysis, 2022

            15.14.2.1. By Packaging Type

            15.14.2.2. By Application

    15.15. Bangladesh

        15.15.1. Pricing Analysis

        15.15.2. Market Share Analysis, 2022

            15.15.2.1. By Packaging Type

            15.15.2.2. By Application

    15.16. Australia

        15.16.1. Pricing Analysis

        15.16.2. Market Share Analysis, 2022

            15.16.2.1. By Packaging Type

            15.16.2.2. By Application

    15.17. New Zealand

        15.17.1. Pricing Analysis

        15.17.2. Market Share Analysis, 2022

            15.17.2.1. By Packaging Type

            15.17.2.2. By Application

    15.18. China

        15.18.1. Pricing Analysis

        15.18.2. Market Share Analysis, 2022

            15.18.2.1. By Packaging Type

            15.18.2.2. By Application

    15.19. Japan

        15.19.1. Pricing Analysis

        15.19.2. Market Share Analysis, 2022

            15.19.2.1. By Packaging Type

            15.19.2.2. By Application

    15.20. South Korea

        15.20.1. Pricing Analysis

        15.20.2. Market Share Analysis, 2022

            15.20.2.1. By Packaging Type

            15.20.2.2. By Application

    15.21. GCC Countries

        15.21.1. Pricing Analysis

        15.21.2. Market Share Analysis, 2022

            15.21.2.1. By Packaging Type

            15.21.2.2. By Application

    15.22. South Africa

        15.22.1. Pricing Analysis

        15.22.2. Market Share Analysis, 2022

            15.22.2.1. By Packaging Type

            15.22.2.2. By Application

    15.23. Israel

        15.23.1. Pricing Analysis

        15.23.2. Market Share Analysis, 2022

            15.23.2.1. By Packaging Type

            15.23.2.2. By Application

16. Market Structure Analysis

    16.1. Competition Dashboard

    16.2. Competition Benchmarking

    16.3. Market Share Analysis of Top Players

        16.3.1. By Regional

        16.3.2. By Packaging Type

        16.3.3. By Application

17. Competition Analysis

    17.1. Competition Deep Dive

        17.1.1. Amcor Limited

            17.1.1.1. Overview

            17.1.1.2. Product Portfolio

            17.1.1.3. Profitability by Market Segments

            17.1.1.4. Sales Footprint

            17.1.1.5. Strategy Overview

                17.1.1.5.1. Marketing Strategy

                17.1.1.5.2. Product Strategy

                17.1.1.5.3. Channel Strategy

        17.1.2. WestRock Company

            17.1.2.1. Overview

            17.1.2.2. Product Portfolio

            17.1.2.3. Profitability by Market Segments

            17.1.2.4. Sales Footprint

            17.1.2.5. Strategy Overview

                17.1.2.5.1. Marketing Strategy

                17.1.2.5.2. Product Strategy

                17.1.2.5.3. Channel Strategy

        17.1.3. Sonoco Products Company

            17.1.3.1. Overview

            17.1.3.2. Product Portfolio

            17.1.3.3. Profitability by Market Segments

            17.1.3.4. Sales Footprint

            17.1.3.5. Strategy Overview

                17.1.3.5.1. Marketing Strategy

                17.1.3.5.2. Product Strategy

                17.1.3.5.3. Channel Strategy

        17.1.4. Sealed Air Corporation

            17.1.4.1. Overview

            17.1.4.2. Product Portfolio

            17.1.4.3. Profitability by Market Segments

            17.1.4.4. Sales Footprint

            17.1.4.5. Strategy Overview

                17.1.4.5.1. Marketing Strategy

                17.1.4.5.2. Product Strategy

                17.1.4.5.3. Channel Strategy

        17.1.5. Stora Enso Oyj

            17.1.5.1. Overview

            17.1.5.2. Product Portfolio

            17.1.5.3. Profitability by Market Segments

            17.1.5.4. Sales Footprint

            17.1.5.5. Strategy Overview

                17.1.5.5.1. Marketing Strategy

                17.1.5.5.2. Product Strategy

                17.1.5.5.3. Channel Strategy

        17.1.6. Bemis Company, Inc.

            17.1.6.1. Overview

            17.1.6.2. Product Portfolio

            17.1.6.3. Profitability by Market Segments

            17.1.6.4. Sales Footprint

            17.1.6.5. Strategy Overview

                17.1.6.5.1. Marketing Strategy

                17.1.6.5.2. Product Strategy

                17.1.6.5.3. Channel Strategy

        17.1.7. MULTIVAC

            17.1.7.1. Overview

            17.1.7.2. Product Portfolio

            17.1.7.3. Profitability by Market Segments

            17.1.7.4. Sales Footprint

            17.1.7.5. Strategy Overview

                17.1.7.5.1. Marketing Strategy

                17.1.7.5.2. Product Strategy

                17.1.7.5.3. Channel Strategy

        17.1.8. WS Packaging Group, Inc.

            17.1.8.1. Overview

            17.1.8.2. Product Portfolio

            17.1.8.3. Profitability by Market Segments

            17.1.8.4. Sales Footprint

            17.1.8.5. Strategy Overview

                17.1.8.5.1. Marketing Strategy

                17.1.8.5.2. Product Strategy

                17.1.8.5.3. Channel Strategy

        17.1.9. Active Packaging Limited

            17.1.9.1. Overview

            17.1.9.2. Product Portfolio

            17.1.9.3. Profitability by Market Segments

            17.1.9.4. Sales Footprint

            17.1.9.5. Strategy Overview

                17.1.9.5.1. Marketing Strategy

                17.1.9.5.2. Product Strategy

                17.1.9.5.3. Channel Strategy

        17.1.10. ULMA Packaging

            17.1.10.1. Overview

            17.1.10.2. Product Portfolio

            17.1.10.3. Profitability by Market Segments

            17.1.10.4. Sales Footprint

            17.1.10.5. Strategy Overview

                17.1.10.5.1. Marketing Strategy

                17.1.10.5.2. Product Strategy

                17.1.10.5.3. Channel Strategy

        17.1.11. S.Coop

            17.1.11.1. Overview

            17.1.11.2. Product Portfolio

            17.1.11.3. Profitability by Market Segments

            17.1.11.4. Sales Footprint

            17.1.11.5. Strategy Overview

                17.1.11.5.1. Marketing Strategy

                17.1.11.5.2. Product Strategy

                17.1.11.5.3. Channel Strategy

18. Assumptions & Acronyms Used

19. Research Methodology

Don't pay for what you don't need

Customize your report by selecting specific countries or regions and save 30%!

List of Tables

Table 1: Global Market Value (US$ Million) Forecast by Region, 2018 to 2033

Table 2: Global Market Volume (Units) Forecast by Region, 2018 to 2033

Table 3: Global Market Value (US$ Million) Forecast by Packaging Type, 2018 to 2033

Table 4: Global Market Volume (Units) Forecast by Packaging Type, 2018 to 2033

Table 5: Global Market Value (US$ Million) Forecast by Application, 2018 to 2033

Table 6: Global Market Volume (Units) Forecast by Application, 2018 to 2033

Table 7: North America Market Value (US$ Million) Forecast by Country, 2018 to 2033

Table 8: North America Market Volume (Units) Forecast by Country, 2018 to 2033

Table 9: North America Market Value (US$ Million) Forecast by Packaging Type, 2018 to 2033

Table 10: North America Market Volume (Units) Forecast by Packaging Type, 2018 to 2033

Table 11: North America Market Value (US$ Million) Forecast by Application, 2018 to 2033

Table 12: North America Market Volume (Units) Forecast by Application, 2018 to 2033

Table 13: Latin America Market Value (US$ Million) Forecast by Country, 2018 to 2033

Table 14: Latin America Market Volume (Units) Forecast by Country, 2018 to 2033

Table 15: Latin America Market Value (US$ Million) Forecast by Packaging Type, 2018 to 2033

Table 16: Latin America Market Volume (Units) Forecast by Packaging Type, 2018 to 2033

Table 17: Latin America Market Value (US$ Million) Forecast by Application, 2018 to 2033

Table 18: Latin America Market Volume (Units) Forecast by Application, 2018 to 2033

Table 19: Western Europe Market Value (US$ Million) Forecast by Country, 2018 to 2033

Table 20: Western Europe Market Volume (Units) Forecast by Country, 2018 to 2033

Table 21: Western Europe Market Value (US$ Million) Forecast by Packaging Type, 2018 to 2033

Table 22: Western Europe Market Volume (Units) Forecast by Packaging Type, 2018 to 2033

Table 23: Western Europe Market Value (US$ Million) Forecast by Application, 2018 to 2033

Table 24: Western Europe Market Volume (Units) Forecast by Application, 2018 to 2033

Table 25: Eastern Europe Market Value (US$ Million) Forecast by Country, 2018 to 2033

Table 26: Eastern Europe Market Volume (Units) Forecast by Country, 2018 to 2033

Table 27: Eastern Europe Market Value (US$ Million) Forecast by Packaging Type, 2018 to 2033

Table 28: Eastern Europe Market Volume (Units) Forecast by Packaging Type, 2018 to 2033

Table 29: Eastern Europe Market Value (US$ Million) Forecast by Application, 2018 to 2033

Table 30: Eastern Europe Market Volume (Units) Forecast by Application, 2018 to 2033

Table 31: South Asia and Pacific Market Value (US$ Million) Forecast by Country, 2018 to 2033

Table 32: South Asia and Pacific Market Volume (Units) Forecast by Country, 2018 to 2033

Table 33: South Asia and Pacific Market Value (US$ Million) Forecast by Packaging Type, 2018 to 2033

Table 34: South Asia and Pacific Market Volume (Units) Forecast by Packaging Type, 2018 to 2033

Table 35: South Asia and Pacific Market Value (US$ Million) Forecast by Application, 2018 to 2033

Table 36: South Asia and Pacific Market Volume (Units) Forecast by Application, 2018 to 2033

Table 37: East Asia Market Value (US$ Million) Forecast by Country, 2018 to 2033

Table 38: East Asia Market Volume (Units) Forecast by Country, 2018 to 2033

Table 39: East Asia Market Value (US$ Million) Forecast by Packaging Type, 2018 to 2033

Table 40: East Asia Market Volume (Units) Forecast by Packaging Type, 2018 to 2033

Table 41: East Asia Market Value (US$ Million) Forecast by Application, 2018 to 2033

Table 42: East Asia Market Volume (Units) Forecast by Application, 2018 to 2033

Table 43: Middle East and Africa Market Value (US$ Million) Forecast by Country, 2018 to 2033

Table 44: Middle East and Africa Market Volume (Units) Forecast by Country, 2018 to 2033

Table 45: Middle East and Africa Market Value (US$ Million) Forecast by Packaging Type, 2018 to 2033

Table 46: Middle East and Africa Market Volume (Units) Forecast by Packaging Type, 2018 to 2033

Table 47: Middle East and Africa Market Value (US$ Million) Forecast by Application, 2018 to 2033

Table 48: Middle East and Africa Market Volume (Units) Forecast by Application, 2018 to 2033
Ismail Sutaria
Ismail Sutaria

Principal Consultant

Talk to Analyst

Find your sweet spots for generating winning opportunities in this market.

List of Charts

Figure 1: Global Market Value (US$ Million) by Packaging Type, 2023 to 2033

Figure 2: Global Market Value (US$ Million) by Application, 2023 to 2033

Figure 3: Global Market Value (US$ Million) by Region, 2023 to 2033

Figure 4: Global Market Value (US$ Million) Analysis by Region, 2018 to 2033

Figure 5: Global Market Volume (Units) Analysis by Region, 2018 to 2033

Figure 6: Global Market Value Share (%) and BPS Analysis by Region, 2023 to 2033

Figure 7: Global Market Y-o-Y Growth (%) Projections by Region, 2023 to 2033

Figure 8: Global Market Value (US$ Million) Analysis by Packaging Type, 2018 to 2033

Figure 9: Global Market Volume (Units) Analysis by Packaging Type, 2018 to 2033

Figure 10: Global Market Value Share (%) and BPS Analysis by Packaging Type, 2023 to 2033

Figure 11: Global Market Y-o-Y Growth (%) Projections by Packaging Type, 2023 to 2033

Figure 12: Global Market Value (US$ Million) Analysis by Application, 2018 to 2033

Figure 13: Global Market Volume (Units) Analysis by Application, 2018 to 2033

Figure 14: Global Market Value Share (%) and BPS Analysis by Application, 2023 to 2033

Figure 15: Global Market Y-o-Y Growth (%) Projections by Application, 2023 to 2033

Figure 16: Global Market Attractiveness by Packaging Type, 2023 to 2033

Figure 17: Global Market Attractiveness by Application, 2023 to 2033

Figure 18: Global Market Attractiveness by Region, 2023 to 2033

Figure 19: North America Market Value (US$ Million) by Packaging Type, 2023 to 2033

Figure 20: North America Market Value (US$ Million) by Application, 2023 to 2033

Figure 21: North America Market Value (US$ Million) by Country, 2023 to 2033

Figure 22: North America Market Value (US$ Million) Analysis by Country, 2018 to 2033

Figure 23: North America Market Volume (Units) Analysis by Country, 2018 to 2033

Figure 24: North America Market Value Share (%) and BPS Analysis by Country, 2023 to 2033

Figure 25: North America Market Y-o-Y Growth (%) Projections by Country, 2023 to 2033

Figure 26: North America Market Value (US$ Million) Analysis by Packaging Type, 2018 to 2033

Figure 27: North America Market Volume (Units) Analysis by Packaging Type, 2018 to 2033

Figure 28: North America Market Value Share (%) and BPS Analysis by Packaging Type, 2023 to 2033

Figure 29: North America Market Y-o-Y Growth (%) Projections by Packaging Type, 2023 to 2033

Figure 30: North America Market Value (US$ Million) Analysis by Application, 2018 to 2033

Figure 31: North America Market Volume (Units) Analysis by Application, 2018 to 2033

Figure 32: North America Market Value Share (%) and BPS Analysis by Application, 2023 to 2033

Figure 33: North America Market Y-o-Y Growth (%) Projections by Application, 2023 to 2033

Figure 34: North America Market Attractiveness by Packaging Type, 2023 to 2033

Figure 35: North America Market Attractiveness by Application, 2023 to 2033

Figure 36: North America Market Attractiveness by Country, 2023 to 2033

Figure 37: Latin America Market Value (US$ Million) by Packaging Type, 2023 to 2033

Figure 38: Latin America Market Value (US$ Million) by Application, 2023 to 2033

Figure 39: Latin America Market Value (US$ Million) by Country, 2023 to 2033

Figure 40: Latin America Market Value (US$ Million) Analysis by Country, 2018 to 2033

Figure 41: Latin America Market Volume (Units) Analysis by Country, 2018 to 2033

Figure 42: Latin America Market Value Share (%) and BPS Analysis by Country, 2023 to 2033

Figure 43: Latin America Market Y-o-Y Growth (%) Projections by Country, 2023 to 2033

Figure 44: Latin America Market Value (US$ Million) Analysis by Packaging Type, 2018 to 2033

Figure 45: Latin America Market Volume (Units) Analysis by Packaging Type, 2018 to 2033

Figure 46: Latin America Market Value Share (%) and BPS Analysis by Packaging Type, 2023 to 2033

Figure 47: Latin America Market Y-o-Y Growth (%) Projections by Packaging Type, 2023 to 2033

Figure 48: Latin America Market Value (US$ Million) Analysis by Application, 2018 to 2033

Figure 49: Latin America Market Volume (Units) Analysis by Application, 2018 to 2033

Figure 50: Latin America Market Value Share (%) and BPS Analysis by Application, 2023 to 2033

Figure 51: Latin America Market Y-o-Y Growth (%) Projections by Application, 2023 to 2033

Figure 52: Latin America Market Attractiveness by Packaging Type, 2023 to 2033

Figure 53: Latin America Market Attractiveness by Application, 2023 to 2033

Figure 54: Latin America Market Attractiveness by Country, 2023 to 2033

Figure 55: Western Europe Market Value (US$ Million) by Packaging Type, 2023 to 2033

Figure 56: Western Europe Market Value (US$ Million) by Application, 2023 to 2033

Figure 57: Western Europe Market Value (US$ Million) by Country, 2023 to 2033

Figure 58: Western Europe Market Value (US$ Million) Analysis by Country, 2018 to 2033

Figure 59: Western Europe Market Volume (Units) Analysis by Country, 2018 to 2033

Figure 60: Western Europe Market Value Share (%) and BPS Analysis by Country, 2023 to 2033

Figure 61: Western Europe Market Y-o-Y Growth (%) Projections by Country, 2023 to 2033

Figure 62: Western Europe Market Value (US$ Million) Analysis by Packaging Type, 2018 to 2033

Figure 63: Western Europe Market Volume (Units) Analysis by Packaging Type, 2018 to 2033

Figure 64: Western Europe Market Value Share (%) and BPS Analysis by Packaging Type, 2023 to 2033

Figure 65: Western Europe Market Y-o-Y Growth (%) Projections by Packaging Type, 2023 to 2033

Figure 66: Western Europe Market Value (US$ Million) Analysis by Application, 2018 to 2033

Figure 67: Western Europe Market Volume (Units) Analysis by Application, 2018 to 2033

Figure 68: Western Europe Market Value Share (%) and BPS Analysis by Application, 2023 to 2033

Figure 69: Western Europe Market Y-o-Y Growth (%) Projections by Application, 2023 to 2033

Figure 70: Western Europe Market Attractiveness by Packaging Type, 2023 to 2033

Figure 71: Western Europe Market Attractiveness by Application, 2023 to 2033

Figure 72: Western Europe Market Attractiveness by Country, 2023 to 2033

Figure 73: Eastern Europe Market Value (US$ Million) by Packaging Type, 2023 to 2033

Figure 74: Eastern Europe Market Value (US$ Million) by Application, 2023 to 2033

Figure 75: Eastern Europe Market Value (US$ Million) by Country, 2023 to 2033

Figure 76: Eastern Europe Market Value (US$ Million) Analysis by Country, 2018 to 2033

Figure 77: Eastern Europe Market Volume (Units) Analysis by Country, 2018 to 2033

Figure 78: Eastern Europe Market Value Share (%) and BPS Analysis by Country, 2023 to 2033

Figure 79: Eastern Europe Market Y-o-Y Growth (%) Projections by Country, 2023 to 2033

Figure 80: Eastern Europe Market Value (US$ Million) Analysis by Packaging Type, 2018 to 2033

Figure 81: Eastern Europe Market Volume (Units) Analysis by Packaging Type, 2018 to 2033

Figure 82: Eastern Europe Market Value Share (%) and BPS Analysis by Packaging Type, 2023 to 2033

Figure 83: Eastern Europe Market Y-o-Y Growth (%) Projections by Packaging Type, 2023 to 2033

Figure 84: Eastern Europe Market Value (US$ Million) Analysis by Application, 2018 to 2033

Figure 85: Eastern Europe Market Volume (Units) Analysis by Application, 2018 to 2033

Figure 86: Eastern Europe Market Value Share (%) and BPS Analysis by Application, 2023 to 2033

Figure 87: Eastern Europe Market Y-o-Y Growth (%) Projections by Application, 2023 to 2033

Figure 88: Eastern Europe Market Attractiveness by Packaging Type, 2023 to 2033

Figure 89: Eastern Europe Market Attractiveness by Application, 2023 to 2033

Figure 90: Eastern Europe Market Attractiveness by Country, 2023 to 2033

Figure 91: South Asia and Pacific Market Value (US$ Million) by Packaging Type, 2023 to 2033

Figure 92: South Asia and Pacific Market Value (US$ Million) by Application, 2023 to 2033

Figure 93: South Asia and Pacific Market Value (US$ Million) by Country, 2023 to 2033

Figure 94: South Asia and Pacific Market Value (US$ Million) Analysis by Country, 2018 to 2033

Figure 95: South Asia and Pacific Market Volume (Units) Analysis by Country, 2018 to 2033

Figure 96: South Asia and Pacific Market Value Share (%) and BPS Analysis by Country, 2023 to 2033

Figure 97: South Asia and Pacific Market Y-o-Y Growth (%) Projections by Country, 2023 to 2033

Figure 98: South Asia and Pacific Market Value (US$ Million) Analysis by Packaging Type, 2018 to 2033

Figure 99: South Asia and Pacific Market Volume (Units) Analysis by Packaging Type, 2018 to 2033

Figure 100: South Asia and Pacific Market Value Share (%) and BPS Analysis by Packaging Type, 2023 to 2033

Figure 101: South Asia and Pacific Market Y-o-Y Growth (%) Projections by Packaging Type, 2023 to 2033

Figure 102: South Asia and Pacific Market Value (US$ Million) Analysis by Application, 2018 to 2033

Figure 103: South Asia and Pacific Market Volume (Units) Analysis by Application, 2018 to 2033

Figure 104: South Asia and Pacific Market Value Share (%) and BPS Analysis by Application, 2023 to 2033

Figure 105: South Asia and Pacific Market Y-o-Y Growth (%) Projections by Application, 2023 to 2033

Figure 106: South Asia and Pacific Market Attractiveness by Packaging Type, 2023 to 2033

Figure 107: South Asia and Pacific Market Attractiveness by Application, 2023 to 2033

Figure 108: South Asia and Pacific Market Attractiveness by Country, 2023 to 2033

Figure 109: East Asia Market Value (US$ Million) by Packaging Type, 2023 to 2033

Figure 110: East Asia Market Value (US$ Million) by Application, 2023 to 2033

Figure 111: East Asia Market Value (US$ Million) by Country, 2023 to 2033

Figure 112: East Asia Market Value (US$ Million) Analysis by Country, 2018 to 2033

Figure 113: East Asia Market Volume (Units) Analysis by Country, 2018 to 2033

Figure 114: East Asia Market Value Share (%) and BPS Analysis by Country, 2023 to 2033

Figure 115: East Asia Market Y-o-Y Growth (%) Projections by Country, 2023 to 2033

Figure 116: East Asia Market Value (US$ Million) Analysis by Packaging Type, 2018 to 2033

Figure 117: East Asia Market Volume (Units) Analysis by Packaging Type, 2018 to 2033

Figure 118: East Asia Market Value Share (%) and BPS Analysis by Packaging Type, 2023 to 2033

Figure 119: East Asia Market Y-o-Y Growth (%) Projections by Packaging Type, 2023 to 2033

Figure 120: East Asia Market Value (US$ Million) Analysis by Application, 2018 to 2033

Figure 121: East Asia Market Volume (Units) Analysis by Application, 2018 to 2033

Figure 122: East Asia Market Value Share (%) and BPS Analysis by Application, 2023 to 2033

Figure 123: East Asia Market Y-o-Y Growth (%) Projections by Application, 2023 to 2033

Figure 124: East Asia Market Attractiveness by Packaging Type, 2023 to 2033

Figure 125: East Asia Market Attractiveness by Application, 2023 to 2033

Figure 126: East Asia Market Attractiveness by Country, 2023 to 2033

Figure 127: Middle East and Africa Market Value (US$ Million) by Packaging Type, 2023 to 2033

Figure 128: Middle East and Africa Market Value (US$ Million) by Application, 2023 to 2033

Figure 129: Middle East and Africa Market Value (US$ Million) by Country, 2023 to 2033

Figure 130: Middle East and Africa Market Value (US$ Million) Analysis by Country, 2018 to 2033

Figure 131: Middle East and Africa Market Volume (Units) Analysis by Country, 2018 to 2033

Figure 132: Middle East and Africa Market Value Share (%) and BPS Analysis by Country, 2023 to 2033

Figure 133: Middle East and Africa Market Y-o-Y Growth (%) Projections by Country, 2023 to 2033

Figure 134: Middle East and Africa Market Value (US$ Million) Analysis by Packaging Type, 2018 to 2033

Figure 135: Middle East and Africa Market Volume (Units) Analysis by Packaging Type, 2018 to 2033

Figure 136: Middle East and Africa Market Value Share (%) and BPS Analysis by Packaging Type, 2023 to 2033

Figure 137: Middle East and Africa Market Y-o-Y Growth (%) Projections by Packaging Type, 2023 to 2033

Figure 138: Middle East and Africa Market Value (US$ Million) Analysis by Application, 2018 to 2033

Figure 139: Middle East and Africa Market Volume (Units) Analysis by Application, 2018 to 2033

Figure 140: Middle East and Africa Market Value Share (%) and BPS Analysis by Application, 2023 to 2033

Figure 141: Middle East and Africa Market Y-o-Y Growth (%) Projections by Application, 2023 to 2033

Figure 142: Middle East and Africa Market Attractiveness by Packaging Type, 2023 to 2033

Figure 143: Middle East and Africa Market Attractiveness by Application, 2023 to 2033

Figure 144: Middle East and Africa Market Attractiveness by Country, 2023 to 2033

Recommendations

Packaging

Active, Smart, and Intelligent Packaging Market

Published : March 2024

Packaging

Temperature Controlled Packaging Solution Market

Published : October 2023

Packaging

Intelligent Packaging Market

Published : February 2023

Packaging

Time Temperature Indicator Labels Market

Published : January 2023

Explore Packaging Insights

View Reports

Next Generation Packaging Market