Next-Generation Sweeteners Size and Share Forecast Outlook 2025 to 2035

The Next-Generation Sweeteners Market is projected to be valued at USD 435.6 million in 2025 and is forecast to reach USD 800.2 million by 2035. This represents an absolute increase of USD 364.6 million over the decade, equating to a compound annual growth rate (CAGR) of 6.3%. A nearly 2X expansion in market size is expected to be achieved, driven by escalating global demand for metabolically safe, clean-label, and low-calorie sugar alternatives.
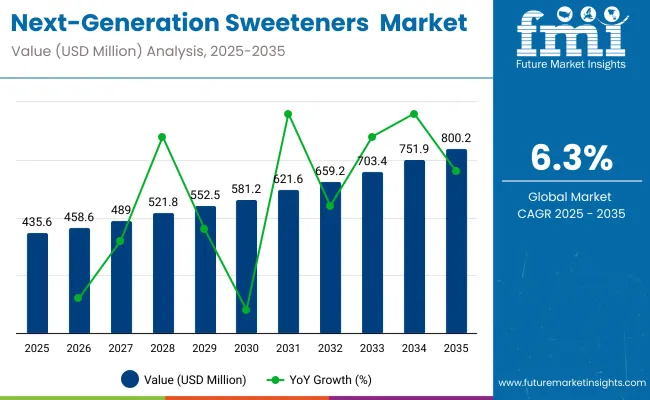
Quick Stats for Next-Generation Sweeteners

  • Next-Generation Sweeteners Value (2025): USD 435.6 million
  • Next-Generation Sweeteners Forecast Value (2035): USD 800.2 million
  • Next-Generation Sweeteners Forecast CAGR: 6.3%
  • Leading Segment in Next-Generation Sweeteners in 2025, by Sweetener Type: Peptide‑based sweeteners (18%)
  • Key Growth Regions in the Next-Generation Sweeteners: North America, Asia-Pacific, Europe
  • Top Key Players in Next-Generation Sweeteners: Ajinomoto Co., Inc., Sweegen Inc., Conagen Inc., Roquette (via BRAIN AG JV), Avansya (Cargill + DSM JV), Bonumose Inc., Bestzyme Biotech, Samyang Corporation, Oobli (formerly Joywell), and Manus Bio

Next Generation Sweeteners Market 1

Metric Value
Next-Generation Sweeteners Estimated Value in (2025E) USD 435.6 million
Next-Generation Sweeteners Forecast Value in (2035F) USD 800.2 million
Forecast CAGR (2025 to 2035) 6.3%

During the first half of the forecast period (2025 to 2030), the market is expected to grow from USD 435.6 million to approximately USD 591.4 million, accounting for USD 155.8 million in incremental value or nearly 43% of total decade growth.

This initial phase is likely to be shaped by increasing R&D activity, regulatory approvals, and early-stage partnerships across food and beverage manufacturers. Use cases in functional beverages, wellness nutrition, and oral care are anticipated to dominate early adoption curves.

The latter half (2030 to 2035) is forecast to deliver accelerated gains, contributing USD 208.8 million or 57% of the decade’s total expansion-as the market moves from USD 591.4 million to USD 800.2 million. Broader adoption across emerging regions, combined with integration into precision health platforms, is expected to amplify demand. Software-enabled formulation tools and microbiome-neutral innovation are likely to expand competitive differentiation. As personalization in food systems gains prominence, next-generation sweeteners are expected to serve as foundational ingredients in adaptive nutrition ecosystems.

From 2020 to 2024, the Next-Generation Sweeteners Market expanded steadily from~ USD 420.6 million to USD 435.6 million, driven by rising demand for clean-label, zero-calorie, and metabolically safe sugar alternatives. During this phase, plant-derived sweeteners dominated revenue share, while fermentation-derived innovations gained traction through targeted R&D investments.

By 2025, demand is forecast to rise sharply, with peptide-based compounds and mogroside variants leading adoption in functional beverages and diabetic nutrition. Fermentation platforms and synthetic biology tools are being prioritized for scalability and cost-efficiency. Between 2025 and 2035, a noticeable shift is expected in the revenue mix toward AI-optimized formulation platforms, regulatory-compliant ingredient systems, and subscription-based ingredient sourcing partnerships.

Traditional sweetener manufacturers are projected to pivot toward hybrid models that integrate biofunctionality, personalized nutrition, and clean-label alignment. Competitive advantage is forecast to shift from sweetness intensity to sensory precision, clinical validation, and ecosystem partnerships that enable scalable innovation. Emerging players focusing on gut-health compatibility, formulation software, and cloud-based R&D are expected to redefine category leadership.

Why the Next-Generation Sweeteners is growing?

The growth of the Next-Generation Sweeteners Market is being driven by a confluence of nutritional, regulatory, and technological shifts. Heightened scrutiny of caloric intake and glycemic impact has been observed across health-conscious consumer groups, leading to increased demand for metabolically neutral sweeteners.

Regulatory bodies have progressively endorsed newer sweetener compounds, thereby accelerating formulation adoption across food, beverage, and nutraceutical categories. Functional advantages such as heat stability, taste-masking ability, and microbiome-friendliness are being prioritized by manufacturers seeking to replace legacy sugar substitutes.

Market expansion is also being catalyzed by fermentation-derived and peptide-based innovations, which have allowed for scalable, cost-effective production of rare sweetener proteins. Widespread application across lifestyle-driven product categories such as clean-label beverages, ketogenic foods, and diabetic-friendly formulations has been enabled by improved solubility and organoleptic performance. As industry reformulations align with wellness and personalization trends, next-generation sweeteners are expected to be positioned as critical enablers of long-term nutritional transition.

Segmental Analysis

The Next-Generation Sweeteners Market has been segmented based on sweetener type, source, application, and formulation format. This segmentation framework has enabled a detailed analysis of commercial performance and innovation momentum across the industry.

By sweetener type, the market includes proteins, glycosides, and rare fruit extracts, each offering distinct functional benefits and adoption curves. In terms of source, products are classified into plant-derived, microbial/fermentation-derived, and synthetic-each category carrying unique scalability and regulatory attributes.

Application-wise, use spans beverages, confectionery, supplements, and pharmaceuticals, reflecting diversified end-user integration. These segments are being shaped by health-driven consumption patterns, regional dietary shifts, and food reformulation mandates. Forward-looking strategies are expected to emphasize biotech innovation, regulatory clearance, and cross-category formulation partnerships to expand segment share over the coming decade.
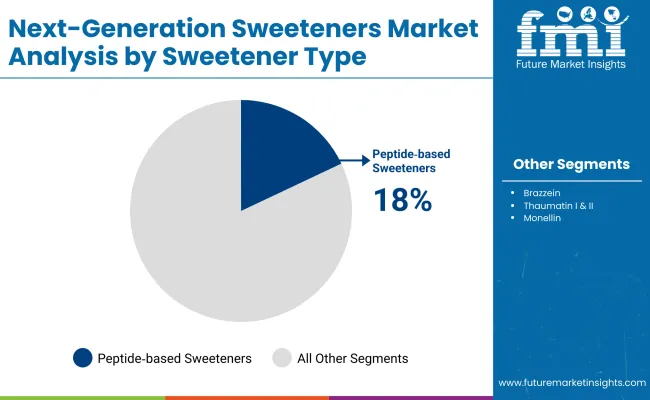
Insights into the Sweetener Segment with Peptide based sweeteners Leading in Market Share

Next Generation Sweeteners Market Analysis By Sweetner Type

Protein Source Segment Market Value Share, 2025
Peptide based sweeteners 18.0%
Mogroside V 12.0%

Peptide-based sweeteners are projected to account for the largest share of the market in 2025, contributing 18.0% to total revenue. Their dominance is being attributed to their superior sweetness intensity, heat stability, and clean taste profile, which have made them highly suitable for both food and pharmaceutical applications.

Market growth is being propelled by biotechnological advancements enabling cost-efficient synthesis and large-scale fermentation. Peptide-based solutions are being positioned as the next frontier in zero-calorie sweetening due to their minimal glycemic impact and favorable regulatory profile.

As consumer demand for plant-based, protein-rich, and metabolically safe ingredients continues to rise, the peptide segment is expected to outperform legacy sugar alternatives. Its integration into functional beverages, diet foods, and diabetic formulations will likely secure sustained growth across high-potential regions.
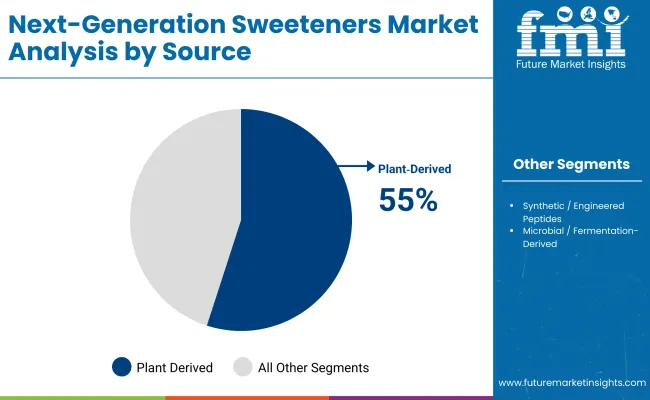
Insights into the Source Segment with Plant-Derived Dominating the Demand

Next Generation Sweeteners Market Analysis By Source

Plant-Derived 2025 Share%
Plant Derived 55%
Microbial / Fermentation Derived 35%
Synthetic 10%

Plant-derived sweeteners are expected to retain the largest share of the global market in 2025, contributing 55.0% of total value. This dominance has been supported by long-standing consumer trust in botanically sourced ingredients, coupled with strong regulatory backing for traditional and naturally occurring sweeteners. Widely recognized extracts such as steviol glycosides, mogroside V, and licorice root derivatives have been adopted across beverages, baked goods, and dietary supplements due to their clean-label positioning and natural origin.

Market demand has been reinforced by rising health consciousness and clean-label product preferences across both developed and emerging regions. As sugar taxes and front-of-pack labeling rules become stricter, food and beverage manufacturers have prioritized plant-derived sweeteners that deliver sweetness without caloric penalties.
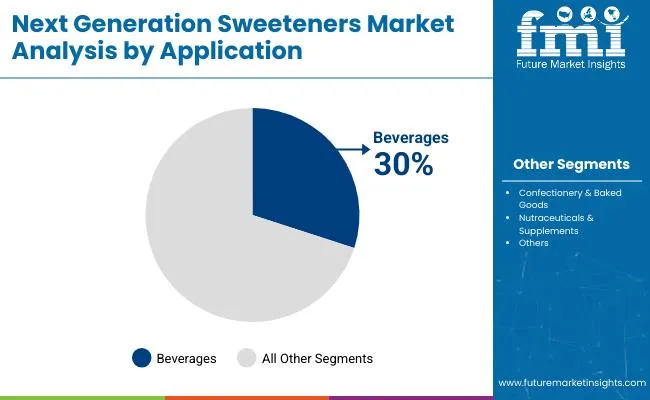
Insights into the Application Segment with Focus on Beverages

Next Generation Sweeteners Market Analysis By Application

Application 2025 Share%
Beverages 30%
Confectionery & Baked Goods 20%
Nutraceuticals & Supplements 15%

Beverages are expected to remain the dominant application for next-generation sweeteners, accounting for 30.0% of market revenue in 2025. This leadership is being supported by widespread reformulation efforts in the soft drink, flavored water, and functional beverage sectors. Brands are adopting low- and zero-calorie sweeteners to align with evolving dietary preferences and regulatory sugar taxes across North America, Europe, and Asia.

Sweeteners like brazzein and mogroside V are increasingly being integrated due to their compatibility with carbonated and acidic formulations. The segment's growth is further fueled by demand for plant-based and wellness-positioned drinks, which require natural yet scalable sweetening options. As beverage manufacturers pursue clean-label innovation and consumer-centric branding, next-generation sweeteners are expected to remain a central component of R&D pipelines and commercial strategies.

What are the Drivers, Restraints, and Key Trends of the Next-Generation Sweeteners?

Rising formulation complexity and regional labeling mandates are reshaping the adoption curve for next-generation sweeteners, even as industry demand intensifies across functional nutrition, wellness beverages, and precision diet systems.

Rise of AI-Optimized Formulations for Sensory Precision

Artificial intelligence and computational taste modeling are being used to accelerate sweetener formulation across R&D pipelines. These tools are enabling data-driven optimization of sweetness curves, flavor-masking capabilities, and ingredient synergies, thereby reducing trial-and-error cycles in new product development.

Companies are leveraging sensory prediction models to develop region-specific taste profiles while minimizing off-notes. This shift toward AI-assisted formulation is expected to support scale-up of personalized, microtargeted sweetener applications aligned with digital nutrition platforms and personalized health trends.

Regulatory Alignment with Sugar Reduction Goals

Regulatory frameworks prioritizing sugar reduction and non-nutritive sweetener inclusion are being implemented across North America, Europe, and parts of Asia, accelerating market demand. As public health agencies endorse alternative sweeteners to mitigate obesity, diabetes, and cardiovascular risks, next-generation compounds are being incorporated into approved food codes and GRAS lists.

This alignment is enabling faster commercialization of fermentation- and peptide-derived sweeteners with high-intensity flavor and minimal metabolic disruption. Food manufacturers are responding with reformulations across beverages and functional foods. As sugar taxes expand and clean-label compliance intensifies, next-generation sweeteners are expected to gain preferred status among product developers and formulators.
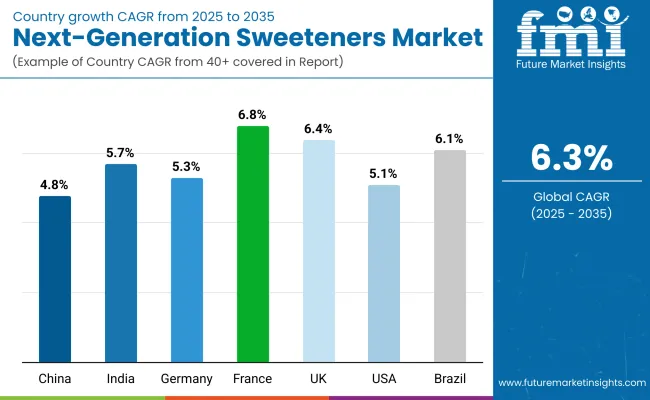
Analysis of Next-Generation Sweeteners by Key Countries

Country Wise Analysis Of Next Generation Sweeteners Market

Countries CAGR (2025 to 2035)
China 4.8%
India 5.7%
Germany 5.3%
France 6.8%
UK 6.4%
USA 5.1%
Brazil 6.1%

The global Next-Generation Sweeteners Market is expected to display pronounced variation in growth across countries, shaped by dietary health initiatives, innovation readiness, and evolving food regulatory landscapes.

Asia-Pacific is projected to lead the adoption curve, with India expanding at a CAGR of 5.7% and China at 4.8%, driven by public health campaigns focused on reducing sugar consumption and rising demand for clean-label, diabetic-friendly formulations. In India, government-backed nutrition programs and rapid expansion of nutraceuticals are expected to fuel market penetration, especially in urban and tier-II dietary transitions. In China, advancements in biotechnology and strong investment in local production of rare sugar proteins are reinforcing domestic innovation.

In Europe, growth is anticipated to remain robust, led by France (6.8% CAGR), the UK (6.4%), and Germany (5.3%), supported by harmonized food safety regulations, sugar tax policies, and strategic collaborations between food-tech firms and ingredient suppliers. France is witnessing heightened R&D activity around microbiome-friendly sweeteners, while the UK market is being shaped by retailer-led sugar reformulation mandates.

North America, anchored by the USA at a 5.1% CAGR, is experiencing steady growth, with demand increasingly centered on fermentation-derived compounds, wellness-positioned beverages, and personalized nutrition formats. Meanwhile, Brazil (6.1% CAGR) is emerging as a high-potential market, driven by regulatory modernization and the uptake of sweeteners in functional dairy and confectionery exports.

Sales Outlook for Next-Generation Sweeteners in the United States

Year USA Next-Generation Sweeteners Market (USD Million)
2025 104.5
2026 110.7
2027 117.2
2028 124.4
2029 132.0
2030 139.4
2031 149.1
2032 159.4
2033 168.6
2034 178.1
2035 187.4

The Next-Generation Sweeteners Market in the United States is projected to expand at a CAGR of 5.9% between 2025 and 2035, underpinned by escalating demand for low-glycemic, clean-label alternatives in packaged food, wellness beverages, and personalized nutrition.

Significant adoption has been observed in diabetic-friendly and ketogenic formulations, particularly within functional beverage and snack categories. Regulatory alignment on sugar reduction, coupled with consumer backlash against artificial sweeteners, has created strong tailwinds for natural and fermentation-derived compounds.

Health-conscious purchasing behavior is being amplified by retailer reformulation mandates and FDA labeling regulations, prompting CPG brands to accelerate sweetener innovation pipelines. Moreover, academic and clinical research institutions are contributing to market growth through studies validating the safety and metabolic neutrality of peptide-based sweeteners.

  • Functional beverages and diabetic nutrition are driving volume across retail and DTC channels.
  • Fermentation-derived sweeteners are being prioritized in clean-label product innovation.
  • Retailer-driven sugar reformulation mandates are accelerating market penetration.
  • Clinical validation is reinforcing consumer trust in next-generation sweetener profiles.

Growth and Expansion Outlook for Next-Generation Sweeteners in the United Kingdom

The UK Next-Generation Sweeteners Market is expected to expand at a CAGR of 6.4%, supported by government-mandated sugar reduction strategies and increased consumer scrutiny over ingredient labels. Clean-label positioning is being prioritized across beverage and bakery categories, where natural and peptide-based sweeteners are being actively integrated into reformulated SKUs.

Regulatory frameworks under Public Health England’s sugar reformulation program have contributed to the growing traction of zero-calorie sweeteners. Retailers are increasingly demanding evidence-backed sweetness enhancers that align with HFSS compliance standards and ESG commitments.

  • HFSS regulations are driving reformulation across beverage and snack portfolios.
  • Peptide-based sweeteners are being adopted for flavor integrity and calorie neutrality.
  • Retail-led clean-label mandates are accelerating sweetener substitution.
  • The UK is emerging as a testbed for microbiome-safe sweeteners in functional foods.

Growth and Expansion Outlook for Next-Generation Sweeteners in India

India’s market is projected to grow at a CAGR of 5.7%, driven by surging demand for diabetic-safe and Ayurveda-compatible sugar substitutes. Urban dietary shifts, increasing obesity prevalence, and FSSAI-backed clean-label initiatives have accelerated interest in plant-derived sweeteners such as steviol glycosides and monk fruit blends.

Growth is also being reinforced by domestic manufacturing incentives that aim to reduce reliance on imported artificial sweeteners. Nutraceuticals and dietary supplement brands are actively promoting low-glycemic ingredients, which has supported broader market penetration.

  • FSSAI’s clean-label guidelines are catalyzing reformulation in packaged foods.
  • Monk fruit and plant-based blends are gaining traction in urban India.
  • Nutraceutical and ayurvedic sectors are integrating zero-calorie sweeteners.
  • Local production of functional sweeteners is being encouraged under Make-in-India.

Sales Outlook for Next-Generation Sweeteners in China

China’s market is forecast to expand at a CAGR of 4.8%, supported by ongoing efforts to combat rising sugar consumption and metabolic health issues. Government-led nutrition programs have endorsed natural and low-calorie sweeteners in school meals, beverages, and mass-market processed foods.

Local biomanufacturing capacity is being scaled to produce fermentation-derived sweeteners such as brazzein and mogroside V, which are favored for their flavor precision and formulation compatibility. Public-private partnerships are increasingly focusing on R&D into sensory optimization and safety testing.

  • Brazzein and mogroside V are being domestically scaled via fermentation.
  • Government programs are promoting healthy sweeteners in institutional catering.
  • China’s biotech infrastructure is advancing next-gen sweetener production.
  • Regulatory scrutiny is enhancing adoption of clinically validated compounds.

In-depth Analysis of Next-Generation Sweeteners in Germany

Countries 2025
UK 20.7%
Germany 20.9%
Italy 11.7%
France 14.1%
Spain 11.6%
BENELUX 6.5%
Nordic 5.6%
Rest of Europe 8.9%
Countries 2035
UK 19.3%
Germany 20.9%
Italy 11.7%
France 12.5%
Spain 9.4%
BENELUX 5.2%
Nordic 5.1%
Rest of Europe 16.0%

Germany’s market is projected to grow at a CAGR of 5.3%, fueled by food safety regulations, consumer preference for natural ingredients, and reformulation strategies by major food producers. Demand for organic, EU-compliant sweeteners has supported growth in the plant- and fermentation-derived segments.

Key manufacturers are introducing sugar-reduced SKUs in yogurt, cereal, and non-alcoholic beverages, backed by EU health claims. Strong R&D infrastructure and cross-border partnerships have allowed for rapid commercialization of peptide-based and licorice-derived sweeteners with EFSA-approved profiles.

  • Organic and natural sweeteners are being prioritized for EU health compliance.
  • Yogurt and cereal categories are driving sugar-reduction innovation.
  • EFSA validation is reinforcing confidence in next-gen sweetener safety.
  • Multinational partnerships are accelerating peptide sweetener commercialization.

Growth Outlook for Next-Generation Sweeteners in Japan

Sweetener Type Market Value Share, 2025
Brazzein 12.0%
Thaumatin I & II 9.0%
Monellin 8.0%
Curculin 6.0%
Pentadin 5.0%
Peptide based sweeteners 15.0%
Mogroside V 14.0%
Siraitiflavone based derivatives 8.0%
Licorice root glycyrrhizin derivatives 7.0%
Sweet Chrysanthemum glycosides 5.0%
Oubli fruit extract 4.0%
Others 7.0%

The Next-Generation Sweeteners Market in Japan is projected to be valued at USD 68.61 million in 2025, with peptide-based sweeteners leading the segment at 15%, followed closely by Mogroside V (14%) and Brazzein (12%).

This leadership reflects Japan’s emphasis on precision nutrition, clean-label transparency, and zero-calorie innovations within functional food categories. Peptide-based compounds have gained traction due to their ability to mimic natural sweetness without altering metabolic responses critical for Japan’s aging population and diabetes-prevention policies.

Consumer preference for subtle sweetness and traditional flavor harmony has driven interest in Mogroside V and Brazzein, both of which blend well with Japanese tea-based and fermented beverages. Moreover, local R&D efforts have prioritized the development of fermentation-derived sweeteners to enhance scalability and sustainability.

The adoption outlook is expected to be shaped by increasing demand for gut-friendly sweeteners, high heat stability for baked goods, and clean sensory profiles suited to umami-rich culinary applications.

  • Peptide-based sweeteners lead with 15% share, signaling high trust in bioengineered proteins.
  • Mogroside V and Brazzein are favored for compatibility with traditional flavor systems.
  • Growth supported by aging demographics, diabetes prevention, and local biotech innovation.

Opportunity Analysis of South Korea Next-Generation Sweeteners

Source Market Value Share, 2025
Plant Derived 54.0%
Microbial / Fermentation Derived 36.0%
Synthetic 10.0%

The Next-Generation Sweeteners Market in South Korea is projected to reach USD 39.2 million in 2025, with plant-derived sweeteners accounting for the largest share at 54%, followed by fermentation-derived at 36%, and synthetic variants contributing the remaining 10%. This distribution reflects South Korea’s long-standing preference for natural health ingredients, supported by strong public trust in botanically sourced functional foods.

However, growth within the fermentation-derived segment projected to expand at the highest CAGR of 9.4% is expected to outpace others due to the nation’s biotech-forward food industry. Next-gen solutions such as brazzein, thaumatin, and precision-fermented proteins are being increasingly adopted in wellness beverages, diabetic nutrition, and low-calorie snacks.

South Korean food tech companies are actively investing in scalable bioprocesses that support ingredient transparency and sustainability two pillars central to consumer loyalty. Regulatory frameworks that prioritize food safety and digital traceability have further supported the commercial launch of next-generation alternatives across domestic and export-focused product lines.
  • Plant-derived sweeteners lead at 54%, driven by strong consumer preference for naturals.
  • Fermentation-derived segment growing fastest, supported by biotech innovation.
  • Regulatory focus on clean labeling and functional health is driving premiumization.

Competitive Landscape of Next-Generation Sweeteners

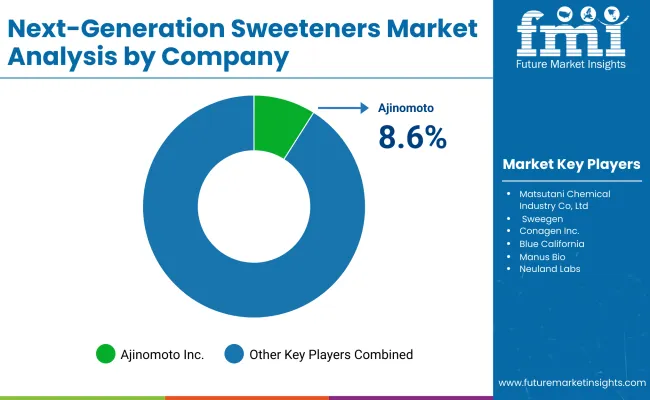
Next Generation Sweeteners Market Analysis By Company

The Next-Generation Sweeteners Market is moderately fragmented, with global conglomerates, biotech-driven innovators, and formulation-focused specialists competing across nutritional, pharmaceutical, and food-tech domains. Leading players such as Ajinomoto Co., Inc., Roquette (via BRAIN AG JV), and Samyang Corporation have been observed to command significant influence through proprietary ingredient platforms, established distribution, and long-standing regulatory alignment. Their strategies are increasingly centered on scalable peptide production, global regulatory access, and integration with metabolic wellness trends.

Mid-sized innovators like Sweegen Inc., Conagen Inc., and Bonumose Inc. are reshaping competition through bioprocess optimization, synthetic biology, and fermentation-based sweetener development. Their technologies are being positioned to offer high-intensity sweetness with minimal off-notes, microbiome neutrality, and high thermal stability-qualities sought by CPG brands undergoing rapid reformulation.

Specialist ventures such as Oobli (formerly Joywell), Avansya (Cargill + DSM JV), Bestzyme Biotech, and Manus Bio are focusing on rare protein sweeteners, AI-guided molecular design, and sugar reduction partnerships with functional food brands. These firms are gaining traction through agility, IP ownership, and ingredient customization.

Competitive differentiation is expected to shift toward biosynthetic scalability, clean-label compliance, and multi-application versatility-with success defined not by sweetness intensity alone but by metabolic integrity, taste precision, and formulation compatibility.

Key Developments in Next-Generation Sweeteners

  • In June 2025, Ajinomoto Co., Inc. was honored as a Digital Transformation Stock 2025, signaling its leadership in leveraging AminoScience technologies, data-driven R&D, and innovation platforms for next-generation sweetener development and sustainability advancement
  • In March 2025, Sweegen, Inc. secured a positive safety opinion from the UK Food Standards Agency for its bioconverted Rebaudioside D (Reb D), expediting its path toward commercial use in reduced-sugar markets

Scope of the Report

Item Value
Quantitative Units USD 435.6 million
Sweetener Type Brazzein, Thaumatin I & II, Monellin, Curculin, Pentadin, Peptide-based Sweeteners, Mogroside V, Siraitiflavone-based Derivatives, Licorice Root Glycyrrhizin Derivatives, Sweet Chrysanthemum Glycosides, Oubli Fruit Extract, Others
Source Plant-Derived, Microbial / Fermentation-Derived, Synthetic
Application Beverages, Confectionery & Baked Goods, Dairy & Frozen Desserts, Nutraceuticals & Supplements, Pharmaceuticals, Tabletop Sweeteners
Formulation Type Powder, Liquid, Tablets, Sachets
Regions Covered North America, Europe, Asia-Pacific, Latin America, Middle East & Africa
Country Covered United States, Canada, Germany, France, United Kingdom, China, Japan, India, Brazil, South Africa
Key Companies Profiled Ajinomoto Co., Inc., Sweegen Inc., Conagen Inc., Roquette (via BRAIN AG JV), Avansya (Cargill + DSM JV), Bonumose Inc., Bestzyme Biotech, Samyang Corporation, Oobli (formerly Joywell), Manus Bio
Additional Attributes Market size by sweetener type, application, and source; R&D investment in fermentation and synthetic biology; rising adoption in diabetic and keto nutrition; regulatory support across EU, USA, and Asia; increased use in clean-label and functional products; partnerships with CPG and beverage majors; technology transfer and licensing trends; impact of sugar taxes and front-of-pack labeling policies

Key Segmentation

By Sweetener Type:

  • Brazzein
  • Thaumatin I & II
  • Monellin
  • Curculin
  • Pentadin
  • Peptide-based Sweeteners
  • Mogroside V
  • Siraitiflavone-based Derivatives
  • Licorice Root Glycyrrhizin Derivatives
  • Sweet Chrysanthemum Glycosides
  • Oubli Fruit Extract
  • Others

By Source:

  • Plant-Derived
  • Microbial/Fermentation-Derived
  • Synthetic

By Application:

  • Beverages
  • Confectionery & Baked Goods
  • Dairy & Frozen Desserts
  • Nutraceuticals & Supplements
  • Pharmaceuticals
  • Tabletop Sweeteners

By Formulation Type:

  • Powder
  • Liquid
  • Tablets
  • Sachets

By Region:

  • North America
  • Latin America
  • Europe
  • East Asia
  • South Asia and Pacific
  • Middle East and Africa

Table of Content

  1. Executive Summary
    • Global Market Outlook
    • Demand-side Trends
    • Supply-side Trends
    • Technology Roadmap Analysis
    • Analysis and Recommendations
  2. Market Overview
    • Market Coverage / Taxonomy
    • Market Definition / Scope / Limitations
  3. Market Background
    • Market Dynamics
      • Drivers
      • Restraints
      • Opportunity
      • Trends
    • Scenario Forecast
      • Demand in Optimistic Scenario
      • Demand in Likely Scenario
      • Demand in Conservative Scenario
    • Opportunity Map Analysis
    • Product Life Cycle Analysis
    • Supply Chain Analysis
    • Investment Feasibility Matrix
    • Value Chain Analysis
    • PESTLE and Porter’s Analysis
    • Regulatory Landscape
    • Regional Parent Market Outlook
    • Production and Consumption Statistics
    • Import and Export Statistics
  4. Global Market Analysis 2020 to 2024 and Forecast, 2025 to 2035
    • Historical Market Size Value (USD Million) & Volume (MT) Analysis, 2020 to 2024
    • Current and Future Market Size Value (USD Million) & Volume (MT) Projections, 2025 to 2035
      • Y-o-Y Growth Trend Analysis
      • Absolute $ Opportunity Analysis
  5. Global Market Pricing Analysis 2020 to 2024 and Forecast 2025 to 2035
  6. Global Market Analysis 2020 to 2024 and Forecast 2025 to 2035, By Sweetener Type
    • Introduction / Key Findings
    • Historical Market Size Value (USD Million) & Volume (MT) Analysis By Sweetener Type, 2020 to 2024
    • Current and Future Market Size Value (USD Million) & Volume (MT) Analysis and Forecast By Sweetener Type, 2025 to 2035
      • Brazzein
      • Thaumatin I & II
      • Monellin
      • Curculin
      • Pentadin
      • Peptidebased sweeteners
      • Mogroside V
      • Siraitiflavonebased derivatives
      • Licorice root glycyrrhizin derivatives
      • Sweet Chrysanthemum glycosides
      • Oubli fruit extract
      • Others
    • Y-o-Y Growth Trend Analysis By Sweetener Type, 2020 to 2024
    • Absolute $ Opportunity Analysis By Sweetener Type, 2025 to 2035
  7. Global Market Analysis 2020 to 2024 and Forecast 2025 to 2035, By Source
    • Introduction / Key Findings
    • Historical Market Size Value (USD Million) & Volume (MT) Analysis By Source, 2020 to 2024
    • Current and Future Market Size Value (USD Million) & Volume (MT) Analysis and Forecast By Source, 2025 to 2035
      • Plant-Derived
      • Microbial/Fermentation-Derived
      • Synthetic
    • Y-o-Y Growth Trend Analysis By Source, 2020 to 2024
    • Absolute $ Opportunity Analysis By Source, 2025 to 2035
  8. Global Market Analysis 2020 to 2024 and Forecast 2025 to 2035, By Application
    • Introduction / Key Findings
    • Historical Market Size Value (USD Million) & Volume (MT) Analysis By Application, 2020 to 2024
    • Current and Future Market Size Value (USD Million) & Volume (MT) Analysis and Forecast By Application, 2025 to 2035
      • Beverages
      • Confectionery & Baked Goods
      • Dairy & Frozen Desserts
      • Nutraceuticals & Supplements
      • Pharmaceuticals
      • Tabletop Sweeteners
    • Y-o-Y Growth Trend Analysis By Application, 2020 to 2024
    • Absolute $ Opportunity Analysis By Application, 2025 to 2035
  9. Global Market Analysis 2020 to 2024 and Forecast 2025 to 2035, By Formulation Type
    • Introduction / Key Findings
    • Historical Market Size Value (USD Million) & Volume (MT) Analysis By Formulation Type, 2020 to 2024
    • Current and Future Market Size Value (USD Million) & Volume (MT) Analysis and Forecast By Formulation Type, 2025 to 2035
      • Powder
      • Liquid
      • Tablets
      • Sachets
    • Y-o-Y Growth Trend Analysis By Formulation Type, 2020 to 2024
    • Absolute $ Opportunity Analysis By Formulation Type, 2025 to 2035
  10. Global Market Analysis 2020 to 2024 and Forecast 2025 to 2035, By Region
    • Introduction
    • Historical Market Size Value (USD Million) & Volume (MT) Analysis By Region, 2020 to 2024
    • Current Market Size Value (USD Million) & Volume (MT) Analysis and Forecast By Region, 2025 to 2035
      • North America
      • Latin America
      • Europe
      • East Asia
      • South Asia and Pacific
      • Middle East and Africa
    • Market Attractiveness Analysis By Region
  11. North America Market Analysis 2020 to 2024 and Forecast 2025 to 2035, By Country
    • Historical Market Size Value (USD Million) & Volume (MT) Trend Analysis By Market Taxonomy, 2020 to 2024
    • Market Size Value (USD Million) & Volume (MT) Forecast By Market Taxonomy, 2025 to 2035
      • By Country
        • USA
        • Canada
      • By Sweetener Type
      • By Source
      • By Application
      • By Formulation Type
    • Market Attractiveness Analysis
      • By Country
      • By Sweetener Type
      • By Source
      • By Application
      • By Formulation Type
    • Key Takeaways
  12. Latin America Market Analysis 2020 to 2024 and Forecast 2025 to 2035, By Country
    • Historical Market Size Value (USD Million) & Volume (MT) Trend Analysis By Market Taxonomy, 2020 to 2024
    • Market Size Value (USD Million) & Volume (MT) Forecast By Market Taxonomy, 2025 to 2035
      • By Country
        • Brazil
        • Mexico
        • Colombia
        • Rest of Latin America
      • By Sweetener Type
      • By Source
      • By Application
      • By Formulation Type
    • Market Attractiveness Analysis
      • By Country
      • By Sweetener Type
      • By Source
      • By Application
      • By Formulation Type
    • Key Takeaways
  13. Europe Market Analysis 2020 to 2024 and Forecast 2025 to 2035, By Country
    • Historical Market Size Value (USD Million) & Volume (MT) Trend Analysis By Market Taxonomy, 2020 to 2024
    • Market Size Value (USD Million) & Volume (MT) Forecast By Market Taxonomy, 2025 to 2035
      • By Country
        • Germany
        • UK
        • France
        • Italy
        • Spain
        • Belgium
        • Netherlands
        • Nordic
        • Switzerland
        • Russia
        • Poland
        • Rest of Europe
      • By Sweetener Type
      • By Source
      • By Application
      • By Formulation Type
    • Market Attractiveness Analysis
      • By Country
      • By Sweetener Type
      • By Source
      • By Application
      • By Formulation Type
    • Key Takeaways
  14. East Asia Market Analysis 2020 to 2024 and Forecast 2025 to 2035, By Country
    • Historical Market Size Value (USD Million) & Volume (MT) Trend Analysis By Market Taxonomy, 2020 to 2024
    • Market Size Value (USD Million) & Volume (MT) Forecast By Market Taxonomy, 2025 to 2035
      • By Country
        • China
        • Japan
        • South Korea
      • By Sweetener Type
      • By Source
      • By Application
      • By Formulation Type
    • Market Attractiveness Analysis
      • By Country
      • By Sweetener Type
      • By Source
      • By Application
      • By Formulation Type
    • Key Takeaways
  15. South Asia and Pacific Market Analysis 2020 to 2024 and Forecast 2025 to 2035, By Country
    • Historical Market Size Value (USD Million) & Volume (MT) Trend Analysis By Market Taxonomy, 2020 to 2024
    • Market Size Value (USD Million) & Volume (MT) Forecast By Market Taxonomy, 2025 to 2035
      • By Country
        • India
        • Thailand
        • Malaysia
        • Indonesia
        • Singapore
        • Vietnam
        • Australia
        • New Zealand
        • Rest of South Asia & Pacific
      • By Sweetener Type
      • By Source
      • By Application
      • By Formulation Type
    • Market Attractiveness Analysis
      • By Country
      • By Sweetener Type
      • By Source
      • By Application
      • By Formulation Type
    • Key Takeaways
  16. Middle East and Africa Market Analysis 2020 to 2024 and Forecast 2025 to 2035, By Country
    • Historical Market Size Value (USD Million) & Volume (MT) Trend Analysis By Market Taxonomy, 2020 to 2024
    • Market Size Value (USD Million) & Volume (MT) Forecast By Market Taxonomy, 2025 to 2035
      • By Country
        • Turkey
        • UAE
        • Saudi Arabia
        • Israel
        • Other GCC Countries
        • North Africa
        • South Africa
        • Central Africa
      • By Sweetener Type
      • By Source
      • By Application
      • By Formulation Type
    • Market Attractiveness Analysis
      • By Country
      • By Sweetener Type
      • By Source
      • By Application
      • By Formulation Type
    • Key Takeaways
  17. Key Countries Market Analysis
    • USA
      • Pricing Analysis
      • Market Share Analysis, 2024
        • By Sweetener Type
        • By Source
        • By Application
        • By Formulation Type
    • Canada
      • Pricing Analysis
      • Market Share Analysis, 2024
        • By Sweetener Type
        • By Source
        • By Application
        • By Formulation Type
    • Brazil
      • Pricing Analysis
      • Market Share Analysis, 2024
        • By Sweetener Type
        • By Source
        • By Application
        • By Formulation Type
    • Mexico
      • Pricing Analysis
      • Market Share Analysis, 2024
        • By Sweetener Type
        • By Source
        • By Application
        • By Formulation Type
    • Colombia
      • Pricing Analysis
      • Market Share Analysis, 2024
        • By Sweetener Type
        • By Source
        • By Application
        • By Formulation Type
    • Germany
      • Pricing Analysis
      • Market Share Analysis, 2024
        • By Sweetener Type
        • By Source
        • By Application
        • By Formulation Type
    • UK
      • Pricing Analysis
      • Market Share Analysis, 2024
        • By Sweetener Type
        • By Source
        • By Application
        • By Formulation Type
    • France
      • Pricing Analysis
      • Market Share Analysis, 2024
        • By Sweetener Type
        • By Source
        • By Application
        • By Formulation Type
    • Italy
      • Pricing Analysis
      • Market Share Analysis, 2024
        • By Sweetener Type
        • By Source
        • By Application
        • By Formulation Type
    • Spain
      • Pricing Analysis
      • Market Share Analysis, 2024
        • By Sweetener Type
        • By Source
        • By Application
        • By Formulation Type
    • Belgium
      • Pricing Analysis
      • Market Share Analysis, 2024
        • By Sweetener Type
        • By Source
        • By Application
        • By Formulation Type
    • Netherlands
      • Pricing Analysis
      • Market Share Analysis, 2024
        • By Sweetener Type
        • By Source
        • By Application
        • By Formulation Type
    • Nordic
      • Pricing Analysis
      • Market Share Analysis, 2024
        • By Sweetener Type
        • By Source
        • By Application
        • By Formulation Type
    • Switzerland
      • Pricing Analysis
      • Market Share Analysis, 2024
        • By Sweetener Type
        • By Source
        • By Application
        • By Formulation Type
    • Russia
      • Pricing Analysis
      • Market Share Analysis, 2024
        • By Sweetener Type
        • By Source
        • By Application
        • By Formulation Type
    • Poland
      • Pricing Analysis
      • Market Share Analysis, 2024
        • By Sweetener Type
        • By Source
        • By Application
        • By Formulation Type
    • China
      • Pricing Analysis
      • Market Share Analysis, 2024
        • By Sweetener Type
        • By Source
        • By Application
        • By Formulation Type
    • Japan
      • Pricing Analysis
      • Market Share Analysis, 2024
        • By Sweetener Type
        • By Source
        • By Application
        • By Formulation Type
    • South Korea
      • Pricing Analysis
      • Market Share Analysis, 2024
        • By Sweetener Type
        • By Source
        • By Application
        • By Formulation Type
    • India
      • Pricing Analysis
      • Market Share Analysis, 2024
        • By Sweetener Type
        • By Source
        • By Application
        • By Formulation Type
    • Thailand
      • Pricing Analysis
      • Market Share Analysis, 2024
        • By Sweetener Type
        • By Source
        • By Application
        • By Formulation Type
    • Malaysia
      • Pricing Analysis
      • Market Share Analysis, 2024
        • By Sweetener Type
        • By Source
        • By Application
        • By Formulation Type
    • Indonesia
      • Pricing Analysis
      • Market Share Analysis, 2024
        • By Sweetener Type
        • By Source
        • By Application
        • By Formulation Type
    • Australia
      • Pricing Analysis
      • Market Share Analysis, 2024
        • By Sweetener Type
        • By Source
        • By Application
        • By Formulation Type
    • New Zealand
      • Pricing Analysis
      • Market Share Analysis, 2024
        • By Sweetener Type
        • By Source
        • By Application
        • By Formulation Type
    • Turkey
      • Pricing Analysis
      • Market Share Analysis, 2024
        • By Sweetener Type
        • By Source
        • By Application
        • By Formulation Type
    • UAE
      • Pricing Analysis
      • Market Share Analysis, 2024
        • By Sweetener Type
        • By Source
        • By Application
        • By Formulation Type
    • Saudi Arabia
      • Pricing Analysis
      • Market Share Analysis, 2024
        • By Sweetener Type
        • By Source
        • By Application
        • By Formulation Type
    • South Africa
      • Pricing Analysis
      • Market Share Analysis, 2024
        • By Sweetener Type
        • By Source
        • By Application
        • By Formulation Type
  18. Market Structure Analysis
    • Competition Dashboard
    • Competition Benchmarking
    • Market Share Analysis of Top Players
      • By Regional
      • By Sweetener Type
      • By Source
      • By Application
      • By Formulation Type
  19. Competition Analysis
    • Competition Deep Dive
      • Ajinomoto Co., Inc.
        • Overview
        • Product Portfolio
        • Profitability by Market Segments (Product/Age /Sales Channel/Region)
        • Sales Footprint
        • Strategy Overview
        • Sweegen Inc.
        • Conagen Inc.
        • Bestzyme Biotech
        • Roquette (via BRAIN AG JV)
        • Bonumose Inc.
        • Avansya (Cargill + DSM JV)
        • Manus Bio
        • Samyang Corporation
        • Oobli (formerly Joywell)
        • Others
    • Assumptions & Acronyms Used
    • Research Methodology

List of Tables

  • Table 1: Global Market Value (USD Million) Forecast by Region, 2020-2035
  • Table 2: Global Market Volume (MT) Forecast by Region, 2020-2035
  • Table 3: Global Market Value (USD Million) Forecast by Sweetener Type, 2020-2035
  • Table 4: Global Market Volume (MT) Forecast by Sweetener Type, 2020-2035
  • Table 5: Global Market Value (USD Million) Forecast by Source, 2020-2035
  • Table 6: Global Market Volume (MT) Forecast by Source, 2020-2035
  • Table 7: Global Market Value (USD Million) Forecast by Application, 2020-2035
  • Table 8: Global Market Volume (MT) Forecast by Application, 2020-2035
  • Table 9: Global Market Value (USD Million) Forecast by Formulation Type, 2020-2035
  • Table 10: Global Market Volume (MT) Forecast by Formulation Type, 2020-2035
  • Table 11: North America Market Value (USD Million) Forecast by Country, 2020-2035
  • Table 12: North America Market Volume (MT) Forecast by Country, 2020-2035
  • Table 13: North America Market Value (USD Million) Forecast by Sweetener Type, 2020-2035
  • Table 14: North America Market Volume (MT) Forecast by Sweetener Type, 2020-2035
  • Table 15: North America Market Value (USD Million) Forecast by Source, 2020-2035
  • Table 16: North America Market Volume (MT) Forecast by Source, 2020-2035
  • Table 17: North America Market Value (USD Million) Forecast by Application, 2020-2035
  • Table 18: North America Market Volume (MT) Forecast by Application, 2020-2035
  • Table 19: North America Market Value (USD Million) Forecast by Formulation Type, 2020-2035
  • Table 20: North America Market Volume (MT) Forecast by Formulation Type, 2020-2035
  • Table 21: Latin America Market Value (USD Million) Forecast by Country, 2020-2035
  • Table 22: Latin America Market Volume (MT) Forecast by Country, 2020-2035
  • Table 23: Latin America Market Value (USD Million) Forecast by Sweetener Type, 2020-2035
  • Table 24: Latin America Market Volume (MT) Forecast by Sweetener Type, 2020-2035
  • Table 25: Latin America Market Value (USD Million) Forecast by Source, 2020-2035
  • Table 26: Latin America Market Volume (MT) Forecast by Source, 2020-2035
  • Table 27: Latin America Market Value (USD Million) Forecast by Application, 2020-2035
  • Table 28: Latin America Market Volume (MT) Forecast by Application, 2020-2035
  • Table 29: Latin America Market Value (USD Million) Forecast by Formulation Type, 2020-2035
  • Table 30: Latin America Market Volume (MT) Forecast by Formulation Type, 2020-2035
  • Table 31: Europe Market Value (USD Million) Forecast by Country, 2020-2035
  • Table 32: Europe Market Volume (MT) Forecast by Country, 2020-2035
  • Table 33: Europe Market Value (USD Million) Forecast by Sweetener Type, 2020-2035
  • Table 34: Europe Market Volume (MT) Forecast by Sweetener Type, 2020-2035
  • Table 35: Europe Market Value (USD Million) Forecast by Source, 2020-2035
  • Table 36: Europe Market Volume (MT) Forecast by Source, 2020-2035
  • Table 37: Europe Market Value (USD Million) Forecast by Application, 2020-2035
  • Table 38: Europe Market Volume (MT) Forecast by Application, 2020-2035
  • Table 39: Europe Market Value (USD Million) Forecast by Formulation Type, 2020-2035
  • Table 40: Europe Market Volume (MT) Forecast by Formulation Type, 2020-2035
  • Table 41: East Asia Market Value (USD Million) Forecast by Country, 2020-2035
  • Table 42: East Asia Market Volume (MT) Forecast by Country, 2020-2035
  • Table 43: East Asia Market Value (USD Million) Forecast by Sweetener Type, 2020-2035
  • Table 44: East Asia Market Volume (MT) Forecast by Sweetener Type, 2020-2035
  • Table 45: East Asia Market Value (USD Million) Forecast by Source, 2020-2035
  • Table 46: East Asia Market Volume (MT) Forecast by Source, 2020-2035
  • Table 47: East Asia Market Value (USD Million) Forecast by Application, 2020-2035
  • Table 48: East Asia Market Volume (MT) Forecast by Application, 2020-2035
  • Table 49: East Asia Market Value (USD Million) Forecast by Formulation Type, 2020-2035
  • Table 50: East Asia Market Volume (MT) Forecast by Formulation Type, 2020-2035
  • Table 51: South Asia and Pacific Market Value (USD Million) Forecast by Country, 2020-2035
  • Table 52: South Asia and Pacific Market Volume (MT) Forecast by Country, 2020-2035
  • Table 53: South Asia and Pacific Market Value (USD Million) Forecast by Sweetener Type, 2020-2035
  • Table 54: South Asia and Pacific Market Volume (MT) Forecast by Sweetener Type, 2020-2035
  • Table 55: South Asia and Pacific Market Value (USD Million) Forecast by Source, 2020-2035
  • Table 56: South Asia and Pacific Market Volume (MT) Forecast by Source, 2020-2035
  • Table 57: South Asia and Pacific Market Value (USD Million) Forecast by Application, 2020-2035
  • Table 58: South Asia and Pacific Market Volume (MT) Forecast by Application, 2020-2035
  • Table 59: South Asia and Pacific Market Value (USD Million) Forecast by Formulation Type, 2020-2035
  • Table 60: South Asia and Pacific Market Volume (MT) Forecast by Formulation Type, 2020-2035
  • Table 61: Middle East and Africa Market Value (USD Million) Forecast by Country, 2020-2035
  • Table 62: Middle East and Africa Market Volume (MT) Forecast by Country, 2020-2035
  • Table 63: Middle East and Africa Market Value (USD Million) Forecast by Sweetener Type, 2020-2035
  • Table 64: Middle East and Africa Market Volume (MT) Forecast by Sweetener Type, 2020-2035
  • Table 65: Middle East and Africa Market Value (USD Million) Forecast by Source, 2020-2035
  • Table 66: Middle East and Africa Market Volume (MT) Forecast by Source, 2020-2035
  • Table 67: Middle East and Africa Market Value (USD Million) Forecast by Application, 2020-2035
  • Table 68: Middle East and Africa Market Volume (MT) Forecast by Application, 2020-2035
  • Table 69: Middle East and Africa Market Value (USD Million) Forecast by Formulation Type, 2020-2035
  • Table 70: Middle East and Africa Market Volume (MT) Forecast by Formulation Type, 2020-2035

List of Figures

  • Figure 1: Global Market Volume (MT) Forecast 2020-2035
  • Figure 2: Global Market Pricing Analysis
  • Figure 3: Global Market Value (USD Million) Forecast 2020-2035
  • Figure 4: Global Market Value Share and BPS Analysis by Sweetener Type, 2025 and 2035
  • Figure 5: Global Market Y-o-Y Growth Comparison by Sweetener Type, 2025-2035
  • Figure 6: Global Market Attractiveness Analysis by Sweetener Type
  • Figure 7: Global Market Value Share and BPS Analysis by Source, 2025 and 2035
  • Figure 8: Global Market Y-o-Y Growth Comparison by Source, 2025-2035
  • Figure 9: Global Market Attractiveness Analysis by Source
  • Figure 10: Global Market Value Share and BPS Analysis by Application, 2025 and 2035
  • Figure 11: Global Market Y-o-Y Growth Comparison by Application, 2025-2035
  • Figure 12: Global Market Attractiveness Analysis by Application
  • Figure 13: Global Market Value Share and BPS Analysis by Formulation Type, 2025 and 2035
  • Figure 14: Global Market Y-o-Y Growth Comparison by Formulation Type, 2025-2035
  • Figure 15: Global Market Attractiveness Analysis by Formulation Type
  • Figure 16: Global Market Value (USD Million) Share and BPS Analysis by Region, 2025 and 2035
  • Figure 17: Global Market Y-o-Y Growth Comparison by Region, 2025-2035
  • Figure 18: Global Market Attractiveness Analysis by Region
  • Figure 19: North America Market Incremental $ Opportunity, 2025-2035
  • Figure 20: Latin America Market Incremental $ Opportunity, 2025-2035
  • Figure 21: Europe Market Incremental $ Opportunity, 2025-2035
  • Figure 22: East Asia Market Incremental $ Opportunity, 2025-2035
  • Figure 23: South Asia and Pacific Market Incremental $ Opportunity, 2025-2035
  • Figure 24: Middle East and Africa Market Incremental $ Opportunity, 2025-2035
  • Figure 25: North America Market Value Share and BPS Analysis by Country, 2025 and 2035
  • Figure 26: North America Market Value Share and BPS Analysis by Sweetener Type, 2025 and 2035
  • Figure 27: North America Market Y-o-Y Growth Comparison by Sweetener Type, 2025-2035
  • Figure 28: North America Market Attractiveness Analysis by Sweetener Type
  • Figure 29: North America Market Value Share and BPS Analysis by Source, 2025 and 2035
  • Figure 30: North America Market Y-o-Y Growth Comparison by Source, 2025-2035
  • Figure 31: North America Market Attractiveness Analysis by Source
  • Figure 32: North America Market Value Share and BPS Analysis by Application, 2025 and 2035
  • Figure 33: North America Market Y-o-Y Growth Comparison by Application, 2025-2035
  • Figure 34: North America Market Attractiveness Analysis by Application
  • Figure 35: North America Market Value Share and BPS Analysis by Formulation Type, 2025 and 2035
  • Figure 36: North America Market Y-o-Y Growth Comparison by Formulation Type, 2025-2035
  • Figure 37: North America Market Attractiveness Analysis by Formulation Type
  • Figure 38: Latin America Market Value Share and BPS Analysis by Country, 2025 and 2035
  • Figure 39: Latin America Market Value Share and BPS Analysis by Sweetener Type, 2025 and 2035
  • Figure 40: Latin America Market Y-o-Y Growth Comparison by Sweetener Type, 2025-2035
  • Figure 41: Latin America Market Attractiveness Analysis by Sweetener Type
  • Figure 42: Latin America Market Value Share and BPS Analysis by Source, 2025 and 2035
  • Figure 43: Latin America Market Y-o-Y Growth Comparison by Source, 2025-2035
  • Figure 44: Latin America Market Attractiveness Analysis by Source
  • Figure 45: Latin America Market Value Share and BPS Analysis by Application, 2025 and 2035
  • Figure 46: Latin America Market Y-o-Y Growth Comparison by Application, 2025-2035
  • Figure 47: Latin America Market Attractiveness Analysis by Application
  • Figure 48: Latin America Market Value Share and BPS Analysis by Formulation Type, 2025 and 2035
  • Figure 49: Latin America Market Y-o-Y Growth Comparison by Formulation Type, 2025-2035
  • Figure 50: Latin America Market Attractiveness Analysis by Formulation Type
  • Figure 51: Europe Market Value Share and BPS Analysis by Country, 2025 and 2035
  • Figure 52: Europe Market Value Share and BPS Analysis by Sweetener Type, 2025 and 2035
  • Figure 53: Europe Market Y-o-Y Growth Comparison by Sweetener Type, 2025-2035
  • Figure 54: Europe Market Attractiveness Analysis by Sweetener Type
  • Figure 55: Europe Market Value Share and BPS Analysis by Source, 2025 and 2035
  • Figure 56: Europe Market Y-o-Y Growth Comparison by Source, 2025-2035
  • Figure 57: Europe Market Attractiveness Analysis by Source
  • Figure 58: Europe Market Value Share and BPS Analysis by Application, 2025 and 2035
  • Figure 59: Europe Market Y-o-Y Growth Comparison by Application, 2025-2035
  • Figure 60: Europe Market Attractiveness Analysis by Application
  • Figure 61: Europe Market Value Share and BPS Analysis by Formulation Type, 2025 and 2035
  • Figure 62: Europe Market Y-o-Y Growth Comparison by Formulation Type, 2025-2035
  • Figure 63: Europe Market Attractiveness Analysis by Formulation Type
  • Figure 64: East Asia Market Value Share and BPS Analysis by Country, 2025 and 2035
  • Figure 65: East Asia Market Value Share and BPS Analysis by Sweetener Type, 2025 and 2035
  • Figure 66: East Asia Market Y-o-Y Growth Comparison by Sweetener Type, 2025-2035
  • Figure 67: East Asia Market Attractiveness Analysis by Sweetener Type
  • Figure 68: East Asia Market Value Share and BPS Analysis by Source, 2025 and 2035
  • Figure 69: East Asia Market Y-o-Y Growth Comparison by Source, 2025-2035
  • Figure 70: East Asia Market Attractiveness Analysis by Source
  • Figure 71: East Asia Market Value Share and BPS Analysis by Application, 2025 and 2035
  • Figure 72: East Asia Market Y-o-Y Growth Comparison by Application, 2025-2035
  • Figure 73: East Asia Market Attractiveness Analysis by Application
  • Figure 74: East Asia Market Value Share and BPS Analysis by Formulation Type, 2025 and 2035
  • Figure 75: East Asia Market Y-o-Y Growth Comparison by Formulation Type, 2025-2035
  • Figure 76: East Asia Market Attractiveness Analysis by Formulation Type
  • Figure 77: South Asia and Pacific Market Value Share and BPS Analysis by Country, 2025 and 2035
  • Figure 78: South Asia and Pacific Market Value Share and BPS Analysis by Sweetener Type, 2025 and 2035
  • Figure 79: South Asia and Pacific Market Y-o-Y Growth Comparison by Sweetener Type, 2025-2035
  • Figure 80: South Asia and Pacific Market Attractiveness Analysis by Sweetener Type
  • Figure 81: South Asia and Pacific Market Value Share and BPS Analysis by Source, 2025 and 2035
  • Figure 82: South Asia and Pacific Market Y-o-Y Growth Comparison by Source, 2025-2035
  • Figure 83: South Asia and Pacific Market Attractiveness Analysis by Source
  • Figure 84: South Asia and Pacific Market Value Share and BPS Analysis by Application, 2025 and 2035
  • Figure 85: South Asia and Pacific Market Y-o-Y Growth Comparison by Application, 2025-2035
  • Figure 86: South Asia and Pacific Market Attractiveness Analysis by Application
  • Figure 87: South Asia and Pacific Market Value Share and BPS Analysis by Formulation Type, 2025 and 2035
  • Figure 88: South Asia and Pacific Market Y-o-Y Growth Comparison by Formulation Type, 2025-2035
  • Figure 89: South Asia and Pacific Market Attractiveness Analysis by Formulation Type
  • Figure 90: Middle East and Africa Market Value Share and BPS Analysis by Country, 2025 and 2035
  • Figure 91: Middle East and Africa Market Value Share and BPS Analysis by Sweetener Type, 2025 and 2035
  • Figure 92: Middle East and Africa Market Y-o-Y Growth Comparison by Sweetener Type, 2025-2035
  • Figure 93: Middle East and Africa Market Attractiveness Analysis by Sweetener Type
  • Figure 94: Middle East and Africa Market Value Share and BPS Analysis by Source, 2025 and 2035
  • Figure 95: Middle East and Africa Market Y-o-Y Growth Comparison by Source, 2025-2035
  • Figure 96: Middle East and Africa Market Attractiveness Analysis by Source
  • Figure 97: Middle East and Africa Market Value Share and BPS Analysis by Application, 2025 and 2035
  • Figure 98: Middle East and Africa Market Y-o-Y Growth Comparison by Application, 2025-2035
  • Figure 99: Middle East and Africa Market Attractiveness Analysis by Application
  • Figure 100: Middle East and Africa Market Value Share and BPS Analysis by Formulation Type, 2025 and 2035
  • Figure 101: Middle East and Africa Market Y-o-Y Growth Comparison by Formulation Type, 2025-2035
  • Figure 102: Middle East and Africa Market Attractiveness Analysis by Formulation Type
  • Figure 103: Global Market - Tier Structure Analysis
  • Figure 104: Global Market - Company Share Analysis

Frequently Asked Questions

How big is the Next-Generation Sweeteners in 2025?

The global Next-Generation Sweeteners is estimated to be valued at USD 435.6 million in 2025.

What will be the size of Next-Generation Sweeteners in 2035?

The market size for the Next-Generation Sweeteners is projected to reach USD 800.2 million by 2035.

How much will be the Next-Generation Sweeteners growth between 2025 and 2035?

The Next-Generation Sweeteners is expected to grow at a 6.3% CAGR between 2025 and 2035.

What are the key sweetener type in the Next-Generation Sweeteners?

The key sweetener type in the Next-Generation Sweeteners Market are The key sweetener types in the market include Peptide-Based Sweeteners, Mogroside V, Brazzein, Thaumatin I & II, and Monellin, among others.

Which sources egment to contribute significant share in the Next-Generation Sweeteners in 2025?

In terms of source, the plant-derived segment is projected to command the largest share at 55% in the Next-Generation Sweeteners Market in 2025.

Explore Similar Insights

Future Market Insights

Next Generation Sweeteners Market

Chat With

MaRIA

Hi There, I am MaRIA, Your Market Research Intelligence Assistant. How may I help you?