Reports

- Global Locations -

Headquarters

Future Market Insights, Inc.

Christiana Corporate, 200
Continental Drive, Suite 401,
Newark, Delaware - 19713,
United States

T: +1-845-579-5705

Americas

Future Market Insights, Inc.

616 Corporate Way, Suite 2-9018,
Valley Cottage, NY 10989, United States

T: +1-347-918-3531

MEA

Future Market Insights

1602-6 Jumeirah Bay X2 Tower, Plot No: JLT-PH2-X2A,
Jumeirah Lakes Towers, Dubai,
United Arab Emirates

Europe

Future Market Insights

3rd Floor, 207 Regent Street,
W1B 3HH London
United Kingdom

T: + 44 (0) 20 8123 9659
D: +44 (0) 20 3287 4268

Asia Pacific

Future Market Insights

IndiaLand Global Tech Park, Unit UG-1, Behind Grand HighStreet, Phase 1, Hinjawadi, MH, Pune – 411057, India

Next Generation Mass Spectrometer Market Outlook (2022 to 2032)

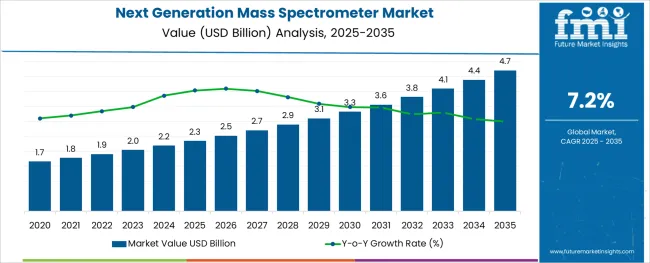
[300 Pages Report] The global next generation mass spectrometer market size reached a valuation of US$ 1,901.7 Million in 2022. Rapid technological advancements in the field of spectrometry, such as the development of miniaturized spectrometers, are major factors driving market revenue growth. The overall sales of next generation mass spectrometers are projected to grow at a robust CAGR of 7.2% between 2022 and 2032, totaling around US$ 4,097.1 Million by the end of 2032.

Data Points Key Statistics
Next Generation Mass Spectrometer Market Size (2022) US$ 1,901.7 Million
Next Generation Mass Spectrometer Market Revenue Forecast (2032) US$ 4,097.1 Million
Next generation mass spectrometer Market Growth Rate (2022 to 2032) 7.2% CAGR
North America Market Share 33%

Next generation mass spectrometers are technologically advanced and application centered. The only platform that generates an upgrade path to high-definition systems is the next generation mass spectrometer. With next-generation mass spectrometers, laboratories can use fewer components with less time to prepare, higher specificity and selectivity, full scan analysis, and simpler mass spectrometry optimization resulting in more comprehensive quantification and retrospective interpretation. With the advancement of new tools and software, next-generation mass spectrometers continue to improve in both resolution and speed at an incredible rate.

The hardware in next-generation mass spectrometers is designed to transport fragile molecules into a gaseous ionized state, where the molecules are then analyzed. Matrix-assisted laser desorption/ionization (MALDI), electrospray ionized particles, and surface-enhanced laser desorption/ionization are instances of next-generation mass spectrometers (SELDI).

Furthermore, the next-generation mass spectrometer has evolved from a large and expensive machine. In addition, the next generation mass spectrometer is utilized to predict a patient's rehabilitation after surgery and the characteristics of immune system response.

Don't pay for what you don't need

Customize your report by selecting specific countries or regions and save 30%!

Which Factors are driving the Growth of the Next generation mass spectrometer Market?

The major factor for the growth of the next generation mass spectrometer market is a rise in government spending on life sciences and pharmaceutical study and development.

Furthermore, rising food concerns, clamor in agriculture and medical research, enabling innovative diagnosis, new drug development for diseases, and competitive post-sale and technical assistance, all contributed to a rise in the adaptation of next-generation mass spectrometers.

Which Factors are restraining the Growth of the Next Generation Mass Spectrometer Market?

However, the significantly high cost of the device and a lack of skilled personnel to operate next generation mass spectrometers are some of the key restraints in the market.

How Will Growth unfold in the North America Next generation mass spectrometer Market?

Because of increased government investment opportunities in biomedical and biotechnology areas, North America is anticipated to dominate the global next generation mass spectrometer market.

In North America, the key markets for next generation mass spectrometers are the United States and Canada. The market in this region will grow more rapidly than the markets in Europe, Asia Pacific, and South America. Several pharmaceutical companies' greater emphasis on drug research and development will aid the growth of the next generation mass spectrometer market in North America over the forecast timeframe. North America is accounting for a market share of 33% of the global Next generation mass spectrometer market.
Sabyasachi Ghosh
Sabyasachi Ghosh

Principal Consultant

Talk to Analyst

Find your sweet spots for generating winning opportunities in this market.

Which Factors Pushing the Next Generation Mass Spectrometer Market in the Asia Pacific?

Furthermore, increased research in the pharmaceutical and medical fields is promoting the growth of global next generation mass spectrometers in the region. Similarly, the huge number of conferences, production, and research facilities of industries in the Asia-Pacific excluding Japan market is expected to drive the growth of the next generation mass spectrometer market throughout the forecast period.

How Will Growth unfold in the European Next Generation Mass Spectrometer Market?

Tandem mass spectrometry devices are in high demand in Europe right now. Diagnostic and therapeutic chemistry and immunoassay techniques are employed in traditional hospital diagnostic assays, which entail analyte-specific reagents and antibodies.

The integration of liquid chromatography and tandem mass spectrometry allows for the unambiguous identification of antibiotic and antibacterial representative traces in complex biological matrices. Elevated research in genetics, particularly proteomics, and the use of alongside next generation mass spectrometers for the same are cruising market growth in Europe. Europe is accounting for a market share of 25.9% of the global Next generation mass spectrometer market.

Get the data you need at a Fraction of the cost

Personalize your report by choosing insights you need
and save 40%!

Category-wise Analysis

Which Segments Dominate the Global Next Generation Mass Spectrometer Market?

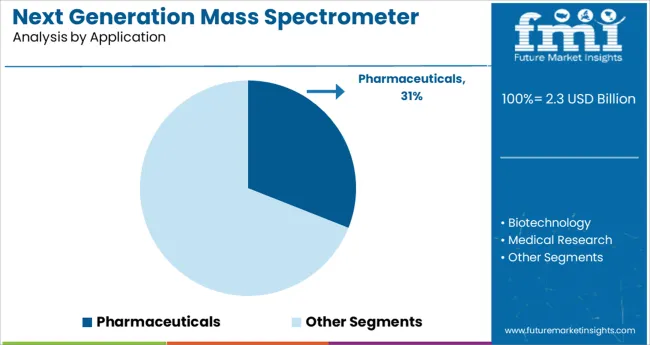
The market is divided into applications such as pharmaceuticals, biotechnology, medical research, food and beverage testing, and others. Pharmaceutical industries, for example, have a broad scope of the next generation mass spectrometer due to a rise in cases of adulterated food, drug safety, and new drug advancement for diseases.

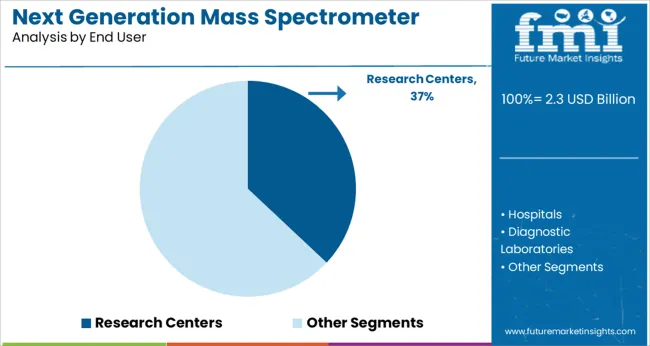
Furthermore, medical research has bolstered the global next generation mass spectrometer market. The market is divided into three segments based on end-users: hospitals, research centers, and diagnostic laboratories. Globally, next-generation mass spectrometers are most commonly used in experiments and diagnostic laboratory facilities.

The Start-up Ecosystem: How key Players are opening Frontiers for Future Growth?

Manufacturers are adopting various marketing strategies such as new product launches, geographical expansion, mergers and acquisitions, partnerships, and collaboration to identify the interest of potential buyers and create a larger customer base. For instance,
  • MOBILion Systems is dedicated to the development of instruments that improve disease prediction, diagnosis, and treatment. MOBILion Systems, headquartered in Chadds Ford, Pennsylvania, was founded in 2015. MOBILion raised $35 million in August 2020 to help improve mass spectrometry accuracy.
  • Andson Biotechnology, which was founded in 2021, is developing novel process analytical technologies (PATs) to be utilized in modern biopharmaceutical workflows. With a tool called mass spectrometry, Andson's sensors enable rapid and accurate measurement of important biomolecules to ensure the drug quality of a product.

Who are the Leading Players in the Next Generation Mass Spectrometer Market?

Some of the leading next generation mass spectrometer manufacturers include

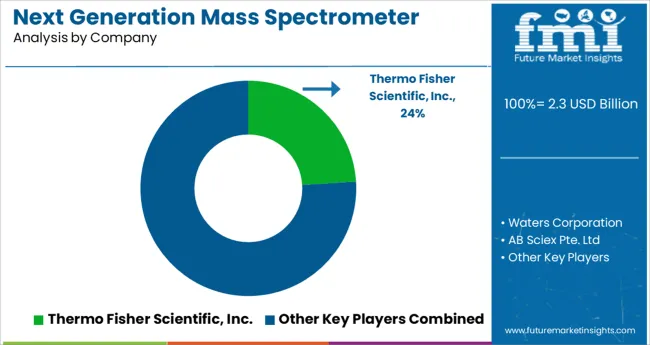
Waters Corporation, Thermo Fisher Scientific, Inc., AB Sciex Pte. Ltd., Bruker Corporation, Shimadzu Corporation, anaher Corporation, PerkinElmer, Rigaku, Bio-Rad Laboratories, Jeol Ltd, and Agilent Technologies.

These key next generation mass spectrometer providers are adopting various strategies such as new product launches and approvals, partnerships, collaborations, acquisitions, mergers, etc. to increase their sales and gain a competitive edge in the global Next generation mass spectrometer market. For instance,

  • Thermo Fisher entered into an agreement with TransMIT GmbHCenter for Mass Spectrometric Developments in June 2020 to promote a mass spectrometry imaging (MSI) platform for spatial multi-omics applications in pharmaceutical and clinical research labs
  • The SCIEX 4500 Series of mass spectrometers, introduced by AB Sciex Pte in 2021, builds on the legendary. The API 4000TM LC-MS/MS system is intelligently re-engineered to set a new standard for dependable quantitation. It provides the quantitative sensitivity, robustness, and performance you require, and it is powered by QTRAP® technology, which opens up a world of valuable experiments.
  • With an unrivaled volume-to-weight proportion and rugged reliability, Bruker's new generation of mass spectrometers MM2 and E2M, which was released in January 2021, set a benchmark in GC/MS technology.
  • Shimadzu Corporation's Nexera QX Multiplex LC-MS/MS System, which was launched in December 2020, uses multiple, alternating sample introduction streams for continuous mass spectrometer operation, vastly increasing laboratory utilization and profitability.

Report Scope

Report Attribute Details
Growth Rate CAGR of 7.2% from 2022 to 2032
Market Value in 2022 US$ 1,901.7 Million
Market Value in 2032 US$ 4,097.1 Million
Base Year for Estimates 2021
Historical Data 2016 to 2021
Forecast Period 2022 to 2032
Quantitative Units Revenue in US$ Million and CAGR from 2022 to 2032
Report Coverage Revenue Forecast, Company Ranking, Competitive Landscape, Growth Factors, Trends, and Pricing Analysis
Segments Covered
  • End User
  • Application
  • Region
Regions Covered
  • North America
  • Latin America
  • Europe
  • Asia Pacific
  • Middle East and Africa
Key Countries Profiled
  • The USA
  • Canada
  • Brazil
  • Mexico
  • Germany
  • The United Kingdom
  • France
  • Spain
  • Italy
  • China
  • Japan
  • South Korea
  • Singapore
  • Thailand
  • Indonesia
  • Australia
  • New Zealand
  • GCC
  • South Africa
  • Israel
Key Companies Profiled
  • Waters Corporation,
  • Thermo Fisher Scientific, Inc.
  • AB Sciex Pte. Ltd.
  • Bruker Corporation
  • Shimadzu Corporation
  • Danaher Corporation
  • PerkinElmer
  • Rigaku
  • Bio-Rad Laboratories
  • Jeol Ltd
  • Agilent Technologies
Report Customization & Pricing Available upon Request

Key Segments of Next Generation Mass Spectrometer Industry Survey

Next Generation Mass Spectrometer Market by Application:

  • Next Generation Mass Spectrometers for Pharmaceuticals
  • Next Generation Mass Spectrometers for Biotechnology
  • Next Generation Mass Spectrometers for Medical Research
  • Next Generation Mass Spectrometers for Food and Beverage Testing
  • Next Generation Mass Spectrometers for Other Applications

Next Generation Mass Spectrometer Market by End User:

  • Next Generation Mass Spectrometers for Hospitals
  • Next Generation Mass Spectrometers for Research Centers
  • Next Generation Mass Spectrometers for Diagnostic Laboratories

Next Generation Mass Spectrometer Market by Region:

  • North America Next Generation Mass Spectrometer Market
  • Latin America Next Generation Mass Spectrometer Market
  • Europe Next Generation Mass Spectrometer Market
  • Asia Pacific Next Generation Mass Spectrometer Market
  • Middle East & Africa Next generation mass spectrometer Market

Frequently Asked Questions

What is the current valuation of next generation mass spectrometer market?

The global next generation mass spectrometer market reached US$ 1,901.7 Million in 2022

What is the anticipated growth rate for Next generation mass spectrometer during the projected period?

As per FMI, the next generation mass spectrometer industry is expected to grow at a CAGR of 7.2% throughout the forecast period (2022 to 2032).

What is the projected valuation for next generation mass spectrometer market by 2032?

The global sales of next generation mass spectrometers are anticipated to total a valuation of US$ 4,097.1 Million by 2032

Which is the leading market for next generation mass spectrometers?

North America will continue to remain the most lucrative market for next generation mass spectrometers, accounting for a share of 33% in 2022

Table of Content

1. Executive Summary | Next Generation Mass Spectrometer Market 

    1.1. Global Market Outlook

    1.2. Demand-side Trends

    1.3. Supply-side Trends

    1.4. Technology Roadmap Analysis

    1.5. Analysis and Recommendations

2. Market Overview

    2.1. Market Coverage / Taxonomy

    2.2. Market Definition / Scope / Limitations

3. Market Background

    3.1. Market Dynamics

        3.1.1. Drivers

        3.1.2. Restraints

        3.1.3. Opportunity

        3.1.4. Trends

    3.2. Scenario Forecast

        3.2.1. Demand in Optimistic Scenario

        3.2.2. Demand in Likely Scenario

        3.2.3. Demand in Conservative Scenario

    3.3. Opportunity Map Analysis

    3.4. Investment Feasibility Matrix

    3.5. PESTLE and Porter’s Analysis

    3.6. Regulatory Landscape

        3.6.1. By Key Regions

        3.6.2. By Key Countries

    3.7. Regional Parent Market Outlook

4. Global Market Analysis 2016 to 2021 and Forecast, 2022 to 2032

    4.1. Historical Market Size Value (US$ Mn) Analysis, 2016 to 2021

    4.2. Current and Future Market Size Value (US$ Mn) Projections, 2022 to 2032

        4.2.1. Y-o-Y Growth Trend Analysis

        4.2.2. Absolute $ Opportunity Analysis

5. Global Market Analysis 2016 to 2021 and Forecast 2022 to 2032, By Application

    5.1. Introduction / Key Findings

    5.2. Historical Market Size Value (US$ Mn) Analysis By Application, 2016 to 2021

    5.3. Current and Future Market Size Value (US$ Mn) Analysis and Forecast By Application, 2022 to 2032

        5.3.1. Pharmaceuticals

        5.3.2. Biotechnology

        5.3.3. Medical Research

        5.3.4. Food and Beverage Testing

        5.3.5. Others

    5.4. Y-o-Y Growth Trend Analysis By Application, 2016 to 2021

    5.5. Absolute $ Opportunity Analysis By Application, 2022 to 2032

6. Global Market Analysis 2016 to 2021 and Forecast 2022 to 2032, By End User

    6.1. Introduction / Key Findings

    6.2. Historical Market Size Value (US$ Mn) Analysis By End user, 2016 to 2021

    6.3. Current and Future Market Size Value (US$ Mn) Analysis and Forecast By End user, 2022 to 2032

        6.3.1. Hospitals

        6.3.2. Research centers

        6.3.3. Diagnostic laboratories

    6.4. Y-o-Y Growth Trend Analysis By End user, 2016 to 2021

    6.5. Absolute $ Opportunity Analysis By End user, 2022 to 2032

7. Global Market Analysis 2016 to 2021 and Forecast 2022 to 2032, By Region

    7.1. Introduction

    7.2. Historical Market Size Value (US$ Mn) Analysis By Region, 2016 to 2021

    7.3. Current Market Size Value (US$ Mn) Analysis and Forecast By Region, 2022 to 2032

        7.3.1. North America

        7.3.2. Latin America

        7.3.3. Europe

        7.3.4. Asia Pacific

        7.3.5. MEA

    7.4. Market Attractiveness Analysis By Region

8. North America Market Analysis 2016 to 2021 and Forecast 2022 to 2032, By Country

    8.1. Historical Market Size Value (US$ Mn) Trend Analysis By Market Taxonomy, 2016 to 2021

    8.2. Market Size Value (US$ Mn) Forecast By Market Taxonomy, 2022 to 2032

        8.2.1. By Country

            8.2.1.1. U.S.

            8.2.1.2. Canada

        8.2.2. By Application

        8.2.3. By End user

    8.3. Market Attractiveness Analysis

        8.3.1. By Country

        8.3.2. By Application

        8.3.3. By End user

    8.4. Key Takeaways

9. Latin America Market Analysis 2016 to 2021 and Forecast 2022 to 2032, By Country

    9.1. Historical Market Size Value (US$ Mn) Trend Analysis By Market Taxonomy, 2016 to 2021

    9.2. Market Size Value (US$ Mn) Forecast By Market Taxonomy, 2022 to 2032

        9.2.1. By Country

            9.2.1.1. Brazil

            9.2.1.2. Mexico

            9.2.1.3. Rest of Latin America

        9.2.2. By Application

        9.2.3. By End user

    9.3. Market Attractiveness Analysis

        9.3.1. By Country

        9.3.2. By Application

        9.3.3. By End user

    9.4. Key Takeaways

10. Europe Market Analysis 2016 to 2021 and Forecast 2022 to 2032, By Country

    10.1. Historical Market Size Value (US$ Mn) Trend Analysis By Market Taxonomy, 2016 to 2021

    10.2. Market Size Value (US$ Mn) Forecast By Market Taxonomy, 2022 to 2032

        10.2.1. By Country

            10.2.1.1. Germany

            10.2.1.2. U.K.

            10.2.1.3. France

            10.2.1.4. Spain

            10.2.1.5. Italy

            10.2.1.6. Rest of Europe

        10.2.2. By Application

        10.2.3. By End user

    10.3. Market Attractiveness Analysis

        10.3.1. By Country

        10.3.2. By Application

        10.3.3. By End user

    10.4. Key Takeaways

11. Asia Pacific Market Analysis 2016 to 2021 and Forecast 2022 to 2032, By Country

    11.1. Historical Market Size Value (US$ Mn) Trend Analysis By Market Taxonomy, 2016 to 2021

    11.2. Market Size Value (US$ Mn) Forecast By Market Taxonomy, 2022 to 2032

        11.2.1. By Country

            11.2.1.1. China

            11.2.1.2. Japan

            11.2.1.3. South Korea

            11.2.1.4. Malaysia

            11.2.1.5. Singapore

            11.2.1.6. Australia

            11.2.1.7. Rest of Asia Pacific

        11.2.2. By Application

        11.2.3. By End user

    11.3. Market Attractiveness Analysis

        11.3.1. By Country

        11.3.2. By Application

        11.3.3. By End user

    11.4. Key Takeaways

12. MEA Market Analysis 2016 to 2021 and Forecast 2022 to 2032, By Country

    12.1. Historical Market Size Value (US$ Mn) Trend Analysis By Market Taxonomy, 2016 to 2021

    12.2. Market Size Value (US$ Mn) Forecast By Market Taxonomy, 2022 to 2032

        12.2.1. By Country

            12.2.1.1. GCC Countries

            12.2.1.2. South Africa

            12.2.1.3. Israel

            12.2.1.4. Rest of MEA

        12.2.2. By Application

        12.2.3. By End user

    12.3. Market Attractiveness Analysis

        12.3.1. By Country

        12.3.2. By Application

        12.3.3. By End user

    12.4. Key Takeaways

13. Key Countries Market Analysis

    13.1. U.K.

        13.1.1. Pricing Analysis

        13.1.2. Market Share Analysis, 2021

            13.1.2.1. By Application

            13.1.2.2. By End user

    13.2. Canada

        13.2.1. Pricing Analysis

        13.2.2. Market Share Analysis, 2021

            13.2.2.1. By Application

            13.2.2.2. By End user

    13.3. Brazil

        13.3.1. Pricing Analysis

        13.3.2. Market Share Analysis, 2021

            13.3.2.1. By Application

            13.3.2.2. By End user

    13.4. Mexico

        13.4.1. Pricing Analysis

        13.4.2. Market Share Analysis, 2021

            13.4.2.1. By Application

            13.4.2.2. By End user

    13.5. Rest of Latin America

        13.5.1. Pricing Analysis

        13.5.2. Market Share Analysis, 2021

            13.5.2.1. By Application

            13.5.2.2. By End user

    13.6. Germany

        13.6.1. Pricing Analysis

        13.6.2. Market Share Analysis, 2021

            13.6.2.1. By Application

            13.6.2.2. By End user

    13.7. U.K.

        13.7.1. Pricing Analysis

        13.7.2. Market Share Analysis, 2021

            13.7.2.1. By Application

            13.7.2.2. By End user

    13.8. France

        13.8.1. Pricing Analysis

        13.8.2. Market Share Analysis, 2021

            13.8.2.1. By Application

            13.8.2.2. By End user

    13.9. Spain

        13.9.1. Pricing Analysis

        13.9.2. Market Share Analysis, 2021

            13.9.2.1. By Application

            13.9.2.2. By End user

    13.10. Italy

        13.10.1. Pricing Analysis

        13.10.2. Market Share Analysis, 2021

            13.10.2.1. By Application

            13.10.2.2. By End user

    13.11. Rest of Europe

        13.11.1. Pricing Analysis

        13.11.2. Market Share Analysis, 2021

            13.11.2.1. By Application

            13.11.2.2. By End user

    13.12. China

        13.12.1. Pricing Analysis

        13.12.2. Market Share Analysis, 2021

            13.12.2.1. By Application

            13.12.2.2. By End user

    13.13. Japan

        13.13.1. Pricing Analysis

        13.13.2. Market Share Analysis, 2021

            13.13.2.1. By Application

            13.13.2.2. By End user

    13.14. South Korea

        13.14.1. Pricing Analysis

        13.14.2. Market Share Analysis, 2021

            13.14.2.1. By Application

            13.14.2.2. By End user

    13.15. Malaysia

        13.15.1. Pricing Analysis

        13.15.2. Market Share Analysis, 2021

            13.15.2.1. By Application

            13.15.2.2. By End user

    13.16. Singapore

        13.16.1. Pricing Analysis

        13.16.2. Market Share Analysis, 2021

            13.16.2.1. By Application

            13.16.2.2. By End user

    13.17. Australia

        13.17.1. Pricing Analysis

        13.17.2. Market Share Analysis, 2021

            13.17.2.1. By Application

            13.17.2.2. By End user

    13.18. Rest of Asia Pacific

        13.18.1. Pricing Analysis

        13.18.2. Market Share Analysis, 2021

            13.18.2.1. By Application

            13.18.2.2. By End user

    13.19. GCC Countries

        13.19.1. Pricing Analysis

        13.19.2. Market Share Analysis, 2021

            13.19.2.1. By Application

            13.19.2.2. By End user

    13.20. South Africa

        13.20.1. Pricing Analysis

        13.20.2. Market Share Analysis, 2021

            13.20.2.1. By Application

            13.20.2.2. By End user

    13.21. Israel

        13.21.1. Pricing Analysis

        13.21.2. Market Share Analysis, 2021

            13.21.2.1. By Application

            13.21.2.2. By End user

    13.22. Rest of MEA

        13.22.1. Pricing Analysis

        13.22.2. Market Share Analysis, 2021

            13.22.2.1. By Application

            13.22.2.2. By End user

14. Market Structure Analysis

    14.1. Competition Dashboard

    14.2. Competition Benchmarking

    14.3. Market Share Analysis of Top Players

        14.3.1. By Regional

        14.3.2. By Application

        14.3.3. By End user

15. Competition Analysis

    15.1. Competition Deep Dive

        15.1.1. Waters Corporation

            15.1.1.1. Overview

            15.1.1.2. Product Portfolio

            15.1.1.3. Profitability by Market Segments

            15.1.1.4. Sales Footprint

            15.1.1.5. Strategy Overview

                15.1.1.5.1. Marketing Strategy

        15.1.2. Thermo Fisher Scientific, Inc.

            15.1.2.1. Overview

            15.1.2.2. Product Portfolio

            15.1.2.3. Profitability by Market Segments

            15.1.2.4. Sales Footprint

            15.1.2.5. Strategy Overview

                15.1.2.5.1. Marketing Strategy

        15.1.3. AB Sciex Pte. Ltd

            15.1.3.1. Overview

            15.1.3.2. Product Portfolio

            15.1.3.3. Profitability by Market Segments

            15.1.3.4. Sales Footprint

            15.1.3.5. Strategy Overview

                15.1.3.5.1. Marketing Strategy

        15.1.4. Bruker Corporation

            15.1.4.1. Overview

            15.1.4.2. Product Portfolio

            15.1.4.3. Profitability by Market Segments

            15.1.4.4. Sales Footprint

            15.1.4.5. Strategy Overview

                15.1.4.5.1. Marketing Strategy

        15.1.5. Shimadzu Corporation

            15.1.5.1. Overview

            15.1.5.2. Product Portfolio

            15.1.5.3. Profitability by Market Segments

            15.1.5.4. Sales Footprint

            15.1.5.5. Strategy Overview

                15.1.5.5.1. Marketing Strategy

        15.1.6. Danaher Corporation

            15.1.6.1. Overview

            15.1.6.2. Product Portfolio

            15.1.6.3. Profitability by Market Segments

            15.1.6.4. Sales Footprint

            15.1.6.5. Strategy Overview

                15.1.6.5.1. Marketing Strategy

        15.1.7. PerkinElmer

            15.1.7.1. Overview

            15.1.7.2. Product Portfolio

            15.1.7.3. Profitability by Market Segments

            15.1.7.4. Sales Footprint

            15.1.7.5. Strategy Overview

                15.1.7.5.1. Marketing Strategy

        15.1.8. Rigaku

            15.1.8.1. Overview

            15.1.8.2. Product Portfolio

            15.1.8.3. Profitability by Market Segments

            15.1.8.4. Sales Footprint

            15.1.8.5. Strategy Overview

                15.1.8.5.1. Marketing Strategy

        15.1.9. Bio-Rad Laboratories

            15.1.9.1. Overview

            15.1.9.2. Product Portfolio

            15.1.9.3. Profitability by Market Segments

            15.1.9.4. Sales Footprint

            15.1.9.5. Strategy Overview

                15.1.9.5.1. Marketing Strategy

        15.1.10. Jeol Ltd

            15.1.10.1. Overview

            15.1.10.2. Product Portfolio

            15.1.10.3. Profitability by Market Segments

            15.1.10.4. Sales Footprint

            15.1.10.5. Strategy Overview

                15.1.10.5.1. Marketing Strategy

        15.1.11. Agilent Technologies.

            15.1.11.1. Overview

            15.1.11.2. Product Portfolio

            15.1.11.3. Profitability by Market Segments

            15.1.11.4. Sales Footprint

            15.1.11.5. Strategy Overview

                15.1.11.5.1. Marketing Strategy

16. Assumptions & Acronyms Used

17. Research Methodology

List of Tables

Table 1: Global Market Value (US$ million) Forecast by Region, 2016 to 2032

Table 2: Global Market Value (US$ million) Forecast by Application, 2016 to 2032

Table 3: Global Market Value (US$ million) Forecast by End user, 2016 to 2032

Table 4: North America Market Value (US$ million) Forecast by Country, 2016 to 2032

Table 5: North America Market Value (US$ million) Forecast by Application, 2016 to 2032

Table 6: North America Market Value (US$ million) Forecast by End user, 2016 to 2032

Table 7: Latin America Market Value (US$ million) Forecast by Country, 2016 to 2032

Table 8: Latin America Market Value (US$ million) Forecast by Application, 2016 to 2032

Table 9: Latin America Market Value (US$ million) Forecast by End user, 2016 to 2032

Table 10: Europe Market Value (US$ million) Forecast by Country, 2016 to 2032

Table 11: Europe Market Value (US$ million) Forecast by Application, 2016 to 2032

Table 12: Europe Market Value (US$ million) Forecast by End user, 2016 to 2032

Table 13: Asia Pacific Market Value (US$ million) Forecast by Country, 2016 to 2032

Table 14: Asia Pacific Market Value (US$ million) Forecast by Application, 2016 to 2032

Table 15: Asia Pacific Market Value (US$ million) Forecast by End user, 2016 to 2032

Table 16: MEA Market Value (US$ million) Forecast by Country, 2016 to 2032

Table 17: MEA Market Value (US$ million) Forecast by Application, 2016 to 2032

Table 18: MEA Market Value (US$ million) Forecast by End user, 2016 to 2032

List of Charts

Figure 1: Global Market Value (US$ million) by Application, 2022 to 2032

Figure 2: Global Market Value (US$ million) by End user, 2022 to 2032

Figure 3: Global Market Value (US$ million) by Region, 2022 to 2032

Figure 4: Global Market Value (US$ million) Analysis by Region, 2016 to 2032

Figure 5: Global Market Value Share (%) and BPS Analysis by Region, 2022 to 2032

Figure 6: Global Market Y-o-Y Growth (%) Projections by Region, 2022 to 2032

Figure 7: Global Market Value (US$ million) Analysis by Application, 2016 to 2032

Figure 8: Global Market Value Share (%) and BPS Analysis by Application, 2022 to 2032

Figure 9: Global Market Y-o-Y Growth (%) Projections by Application, 2022 to 2032

Figure 10: Global Market Value (US$ million) Analysis by End user, 2016 to 2032

Figure 11: Global Market Value Share (%) and BPS Analysis by End user, 2022 to 2032

Figure 12: Global Market Y-o-Y Growth (%) Projections by End user, 2022 to 2032

Figure 13: Global Market Attractiveness by Application, 2022 to 2032

Figure 14: Global Market Attractiveness by End user, 2022 to 2032

Figure 15: Global Market Attractiveness by Region, 2022 to 2032

Figure 16: North America Market Value (US$ million) by Application, 2022 to 2032

Figure 17: North America Market Value (US$ million) by End user, 2022 to 2032

Figure 18: North America Market Value (US$ million) by Country, 2022 to 2032

Figure 19: North America Market Value (US$ million) Analysis by Country, 2016 to 2032

Figure 20: North America Market Value Share (%) and BPS Analysis by Country, 2022 to 2032

Figure 21: North America Market Y-o-Y Growth (%) Projections by Country, 2022 to 2032

Figure 22: North America Market Value (US$ million) Analysis by Application, 2016 to 2032

Figure 23: North America Market Value Share (%) and BPS Analysis by Application, 2022 to 2032

Figure 24: North America Market Y-o-Y Growth (%) Projections by Application, 2022 to 2032

Figure 25: North America Market Value (US$ million) Analysis by End user, 2016 to 2032

Figure 26: North America Market Value Share (%) and BPS Analysis by End user, 2022 to 2032

Figure 27: North America Market Y-o-Y Growth (%) Projections by End user, 2022 to 2032

Figure 28: North America Market Attractiveness by Application, 2022 to 2032

Figure 29: North America Market Attractiveness by End user, 2022 to 2032

Figure 30: North America Market Attractiveness by Country, 2022 to 2032

Figure 31: Latin America Market Value (US$ million) by Application, 2022 to 2032

Figure 32: Latin America Market Value (US$ million) by End user, 2022 to 2032

Figure 33: Latin America Market Value (US$ million) by Country, 2022 to 2032

Figure 34: Latin America Market Value (US$ million) Analysis by Country, 2016 to 2032

Figure 35: Latin America Market Value Share (%) and BPS Analysis by Country, 2022 to 2032

Figure 36: Latin America Market Y-o-Y Growth (%) Projections by Country, 2022 to 2032

Figure 37: Latin America Market Value (US$ million) Analysis by Application, 2016 to 2032

Figure 38: Latin America Market Value Share (%) and BPS Analysis by Application, 2022 to 2032

Figure 39: Latin America Market Y-o-Y Growth (%) Projections by Application, 2022 to 2032

Figure 40: Latin America Market Value (US$ million) Analysis by End user, 2016 to 2032

Figure 41: Latin America Market Value Share (%) and BPS Analysis by End user, 2022 to 2032

Figure 42: Latin America Market Y-o-Y Growth (%) Projections by End user, 2022 to 2032

Figure 43: Latin America Market Attractiveness by Application, 2022 to 2032

Figure 44: Latin America Market Attractiveness by End user, 2022 to 2032

Figure 45: Latin America Market Attractiveness by Country, 2022 to 2032

Figure 46: Europe Market Value (US$ million) by Application, 2022 to 2032

Figure 47: Europe Market Value (US$ million) by End user, 2022 to 2032

Figure 48: Europe Market Value (US$ million) by Country, 2022 to 2032

Figure 49: Europe Market Value (US$ million) Analysis by Country, 2016 to 2032

Figure 50: Europe Market Value Share (%) and BPS Analysis by Country, 2022 to 2032

Figure 51: Europe Market Y-o-Y Growth (%) Projections by Country, 2022 to 2032

Figure 52: Europe Market Value (US$ million) Analysis by Application, 2016 to 2032

Figure 53: Europe Market Value Share (%) and BPS Analysis by Application, 2022 to 2032

Figure 54: Europe Market Y-o-Y Growth (%) Projections by Application, 2022 to 2032

Figure 55: Europe Market Value (US$ million) Analysis by End user, 2016 to 2032

Figure 56: Europe Market Value Share (%) and BPS Analysis by End user, 2022 to 2032

Figure 57: Europe Market Y-o-Y Growth (%) Projections by End user, 2022 to 2032

Figure 58: Europe Market Attractiveness by Application, 2022 to 2032

Figure 59: Europe Market Attractiveness by End user, 2022 to 2032

Figure 60: Europe Market Attractiveness by Country, 2022 to 2032

Figure 61: Asia Pacific Market Value (US$ million) by Application, 2022 to 2032

Figure 62: Asia Pacific Market Value (US$ million) by End user, 2022 to 2032

Figure 63: Asia Pacific Market Value (US$ million) by Country, 2022 to 2032

Figure 64: Asia Pacific Market Value (US$ million) Analysis by Country, 2016 to 2032

Figure 65: Asia Pacific Market Value Share (%) and BPS Analysis by Country, 2022 to 2032

Figure 66: Asia Pacific Market Y-o-Y Growth (%) Projections by Country, 2022 to 2032

Figure 67: Asia Pacific Market Value (US$ million) Analysis by Application, 2016 to 2032

Figure 68: Asia Pacific Market Value Share (%) and BPS Analysis by Application, 2022 to 2032

Figure 69: Asia Pacific Market Y-o-Y Growth (%) Projections by Application, 2022 to 2032

Figure 70: Asia Pacific Market Value (US$ million) Analysis by End user, 2016 to 2032

Figure 71: Asia Pacific Market Value Share (%) and BPS Analysis by End user, 2022 to 2032

Figure 72: Asia Pacific Market Y-o-Y Growth (%) Projections by End user, 2022 to 2032

Figure 73: Asia Pacific Market Attractiveness by Application, 2022 to 2032

Figure 74: Asia Pacific Market Attractiveness by End user, 2022 to 2032

Figure 75: Asia Pacific Market Attractiveness by Country, 2022 to 2032

Figure 76: MEA Market Value (US$ million) by Application, 2022 to 2032

Figure 77: MEA Market Value (US$ million) by End user, 2022 to 2032

Figure 78: MEA Market Value (US$ million) by Country, 2022 to 2032

Figure 79: MEA Market Value (US$ million) Analysis by Country, 2016 to 2032

Figure 80: MEA Market Value Share (%) and BPS Analysis by Country, 2022 to 2032

Figure 81: MEA Market Y-o-Y Growth (%) Projections by Country, 2022 to 2032

Figure 82: MEA Market Value (US$ million) Analysis by Application, 2016 to 2032

Figure 83: MEA Market Value Share (%) and BPS Analysis by Application, 2022 to 2032

Figure 84: MEA Market Y-o-Y Growth (%) Projections by Application, 2022 to 2032

Figure 85: MEA Market Value (US$ million) Analysis by End user, 2016 to 2032

Figure 86: MEA Market Value Share (%) and BPS Analysis by End user, 2022 to 2032

Figure 87: MEA Market Y-o-Y Growth (%) Projections by End user, 2022 to 2032

Figure 88: MEA Market Attractiveness by Application, 2022 to 2032

Figure 89: MEA Market Attractiveness by End user, 2022 to 2032

Figure 90: MEA Market Attractiveness by Country, 2022 to 2032

Recommendations

Healthcare

Atomic Spectroscopy Market

Published : September 2022

Healthcare

Spatial Mass Spectrometry Market

Published : June 2022

Healthcare

Spectrophotometers Market

Published : June 2022

Explore Healthcare Insights

View Reports

Next Generation Mass Spectrometer Market