The next generation computing market is estimated to be valued at USD 193.6 million in 2025 and is projected to reach USD 1111.6 million by 2035, registering a compound annual growth rate (CAGR) of 19.1% over the forecast period. The market experiences extraordinary expansion driven by artificial intelligence workload demands, quantum computing breakthroughs, and edge computing requirements that necessitate revolutionary processing architectures capable of handling complex algorithms and massive data sets beyond the capabilities of conventional computing systems.
Technology companies implement neuromorphic processors, quantum computing platforms, and specialized accelerators that enable machine learning, cryptographic analysis, and scientific simulation applications requiring computational power orders of magnitude greater than traditional processors. The industry's evolution toward brain-inspired computing and quantum supremacy creates demand for systems that fundamentally reimagine computational approaches while solving previously intractable problems across scientific research, financial modeling, and artificial intelligence development.
Artificial intelligence research applications represent the rapidly expanding consumption segment where next generation computing enables deep learning model training, neural network optimization, and autonomous system development that require massive parallel processing capabilities and specialized memory architectures optimized for machine learning algorithms.
Research institutions implement quantum annealing systems and neuromorphic chips that accelerate pattern recognition, natural language processing, and computer vision applications while reducing energy consumption compared to conventional GPU-based training systems. Quality assurance protocols emphasize algorithm accuracy verification, error correction validation, and performance benchmarking that ensure reliable operation throughout complex AI development workflows requiring unprecedented computational precision and speed.
Quantum computing platforms demonstrate accelerating adoption for cryptographic analysis, pharmaceutical drug discovery, and financial risk modeling applications where quantum algorithms provide exponential performance advantages over classical computing approaches for specific problem domains.
Technology companies develop superconducting quantum processors and trapped-ion systems that enable quantum simulation and optimization algorithms while addressing error correction and coherence time challenges that affect quantum computation reliability. Research collaboration networks coordinate quantum algorithm development while sharing computational resources and expertise necessary for advancing quantum computing applications across diverse scientific and commercial domains.
Scientific simulation markets create specialized segments requiring exascale computing capabilities for climate modeling, particle physics research, and materials science applications where complex mathematical models demand computational resources that approach the limits of conventional supercomputing architectures.
National laboratories and research centers implement advanced parallel processing systems and specialized accelerators that enable breakthrough scientific discoveries while supporting international research collaboration and data sharing initiatives. High-performance computing applications require advanced cooling systems and power management technologies that maintain system reliability while managing extreme energy consumption and heat generation associated with massive computational workloads.
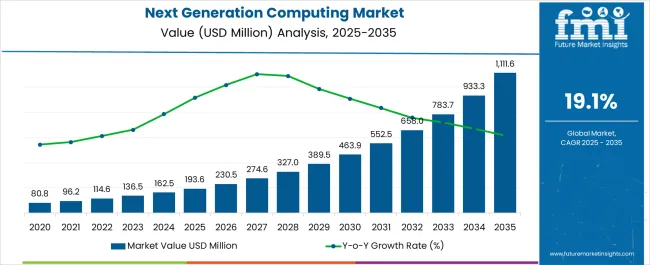
| Metric | Value |
|---|---|
| Next Generation Computing Market Estimated Value in (2025 E) | USD 193.6 million |
| Next Generation Computing Market Forecast Value in (2035 F) | USD 1111.6 million |
| Forecast CAGR (2025 to 2035) | 19.1% |
The next generation computing market is experiencing strong momentum driven by increasing demand for advanced processing power, cloud scalability, and the integration of artificial intelligence in critical workflows. Rising data complexity across industries such as healthcare, finance, and scientific research has accelerated the adoption of advanced computing infrastructures capable of handling large scale analytics and simulations.
Investments in quantum research, neuromorphic systems, and high performance computing are reshaping the landscape, while cloud based deployments continue to expand due to their flexibility and cost efficiency. Regulatory frameworks emphasizing data security and sovereignty are also influencing technology strategies, prompting enterprises to adopt hybrid and cloud first models.
The outlook remains positive as organizations prioritize performance efficiency, real time analytics, and innovation, establishing next generation computing as a key driver of digital transformation globally.
The market is segmented by Components, Offering, Type, Enterprise, and End Use and region. By Components, the market is divided into Hardware, Software, and Services. In terms of Offering, the market is classified into Cloud Based and On Premise. Based on Type, the market is segmented into High Performance Computing, Quantum Computing, Brain Type Computing, Approximate and Probabilistic Computing, Energy Efficiency Computing, Thermodynamic Computing, Memory Based Computing, Optical Computing, and Others. By Enterprise, the market is divided into SMEs and Large Enterprises. By End Use, the market is segmented into BFSI, Healthcare, Space and Defence, Energy and Power, Transportation and Logistics, Chemicals, Academia, Government, Telecom, and Others. Regionally, the market is classified into North America, Latin America, Western Europe, Eastern Europe, Balkan & Baltic Countries, Russia & Belarus, Central Asia, East Asia, South Asia & Pacific, and the Middle East & Africa.
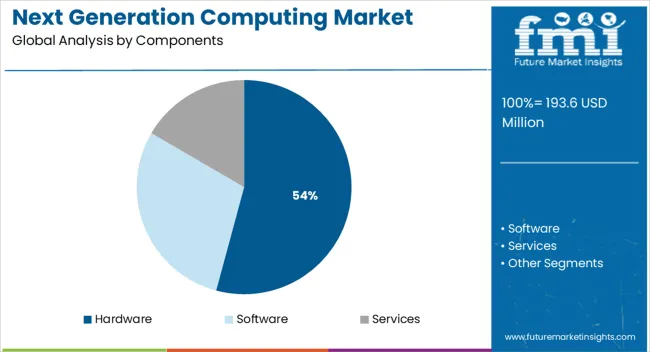
The hardware component segment is projected to hold 54.20% of total revenue by 2025, making it the leading category. This dominance is driven by the continuous demand for advanced processors, memory modules, and specialized accelerators that support high computational workloads.
Hardware investments are being prioritized to enable faster performance, energy efficiency, and scalability across diverse applications. The integration of GPUs, TPUs, and custom chips into data centers and enterprise systems has further reinforced demand.
As industries continue to rely on computationally intensive models and simulations, hardware remains the backbone of next generation computing infrastructure, ensuring reliability and long term adoption.
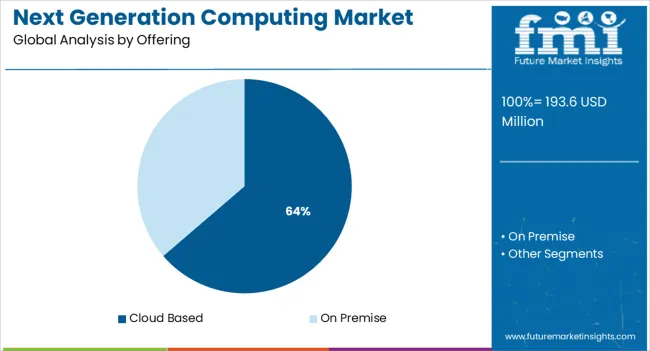
The cloud based segment is expected to account for 63.70% of market revenue by 2025, positioning it as the most prominent offering. This leadership is attributed to its scalability, cost effectiveness, and ability to provide on demand access to advanced computing resources.
Enterprises have increasingly shifted toward cloud platforms to handle fluctuating workloads, reduce infrastructure costs, and accelerate innovation cycles. Enhanced security, global availability, and integration with AI and big data solutions have reinforced adoption.
The cloud based approach is also aligned with hybrid deployment models, giving organizations flexibility to balance local infrastructure with remote computing power. This segment continues to dominate as digital transformation and global connectivity drive reliance on cloud ecosystems.
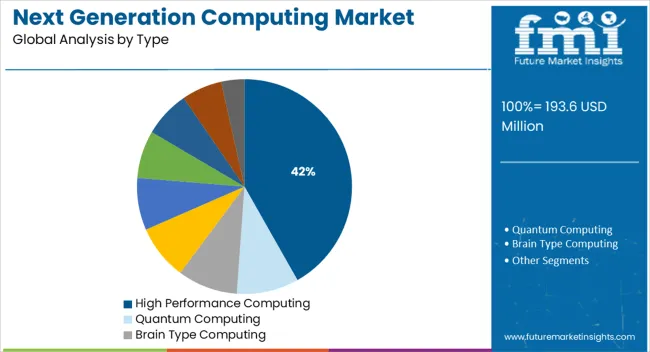
The high performance computing segment is projected to represent 41.80% of total market revenue by 2025 within the type category, making it the leading segment. This prominence is linked to the growing need for large scale simulations, modeling, and analytics in industries such as aerospace, defense, climate research, and pharmaceuticals.
The ability of high performance computing systems to process complex calculations at unprecedented speeds has made them essential to mission critical applications. Investments in supercomputers and advanced parallel processing architectures are accelerating performance benchmarks.
As organizations seek competitive advantage through data driven insights, high performance computing continues to secure its leadership role by delivering unmatched speed, precision, and reliability.
When compared to the 8.2% CAGR recorded between 2020 and 2025, the next generation computing industry is predicted to expand at a 19.1% CAGR between 2025 and 2035. The average growth of the market is expected to be around 1.19x between 2025 and 2025.
| Market Statistics | Details |
|---|---|
| Market Share (2020) | USD 56.94 billion |
| Market Share (2024) | USD 96.2 billion |
| Market Share (2025) | USD 114.57 billion |
The pandemic accelerated the cloud's uptake, since businesses could conduct operations safely from the cloud. Additionally, businesses from many sectors hastened their digital transformation in order to prepare for operational responsiveness and adjust to disturbances.
Short-term Growth (2025 to 2029): Vendors in the industry are constantly creating scalable and efficient data storage infrastructure due to the exponential growth of data produced by the business sector.
Medium-term Growth (2035 to 2035): Rapid AI adoption in many nations has increased the amount of digital data produced by different, increasing the need for large amounts of data storage. This leads to high adoption of next generation computing services.
Long-term Growth (2035 to 2035): The deployment of next generation storage to strengthen general databases for future use and optimize databases in verticals like BFSI, is likely to propel the global demand.
Current Challenges
There has been an increase in demand for information capacity to handle the massive amount of data created during this time. However, many small and medium-sized businesses have started to close, either permanently or temporarily. It has hampered revenue growth in the next generation computing sector.
The industry also faces difficulties due to a skilled labor shortage. The development of next generation computing technologies, like quantum and neuromorphic, is still in its infancy. Therefore, a trained workforce is required for the research and development of the goods and solutions for next generation computing in order to scale these technologies.
Emerging Opportunities
The IoT, the recent innovation to emerge, generates enormous amounts of data from related devices like home automation devices, GPS beacons, and virtual entertainment.
It fuels growing interest in next generation computing to store and manage the massive amounts of data generated from these channels. A few companies are embracing IoT innovation for contemporary applications.
This includes predicting hardware failure, assessing the temperature, and enabling autonomous driving, which is generating volumes of sensitive data and igniting interest in next generation computing.
Companies including Hewlett Packard Enterprise, Huawei, Hitachi, IBM, and Dell Technologies are investing heavily in next generation computing innovation. Companies are attempting to capture a sizable portion of the thriving information storage business.
In 2024, the hardware component category led the market and accounted for revenue share of more than 50.0%. The availability of different next generation computing hardware goods, including high-performance Central Processing Units (CPUs), memory & storage, and networking components, can be credited with this market segment's expansion.
During the forecast period, the services segment component is expected to expand at a CAGR of 8.2%. Deployment and end-to-end support services, for example, are becoming necessary and readily available. For instance, the France-based Atos SE company offers advisory services from quantum experts.
The cloud-based offering segment is likely to dominate the market with a CAGR of 21.5% by 2035. The benefits of cloud computing, including its affordability, adaptability, and security, support the expansion of this market.
Due to advantages like remote access and practical storage for massive data quantities, businesses across all industries are increasingly using cloud services. However, security, direct control, and physical accessibility of the information are responsible for expanding the on-premise segment.
The BFSI end-use segment is likely to lead the market with a CAGR of 9.3% by 2035. The segment's expansion can be ascribed to the BFSI sector's expanding use of next generation computing technology in areas like risk management and portfolio optimization.
On the other hand, the manufacturing sector is anticipated to increase at a quick rate during the projection period. Manufacturers benefit from market technology at various stages of the product development process. Applications include predicting maintenance problems and executing sophisticated design simulations.
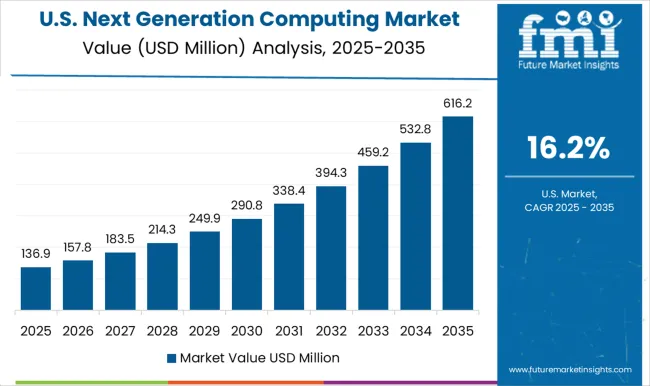
The United States is a leading market with an expected CAGR of 7.2% by 2035 due to its early adoption of modern data-storage technologies. Both consumers and multinational corporations are heavily concentrated in the United States.
Hyperscale data centers have also proliferated quickly, and they are mostly employed by cloud computing providers and social network service providers. The United States market is anticipated to be primarily driven by the rising demand for cloud computing services.
A cost-effective and efficient way to access and store data, as well as scale up computing resources as necessary, is provided by cloud computing for businesses. An increasing number of businesses are considering moving their data and apps to the cloud to have great market share by 2035.
The United Kingdom was expanding with a market size of USD 193.6 billion in 2025. It is expected to increase at a CAGR of 8.2% by 2035.
Due to its well-established IT infrastructure, robust digital ecosystem, and top-tier talent pool, the United Kingdom is well-positioned to benefit from this growth. Additionally, the United Kingdom government has made large investments in the digital sector through programs like the Digital Economy Act and the Digital Britain agenda.
The rising need for cloud computing services, big data analytics, and artificial intelligence is what fuels the adoption. The need for businesses to cut costs and increase efficiency, the growing use of digital technology, and the introduction of blockchain, encourages global sales.
The next generation computing sector is likely to expand, with a share of USD 193.6 billion in 2025, due to India's growing AI and machine learning industries. Systems that are highly effective and intelligent are developed using AI and machine learning technology.
To automate procedures and enhance decision-making, these technologies are used in many Indian sectors. The adoption of next generation computer technologies is another area of priority for the Indian government.
To encourage the expansion of the digital economy, the government has created a number of programs, including Startup India, Make in India, and Digital India.
Due to government backing, the next generation computing industry is predicted to grow, with a share of USD 233.3 billion in 2025. The government in China has also started a number of initiatives to encourage the development of cutting-edge computer technology.
This includes the establishment of specialized funds and the provision of tax advantages to companies engaged in the industry. These programs encourage innovation and increase the ability of companies in China to compete globally.
The market is expected to experience intense rivalry due to various foreign companies, such as Microsoft, IBM, and Huawei, who are striving for market supremacy. Huawei Cloud is a cloud computing service provider that specializes in providing business cloud services. It is the sole Chinese cloud provider and one of the top five cloud service providers worldwide.
Among the services offered by Huawei Cloud are public, private, hybrid, and edge clouds. However, it is projected that regional rivals like Lenovo, Baidu, and Alibaba would continue to be aggressive.
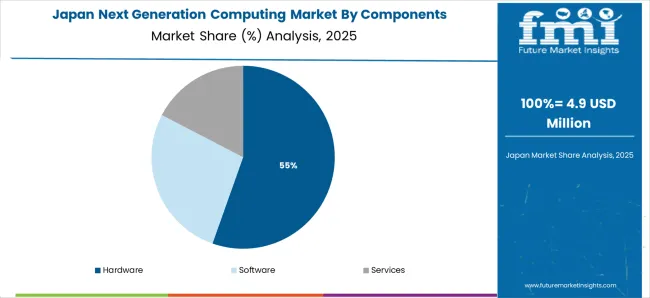
From 2025 to 2035, the Japan market for next generation computing is anticipated to expand at a CAGR of 5.4%. The market is expanding due to the rising demand for high-performance computing (HPC) and data-driven applications.
The Japan government's initiatives to promote the development of next generation computer technologies and the rising acceptance of advanced technology are both contributing to the market's growth.
The demand for better computing performance, access to bigger data sets, and complex analytics is fueling the expansion of the next generation computing start-ups. Start-ups are starting to emerge with innovative solutions that help organizations become nimble, efficient, and competitive as corporations look to exploit the recent advancements.
Government subsidies, venture capital investments, and corporate alliances all contribute to the expansion of these start-ups. Startups are investigating quantum computing, a novel form of computation that makes use of quantum-mechanical events to process data and address challenging issues. The vendors of next generation computing could benefit financially from this.
The next generation computing market is led by major cloud, semiconductor, and enterprise technology companies advancing high-performance computing (HPC), quantum computing, and AI-driven data infrastructure. Amazon Web Services Inc. (AWS) dominates through scalable cloud-based computing platforms integrating AI accelerators and machine learning frameworks that support next-gen workloads in analytics, simulation, and automation. IBM Corporation focuses on hybrid quantum computing systems and advanced AI computing architectures that bridge classical and quantum environments for enterprise applications.
Google LLC advances quantum computing with its Sycamore processor and develops AI-optimized cloud infrastructure for scientific and industrial computing. Microsoft Corporation enhances its Azure ecosystem with quantum simulators, edge computing integration, and HPC solutions supporting global enterprise deployment. Intel Corporation leads in processor innovation, providing neuromorphic and quantum-ready architectures designed for next-generation parallel computing performance.
Hewlett Packard Enterprise (HPE) and Cisco Systems Inc. deliver data center and edge computing systems integrating advanced networking and energy-efficient designs for hybrid computing models. Alibaba Group Holding Limited expands through its Alibaba Cloud Quantum Development Platform, supporting research and enterprise computing solutions in Asia. Oracle Corporation leverages its cloud infrastructure to optimize computing for analytics, AI, and autonomous data processing. Atos SE focuses on supercomputing and quantum simulation systems, supplying advanced solutions for research institutions and industrial clients.
| Items | Values |
|---|---|
| Quantitative units (2025) | USD 193.6 million |
| Components | Hardware; software; services |
| Offering | Cloud based; on premise |
| Type | High performance computing; quantum computing; brain type computing; approximate and probabilistic computing; energy efficiency computing; thermodynamic computing; memory based computing; optical computing; others |
| Enterprise | SMEs; large enterprises |
| End-use | BFSI; healthcare; space and defence; energy and power; transportation and logistics; chemicals; academia; government; telecom; others |
| Regions Covered | North America; Latin America; Western Europe; Eastern Europe; Balkan & Baltic; Russia & Belarus; Central Asia; East Asia; South Asia & Pacific; Middle East & Africa |
| Key Countries Covered | United States; China; India; United Kingdom; Germany; Japan; South Korea; Canada; Brazil; Australia |
| Top companies profiled | Amazon Web Services; IBM; Alibaba Group; Cisco Systems; Google; HPE; Intel; Oracle; Atos SE; Microsoft |
| Additional attributes | Dollar sales by component, offering, enterprise type, end use, and region; rapid cloud adoption and hybrid cloud focus; ai and automation integration; data sovereignty and compliance requirements; investments in energy efficient data centers and specialized accelerators |
The global next generation computing market is estimated to be valued at USD 193.6 million in 2025.
The market size for the next generation computing market is projected to reach USD 1,111.6 million by 2035.
The next generation computing market is expected to grow at a 19.1% CAGR between 2025 and 2035.
The key product types in next generation computing market are hardware, software and services.
In terms of offering, cloud based segment to command 63.7% share in the next generation computing market in 2025.


Our Research Products

The "Full Research Suite" delivers actionable market intel, deep dives on markets or technologies, so clients act faster, cut risk, and unlock growth.

The Leaderboard benchmarks and ranks top vendors, classifying them as Established Leaders, Leading Challengers, or Disruptors & Challengers.

Locates where complements amplify value and substitutes erode it, forecasting net impact by horizon

We deliver granular, decision-grade intel: market sizing, 5-year forecasts, pricing, adoption, usage, revenue, and operational KPIs—plus competitor tracking, regulation, and value chains—across 60 countries broadly.

Spot the shifts before they hit your P&L. We track inflection points, adoption curves, pricing moves, and ecosystem plays to show where demand is heading, why it is changing, and what to do next across high-growth markets and disruptive tech

Real-time reads of user behavior. We track shifting priorities, perceptions of today’s and next-gen services, and provider experience, then pace how fast tech moves from trial to adoption, blending buyer, consumer, and channel inputs with social signals (#WhySwitch, #UX).

Partner with our analyst team to build a custom report designed around your business priorities. From analysing market trends to assessing competitors or crafting bespoke datasets, we tailor insights to your needs.
Supplier Intelligence
Discovery & Profiling
Capacity & Footprint
Performance & Risk
Compliance & Governance
Commercial Readiness
Who Supplies Whom
Scorecards & Shortlists
Playbooks & Docs
Category Intelligence
Definition & Scope
Demand & Use Cases
Cost Drivers
Market Structure
Supply Chain Map
Trade & Policy
Operating Norms
Deliverables
Buyer Intelligence
Account Basics
Spend & Scope
Procurement Model
Vendor Requirements
Terms & Policies
Entry Strategy
Pain Points & Triggers
Outputs
Pricing Analysis
Benchmarks
Trends
Should-Cost
Indexation
Landed Cost
Commercial Terms
Deliverables
Brand Analysis
Positioning & Value Prop
Share & Presence
Customer Evidence
Go-to-Market
Digital & Reputation
Compliance & Trust
KPIs & Gaps
Outputs
Full Research Suite comprises of:
Market outlook & trends analysis
Interviews & case studies
Strategic recommendations
Vendor profiles & capabilities analysis
5-year forecasts
8 regions and 60+ country-level data splits
Market segment data splits
12 months of continuous data updates
DELIVERED AS:
PDF EXCEL ONLINE
Next-Gen Digital Cockpit Solution Market Size and Share Forecast Outlook 2025 to 2035
Next-gen Military Avionics Market Size and Share Forecast Outlook 2025 to 2035
Next-Gen Firewall Market Size and Share Forecast Outlook 2025 to 2035
Next Generation Telehealth Market Size and Share Forecast Outlook 2025 to 2035
Next-generation neurofeedback device Market Size and Share Forecast Outlook 2025 to 2035
Next Generation Cancer Diagnostics Market Size and Share Forecast Outlook 2025 to 2035
Next Generation Solar Cell Market Size and Share Forecast Outlook 2025 to 2035
Next-Generation Intrusion Prevention System (NGIPS) Market Size and Share Forecast Outlook 2025 to 2035
Next-Generation Sweeteners Size and Share Forecast Outlook 2025 to 2035
Next Generation Packaging Market Analysis - Size, Share, and Forecast Outlook 2025 to 2035
Next Generation Optical Biometry Devices Market Size and Share Forecast Outlook 2025 to 2035
Next Generation Mass Spectrometer Market Size and Share Forecast Outlook 2025 to 2035
Next Generation Wireless Network Market Size and Share Forecast Outlook 2025 to 2035
Next Generation Network (NGN) Equipment Market Size and Share Forecast Outlook 2025 to 2035
Next Generation Infusion Pump Market Size and Share Forecast Outlook 2025 to 2035
Next Generation Non Volatile Memory Market Size and Share Forecast Outlook 2025 to 2035
Next Generation Molecular Assay Market – Trends & Forecast 2025 to 2035
Next-Generation Biomanufacturing Market - Trends, Innovations & Forecast 2025 to 2035
Next Generation Immunotherapies Market - Innovations & Growth 2025 to 2035
Market Leaders & Share in the Next Generation Packaging Industry

Thank you!
You will receive an email from our Business Development Manager. Please be sure to check your SPAM/JUNK folder too.
Chat With
MaRIA