Reports

- Global Locations -

Headquarters

Future Market Insights, Inc.

Christiana Corporate, 200
Continental Drive, Suite 401,
Newark, Delaware - 19713,
United States

T: +1-845-579-5705

Americas

Future Market Insights, Inc.

616 Corporate Way, Suite 2-9018,
Valley Cottage, NY 10989, United States

T: +1-347-918-3531

MEA

Future Market Insights

1602-6 Jumeirah Bay X2 Tower, Plot No: JLT-PH2-X2A,
Jumeirah Lakes Towers, Dubai,
United Arab Emirates

Europe

Future Market Insights

3rd Floor, 207 Regent Street,
W1B 3HH London
United Kingdom

T: + 44 (0) 20 8123 9659
D: +44 (0) 20 3287 4268

Asia Pacific

Future Market Insights

IndiaLand Global Tech Park, Unit UG-1, Behind Grand HighStreet, Phase 1, Hinjawadi, MH, Pune – 411057, India

Cell Regeneration Medicine Market Outlook (2022-2032)

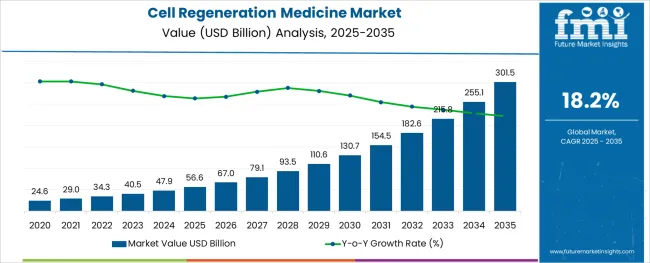
[250 Pages Report] According to Future Market Insights' newly released Cell Regeneration Medicine Market analysis report, the global market valuation stands at US$ 30.3 Bn in 2021 and is expected to be valued at US$ 34.3 Bn by the end of 2022.

The market is expected to rise significantly at a CAGR of 14.4% and the global valuation is expected to be US$ 130.8 Bn by the end of 2032. During the forecasted period (2022-2032), the global market is anticipated to offer an absolute dollar opportunity of US$ 96.5 Bn.

  • The global cell regeneration medicine market is projected to grow significantly in the forecast period, driven by the adoption of stem cell technology, the emergence and application of nanotechnology, and the rise in the prevalence of chronic diseases and trauma emergencies.
  • As a rapidly growing field in medicine, regenerative medicine targets the repair and replacement of damaged organs and tissues and has the potential to treat chronic diseases and disorders, such as Alzheimer's disease, diabetes, and others.
  • Among the most challenging factors that players in this market have to deal with are those associated with the emission standards set by a variety of organizations.

Drivers:

Several key factors are driving the growth of the market around the world, including the growing prevalence of chronic medical illnesses and genetic disorders. Moreover, the aging geriatric population, which is more likely to suffer from musculoskeletal, oncological, dermatological, and cardiological disorders, is contributing to the growth of the market.

Additionally, widespread adoption of organ transplantation is also likely to contribute to the expansion of the market. Regenerative medicine minimizes the possibility of organ rejection by the body after transplantation, as well as improves the patient's recovery speed after transplantation.

Several technological advancements in cell-based therapies, including the development of 3D bioprinting techniques and the adoption of artificial intelligence (AI) in the production of regenerative medicines, have also been instrumental in promoting growth in the field.

In addition, these advancements also facilitate the conduct of dermatological grafting procedures for the treatment of chronic burns, bone defects, and wounds. In addition to these factors, the further improvement of healthcare infrastructure is expected to provide a significant catalyst for the market's growth, as well as extensive research and development (R&D) activities in medical sciences.

Key Market Trends:

There has been an increase in the number of clinical studies being conducted for a better understanding of regenerative medicine for the treatment of a wide range of diseases. This may provide unprecedented growth opportunities for the market. Also, increased investment in the discovery of novel medicines will lead to the development of more effective therapeutic approaches for a range of clinical conditions.

In addition to repairing tissue and defected joints, stem cells and platelet-rich plasma can also be used to boost the body's ability to heal itself. Furthermore, these medicines are also used to treat eye loss and repair the heart, both of which have the advantage of a faster recovery rate.

In the current market, there are also extensive R&D activities being conducted by both commercial and academic players. Aside from the R&D activities being conducted by private players, academic institutions are also involved in a variety of research processes.

Therefore, in the future, several high-tech biotech and MedTech companies are expected to come up, as the result of the current R&D endeavors which is expected to drive the market growth significantly over the forecast period.

Europe Region:

A growing trend in stem cell therapy is being used to treat ischemic heart diseases and ophthalmological disorders. Additionally, shortages of organs for transplantation in several European economies could further promote segment growth.

A market share of around 10% of the French regenerative medicine market is expected to be achieved by 2022. As innovative therapies become more widely adopted in the treatment of chronic diseases, the industry may continue to grow. As a result of the increasing incidence of several chronic diseases in the country, the demand for the product is likely to continue rising.

Additionally, the market is expected to grow as a result of high investments made in the development of healthcare infrastructure, as well as high spending capacity in the healthcare sector. Several government funding programs and reimbursement policies in facilities, along with newly developed product launches in the region, may also contribute to the growth of the market.

Attributes Details
Global Cell Regeneration Medicine Market CAGR (2022 to 2032) 14.4%
Global Cell Regeneration Medicine Market Size (2022) US$ 34.3 Billion
Global Cell Regeneration Medicine Market Size (2032) US$ 130.8 Billion
China Market CAGR (2022 to 2032) 18.2%
Key Companies Covered
  • Abbott
  • Amgen Inc.
  • Astellas Pharma, Inc.
  • AstraZeneca plc
  • Baxter International, Inc.
  • Bayer AG
  • Boehringer Ingelheim
  • Bristol-Myers Squibb
  • Corline Biomedical AB

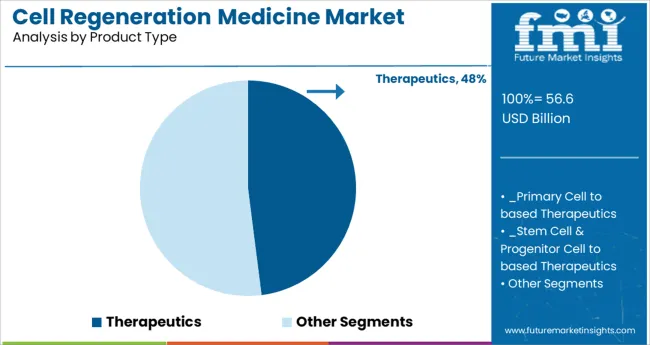
The Therapeutics segment is predicted to be the top product segment in the Cell Regeneration Medicine Market with an expected CAGR of 16.5% for the period between 2022 and 2032. This is significantly higher from the historical CAGR of 14.1% owing to higher adoption of primary cell-based therapies in clinical application and their increased usage in different therapeutic indications.

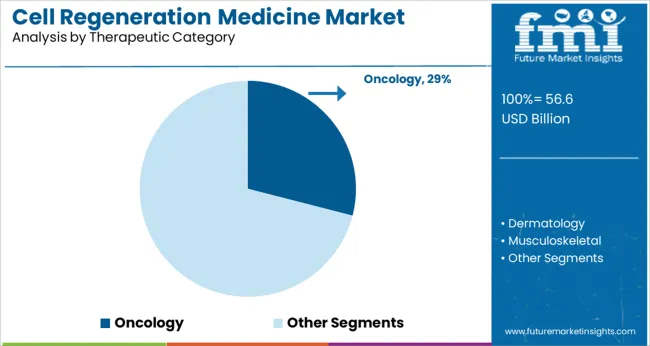
Furthermore, Cell Regeneration Medicine garners highest revenue through the Oncology segment, which accounts for over a quarter share. The market revenue through Oncology segment is expected to experience the CAGR of 13.1% in the therapeutic category as compared to its historical average of 11.4%. The category is expected to rise due to high cancer prevalence, increasing investments in cancer research, development of advanced cell therapies and initiatives to reduce cancer burden.

Don't pay for what you don't need

Customize your report by selecting specific countries or regions and save 30%!

Revenue of Cell Regeneration Medicine Market from 2017 to 2021 Compared to Demand Outlook for 2022 to 2032

As per the publications released by Future Market Insights - market research and competitive intelligence provider, on Cell Regeneration Medicine Market, the market is currently valued at US$ 30.3 Bn in 2021 and is expected to rise at a CAGR of 14.4% during the period between 2022 and 2032.

This growth has been significantly higher than the historical growth of 12.4%. The market is expected to offer an absolute dollar opportunity of US$ 96.5 Bn between 2022 and 2032. By the end of 2032, the global market for Cell Regeneration Medicine is likely to hit the valuation of US$ 130.8 Bn.

The market valuation is projected to grow at a significant CAGR of 14.4% as compared to historical CAGR of 12.4% owing to factors such as introduction of gene therapy, advancements in stem cell and tissue engineering, ongoing funding in R&D by government and commercial entities and continuous regulatory approvals for advanced therapeutic medical products.

  • The Cell Regeneration Medicine Market was valued at US$ 30.3 Bn in 2021 and is expected to reach the valuation of US$ 34.3 Bn by the end of 2022.
  • During 2017-2021, the demand Cell Regeneration Medicine demand grew at a CAGR of 12.4%.
  • By the end of 2032, the global market will reach a valuation of US$ 130.8 Bn by growing at a CAGR of 14.4% between 2022 and 2032.
  • Cell Regeneration Medicine market is projected to grow by 3.8X during the period between 2022 and 2032.
  • The Therapeutics segment dominates the global market for Cell Regeneration Medicines and is expected to remain a dominant segment with a CAGR of 16.5% during the period between 2022 and 2032.
  • The Oncology segment is expected to be the largest revenue grosser throughout the analysis period which is expected to grow at a CAGR of 13.1% during the forecast period.
  • The U.S. market dominates the global market for the Cell Regeneration Medicines with nearly 40% share and is expected to increase at a CAGR of 14.2% during the forecast period.

What Factors are driving the Growth of Cell Regeneration Medicine Market?

Global Cell Regeneration Medicine Market is likely to be driven by the introduction of gene therapy, advancements in stems cells and growth in tissue engineering. Furthermore, various projects like T-Cell therapy, which comes under the manufacturing industry of cell therapy regenerative medicine are being undertaken by any businesses in cooperation with other businesses or research institutions. Furthermore, the government regulatory approvals has led to increase in the market growth.

The global pandemic has provided the global players with various chances to bring medicinal solution to fight against SARS-COV-2. Along with various initiatives, the ongoing investments by government and private sector agencies in R&D has accelerated the industry's advancement. Companies are collaborating to expand their R&D skills to develop and sell innovative therapies to secure a position in a competitive global market.

Researchers' perspectives on Cell Regeneration Medicine have been transformed by technological developments like Nanotechnology, 3D bioprinting techniques and AI in stem cell-based therapeutics. These developments are making dermatological grafting operations like persistent burns, bone abnormalities and skin wounds more efficient.

The market is being driven by the rising frequency of chronic medical conditions and genetic abnormalities such as congestive heart failure, myocardial infarction, Parkinson's disease and various kinds of bone losses. In addition, the growing elderly population suffering from musculoskeletal, oncological and cardiological problems is driving market expansion.

Sabyasachi Ghosh
Sabyasachi Ghosh

Principal Consultant

Talk to Analyst

Find your sweet spots for generating winning opportunities in this market.

What Factors are restraining the Growth of Global Cell Regeneration Medicine Market?

The sales of Cell Regeneration Medicine is likely to be affected by the high cost of therapies. This high cost of treatment acts as a barrier in entering the new market. People in emerging economies are unable to finance organ transplantation due to socioeconomic constraints. Organ trafficking is a serious crime that is in prevalence due to a scarcity of organs.

The developing countries pose to be a potential market with rising rates of chronic diseases, hereditary diseases, rising geriatric population and higher demanding regions for organs and biomaterials. But with little awareness of Cell Regeneration Medicine, these potential markets are difficult to capture.

The gene correction treatment involves nucleases that have been modified to successfully change the human genome. However, the use of gene correction treatment is limited due to some unintended consequences, such as cell manipulation, which has impacted the efficacy of cell formation and proliferation. However, with sufficient capital and financing, R&D is proceeding toward the cost-effective commercialization of such complex medical operations.
Country-wise Analysis

Which Country is the Driving Force for the growth of the Global Cell Regeneration Medicines Market?

In 2021, the United States Accounted for nearly 2/5th share of the global market for Cell Regeneration Medicines. The U.S. market growth is significantly higher from its historical average growth of 11.9%. Between 2022 and 2032, the market is estimated to witness an absolute dollar opportunity of US$ 36.6 Bn.

The presence of significant players in the United States, the availability of modern technologies and increasing financing of research institutes involved in the creation of innovative treatments can all be attributed to this expansion. In addition, the United States has the biggest revenue flow due to a large number of clinical trials, the availability of financing, and various government and private-sector efforts. For example, the US Department of Health and Human Services launched a campaign to place Cell Regeneration Medicine at the forefront of healthcare.

Which Country is expected to grow rapidly in the Global Cell Regeneration Medicines Market?

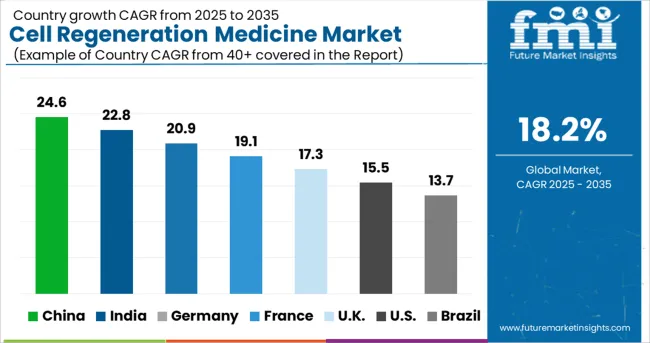
According to Future Market Insights data, the market in China is anticipated to grow at the fastest rate of 18.2% between 2022 and 2032. The projected CAGR of the U.S. is significantly higher than the historical CAGR of 13.7%. In the next ten years, the Chinese market is estimated to offer an absolute dollar opportunity of US$ 14.8 Bn to reach a valuation of US$ 17.8 Bn.

The rising CAGR of the Chinese market for Cell Regeneration Medicines is attributed to the rapid expansion of healthcare infrastructure and research institutes to accelerate stem cell research in a rapidly developing market.

With rising government approvals for research projects involving human embryonic stem cells, scientists are encouraged to investigate the cells' clinical potential. Additionally, the rising prevalence of cardiovascular and musculoskeletal illnesses is driving this trend. Furthermore, the market is likely to be explored by global players targeting the untapped segments of the market.

Get the data you need at a Fraction of the cost

Personalize your report by choosing insights you need
and save 40%!

Category-wise Insights

Which Product Type is gaining the Utmost Traction in Cell Regeneration Medicine Market?

The Therapeutics segment is the largest revenue generating segment in the Global Cell Regeneration Medicine Market, growing at a CAGR of 17.8% during the period between 2022 and 2032.

Despite source diversification, this category is anticipated to maintain its leadership position in the marketplace throughout the projected period. Primary cell-based therapies are the most developed medications available from the medical sector, as they are suitable for use in both clinical applications and approved in different areas.

In addition, the stem cell & progenitor cell-based therapies market is predicted to grow significantly over the forecast years, owing to increased investments in stem cell research and regulatory policy revisions.

Which Therapeutic Category is expected to drive the Growth of Global Cell Regeneration Medicines Market?

Oncology therapeutic category is expected to lead the market with the highest share in global market for Cell Regeneration Medicines. It is forecasted to grow at a CAGR of 13.1% during the period.

This can be attributable to high cancer prevalence globally and the development of efficient cancer treatment options. Furthermore, huge investments by government organizations and private companies to finance cancer research is aiding the growth.
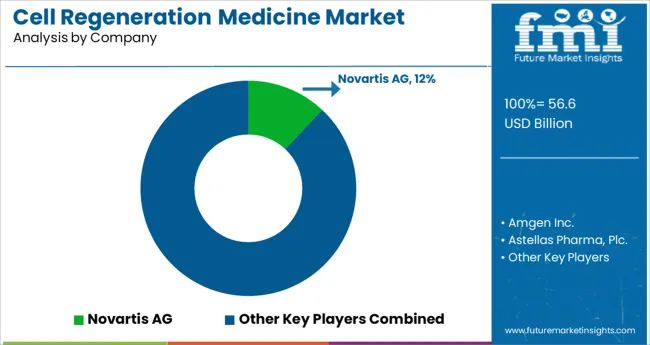
Competitive Analysis

A number of companies invested in the development of cell regenerative medicine to meet demand for clinical needs without resorting to more-invasive procedures. The market is extremely competitive, and players are making joint efforts for product development.

Some of the prominent Cell Regeneration Medicine manufacturers are AstraZeneca plc, Astellas Pharma, Inc., F. Hoffmann-La Roche Ltd., Integra Lifesciences Corp., Cook Biotech, Inc., Bayer AG, Pfizer, Inc., Merck KGaA, Abbott, Vericel Corp., Novartis AG, GlaxoSmithKline (GSK), Baxter International, Inc., Takara Bio, Inc.

The recent developments in the Global Cell Regeneration Medicine Market are:

  • In January 2022, AstraZeneca collaborated with Neurimmune AG and signed the licence agreement for the development of NI006, an antibody to treat patients with advanced ATTR-CM.
  • In October 2021, FDA approved the REGEN-COV on a priority basis for the treatment of Covid 19.

Similarly, recent developments related to companies offering Cell Regeneration Medicine Market have been tracked by the team at Future Market Insights, which are available in the full report.

Cell Regeneration Medicine Market Report Scope

Attributes Details
Forecast Period 2022 to 2032
Historical Data 2017 to 2021
Quantitative Units In US$ Million
Key Regions Covered North America, Latin America, Europe, APAC and MEA
Key Countries Covered United States, China, Japan, South Korea, UK, Canada, Brazil, Mexico, Germany, France, Spain, Italy, Russia, India, Australia, South Africa, Saudi Arabia, UAE, Israel
Key Market Segments Covered Product Type, Therapeutic Category and Region
Pricing Available upon Request

Market Segments Covered in Cell Regeneration Medicine Market Analysis

By Product Type:

  • Therapeutics
    • Primary Cell-based Therapeutics
    • Stem Cell & Progenitor Cell-based Therapeutics
    • Cell-based Immunotherapies
    • Gene Therapies
  • Tools
  • Banks
  • Services

By Therapeutic Category:

  • Dermatology
  • Musculoskeletal
  • Immunology & Inflammation
  • Oncology
  • Cardiovascular
  • Ophthalmology
  • Other Therapeutic Categories

By Region:

  • North America
    • U.S.
    • Canada
  • Latin America
    • Brazil
    • Mexico
    • Others
  • Europe
    • Germany
    • U.K.
    • France
    • Spain
    • Italy
    • Russia
    • Others
  • APAC
    • India
    • China
    • Japan
    • South Korea
    • Australia
    • Others
  • MEA
    • South Africa
    • Saudi Arabia
    • UAE
    • Israel
    • Others

Frequently Asked Questions

What is the Growth Outlook for Cell Regeneration Medicine Market?

The market is likely to register a CAGR of 14.4% through 2032.

What is the Current Valuation of the Cell Regeneration Medicine Market?

The market is currently valued at US$ 34.3 Bn in 2022.

How is the Future of the Cell Regeneration Medicine Market?

The market is likely to grow to a valuation of US$ 130.8 Bn by 2032.

Which is the Leading Region in the Market?

North America is likely to be a leading market during the forecast period.

Table of Content

1. Executive Summary

    1.1. Global Market Outlook

    1.2. Demand-side Trends

    1.3. Supply-side Trends

    1.4. Technology Roadmap Analysis

    1.5. Analysis and Recommendations

2. Market Overview

    2.1. Market Coverage / Taxonomy

    2.2. Market Definition / Scope / Limitations

3. Market Background

    3.1. Market Dynamics

        3.1.1. Drivers

        3.1.2. Restraints

        3.1.3. Opportunity

        3.1.4. Trends

    3.2. Scenario Forecast

        3.2.1. Demand in Optimistic Scenario

        3.2.2. Demand in Likely Scenario

        3.2.3. Demand in Conservative Scenario

    3.3. Opportunity Map Analysis

    3.4. Investment Feasibility Matrix

    3.5. PESTLE and Porter’s Analysis

    3.6. Regulatory Landscape

        3.6.1. By Key Regions

        3.6.2. By Key Countries

4. Global Market Analysis 2017-2021 and Forecast, 2022-2032

    4.1. Historical Market Size Value (US$ Mn) Analysis, 2017-2021

    4.2. Current and Future Market Size Value (US$ Mn) Projections, 2022-2032

        4.2.1. Y-o-Y Growth Trend Analysis

        4.2.2. Absolute $ Opportunity Analysis

5. Global Market Analysis 2017-2021 and Forecast 2022-2032, By Product Type

    5.1. Introduction / Key Findings

    5.2. Historical Market Size Value (US$ Mn) Analysis By Product Type, 2017-2021

    5.3. Current and Future Market Size Value (US$ Mn) Analysis and Forecast By Product Type, 2022-2032

        5.3.1. Therapeutics

            5.3.1.1. Primary Cell-based Therapeutics

            5.3.1.2. Stem Cell & Progenitor Cell-based Therapeutics

            5.3.1.3. Cell-based Immunotherapies

            5.3.1.4. Gene Therapies

        5.3.2. Tools

        5.3.3. Banks

        5.3.4. Services

    5.4. Y-o-Y Growth Trend Analysis By Product Type, 2017-2021

    5.5. Absolute $ Opportunity Analysis By Product Type, 2022-2032

6. Global Market Analysis 2017-2021 and Forecast 2022-2032, By Therapeutic Category

    6.1. Introduction / Key Findings

    6.2. Historical Market Size Value (US$ Mn) Analysis By Therapeutic Category, 2017-2021

    6.3. Current and Future Market Size Value (US$ Mn) Analysis and Forecast By Therapeutic Category, 2022-2032

        6.3.1. Dermatology

        6.3.2. Musculoskeletal

        6.3.3. Immunology & Inflammation

        6.3.4. Oncology

        6.3.5. Cardiovascular

        6.3.6. Ophthalmology

        6.3.7. Other Therapeutic Categories

    6.4. Y-o-Y Growth Trend Analysis By Therapeutic Category, 2017-2021

    6.5. Absolute $ Opportunity Analysis By Therapeutic Category, 2022-2032

7. Global Market Analysis 2017-2021 and Forecast 2022-2032, By Region

    7.1. Introduction

    7.2. Historical Market Size Value (US$ Mn) Analysis By Region, 2017-2021

    7.3. Current Market Size Value (US$ Mn) Analysis and Forecast By Region, 2022-2032

        7.3.1. North America

        7.3.2. Latin America

        7.3.3. Europe

        7.3.4. Asia Pacific

        7.3.5. MEA

    7.4. Market Attractiveness Analysis By Region

8. North America Market Analysis 2017-2021 and Forecast 2022-2032, By Country

    8.1. Historical Market Size Value (US$ Mn) Trend Analysis By Market Taxonomy, 2017-2021

    8.2. Market Size Value (US$ Mn) Forecast By Market Taxonomy, 2022-2032

        8.2.1. By Country

            8.2.1.1. U.S.

            8.2.1.2. Canada

        8.2.2. By Product Type

        8.2.3. By Therapeutic Category

    8.3. Market Attractiveness Analysis

        8.3.1. By Country

        8.3.2. By Product Type

        8.3.3. By Therapeutic Category

    8.4. Key Takeaways

9. Latin America Market Analysis 2017-2021 and Forecast 2022-2032, By Country

    9.1. Historical Market Size Value (US$ Mn) Trend Analysis By Market Taxonomy, 2017-2021

    9.2. Market Size Value (US$ Mn) Forecast By Market Taxonomy, 2022-2032

        9.2.1. By Country

            9.2.1.1. Brazil

            9.2.1.2. Mexico

            9.2.1.3. Rest of Latin America

        9.2.2. By Product Type

        9.2.3. By Therapeutic Category

    9.3. Market Attractiveness Analysis

        9.3.1. By Country

        9.3.2. By Product Type

        9.3.3. By Therapeutic Category

    9.4. Key Takeaways

10. Europe Market Analysis 2017-2021 and Forecast 2022-2032, By Country

    10.1. Historical Market Size Value (US$ Mn) Trend Analysis By Market Taxonomy, 2017-2021

    10.2. Market Size Value (US$ Mn) Forecast By Market Taxonomy, 2022-2032

        10.2.1. By Country

            10.2.1.1. Germany

            10.2.1.2. Italy

            10.2.1.3. France

            10.2.1.4. U.K.

            10.2.1.5. Spain

            10.2.1.6. Russia

            10.2.1.7. BENELUX

            10.2.1.8. Rest of Europe

        10.2.2. By Product Type

        10.2.3. By Therapeutic Category

    10.3. Market Attractiveness Analysis

        10.3.1. By Country

        10.3.2. By Product Type

        10.3.3. By Therapeutic Category

    10.4. Key Takeaways

11. Asia Pacific Market Analysis 2017-2021 and Forecast 2022-2032, By Country

    11.1. Historical Market Size Value (US$ Mn) Trend Analysis By Market Taxonomy, 2017-2021

    11.2. Market Size Value (US$ Mn) Forecast By Market Taxonomy, 2022-2032

        11.2.1. By Country

            11.2.1.1. China

            11.2.1.2. Japan

            11.2.1.3. South Korea

            11.2.1.4. India

            11.2.1.5. Rest of Asia Pacific

        11.2.2. By Product Type

        11.2.3. By Therapeutic Category

    11.3. Market Attractiveness Analysis

        11.3.1. By Country

        11.3.2. By Product Type

        11.3.3. By Therapeutic Category

    11.4. Key Takeaways

12. MEA Market Analysis 2017-2021 and Forecast 2022-2032, By Country

    12.1. Historical Market Size Value (US$ Mn) Trend Analysis By Market Taxonomy, 2017-2021

    12.2. Market Size Value (US$ Mn) Forecast By Market Taxonomy, 2022-2032

        12.2.1. By Country

            12.2.1.1. GCC

            12.2.1.2. Rest of MEA

        12.2.2. By Product Type

        12.2.3. By Therapeutic Category

    12.3. Market Attractiveness Analysis

        12.3.1. By Country

        12.3.2. By Product Type

        12.3.3. By Therapeutic Category

    12.4. Key Takeaways

13. Key Countries Market Analysis

    13.1. U.S.

        13.1.1. Pricing Analysis

        13.1.2. Market Share Analysis, 2021

            13.1.2.1. By Product Type

            13.1.2.2. By Therapeutic Category

    13.2. Canada

        13.2.1. Pricing Analysis

        13.2.2. Market Share Analysis, 2021

            13.2.2.1. By Product Type

            13.2.2.2. By Therapeutic Category

    13.3. Brazil

        13.3.1. Pricing Analysis

        13.3.2. Market Share Analysis, 2021

            13.3.2.1. By Product Type

            13.3.2.2. By Therapeutic Category

    13.4. Mexico

        13.4.1. Pricing Analysis

        13.4.2. Market Share Analysis, 2021

            13.4.2.1. By Product Type

            13.4.2.2. By Therapeutic Category

    13.5. Argentina

        13.5.1. Pricing Analysis

        13.5.2. Market Share Analysis, 2021

            13.5.2.1. By Product Type

            13.5.2.2. By Therapeutic Category

    13.6. Germany

        13.6.1. Pricing Analysis

        13.6.2. Market Share Analysis, 2021

            13.6.2.1. By Product Type

            13.6.2.2. By Therapeutic Category

    13.7. Italy

        13.7.1. Pricing Analysis

        13.7.2. Market Share Analysis, 2021

            13.7.2.1. By Product Type

            13.7.2.2. By Therapeutic Category

    13.8. France

        13.8.1. Pricing Analysis

        13.8.2. Market Share Analysis, 2021

            13.8.2.1. By Product Type

            13.8.2.2. By Therapeutic Category

    13.9. U.K.

        13.9.1. Pricing Analysis

        13.9.2. Market Share Analysis, 2021

            13.9.2.1. By Product Type

            13.9.2.2. By Therapeutic Category

    13.10. Spain

        13.10.1. Pricing Analysis

        13.10.2. Market Share Analysis, 2021

            13.10.2.1. By Product Type

            13.10.2.2. By Therapeutic Category

    13.11. Russia

        13.11.1. Pricing Analysis

        13.11.2. Market Share Analysis, 2021

            13.11.2.1. By Product Type

            13.11.2.2. By Therapeutic Category

    13.12. BENELUX

        13.12.1. Pricing Analysis

        13.12.2. Market Share Analysis, 2021

            13.12.2.1. By Product Type

            13.12.2.2. By Therapeutic Category

    13.13. China

        13.13.1. Pricing Analysis

        13.13.2. Market Share Analysis, 2021

            13.13.2.1. By Product Type

            13.13.2.2. By Therapeutic Category

    13.14. Japan

        13.14.1. Pricing Analysis

        13.14.2. Market Share Analysis, 2021

            13.14.2.1. By Product Type

            13.14.2.2. By Therapeutic Category

    13.15. South Korea

        13.15.1. Pricing Analysis

        13.15.2. Market Share Analysis, 2021

            13.15.2.1. By Product Type

            13.15.2.2. By Therapeutic Category

    13.16. India

        13.16.1. Pricing Analysis

        13.16.2. Market Share Analysis, 2021

            13.16.2.1. By Product Type

            13.16.2.2. By Therapeutic Category

    13.17. GCC Countries

        13.17.1. Pricing Analysis

        13.17.2. Market Share Analysis, 2021

            13.17.2.1. By Product Type

            13.17.2.2. By Therapeutic Category

14. Market Structure Analysis

    14.1. Competition Dashboard

    14.2. Competition Benchmarking

    14.3. Market Share Analysis of Top Players

        14.3.1. By Regional

        14.3.2. By Product Type

        14.3.3. By Therapeutic Category

15. Competition Analysis

    15.1. Competition Deep Dive

        15.1.1. Abbott

            15.1.1.1. Overview

            15.1.1.2. Product Portfolio

            15.1.1.3. Profitability by Market Segment

            15.1.1.4. Sales Footprint

            15.1.1.5. Strategy Overview

                15.1.1.5.1. Marketing Strategy

        15.1.2. Amgen Inc.

            15.1.2.1. Overview

            15.1.2.2. Product Portfolio

            15.1.2.3. Profitability by Market Segment

            15.1.2.4. Sales Footprint

            15.1.2.5. Strategy Overview

                15.1.2.5.1. Marketing Strategy

        15.1.3. Astellas Pharma, Plc.

            15.1.3.1. Overview

            15.1.3.2. Product Portfolio

            15.1.3.3. Profitability by Market Segment

            15.1.3.4. Sales Footprint

            15.1.3.5. Strategy Overview

                15.1.3.5.1. Marketing Strategy

        15.1.4. AstraZeneca Plc

            15.1.4.1. Overview

            15.1.4.2. Product Portfolio

            15.1.4.3. Profitability by Market Segment

            15.1.4.4. Sales Footprint

            15.1.4.5. Strategy Overview

                15.1.4.5.1. Marketing Strategy

        15.1.5. Baxter International, Inc.

            15.1.5.1. Overview

            15.1.5.2. Product Portfolio

            15.1.5.3. Profitability by Market Segment

            15.1.5.4. Sales Footprint

            15.1.5.5. Strategy Overview

                15.1.5.5.1. Marketing Strategy

        15.1.6. Bayer AG

            15.1.6.1. Overview

            15.1.6.2. Product Portfolio

            15.1.6.3. Profitability by Market Segment

            15.1.6.4. Sales Footprint

            15.1.6.5. Strategy Overview

                15.1.6.5.1. Marketing Strategy

        15.1.7. Boehringer Ingelheim

            15.1.7.1. Overview

            15.1.7.2. Product Portfolio

            15.1.7.3. Profitability by Market Segment

            15.1.7.4. Sales Footprint

            15.1.7.5. Strategy Overview

                15.1.7.5.1. Marketing Strategy

        15.1.8. Bristol-Myers Squibb

            15.1.8.1. Overview

            15.1.8.2. Product Portfolio

            15.1.8.3. Profitability by Market Segment

            15.1.8.4. Sales Footprint

            15.1.8.5. Strategy Overview

                15.1.8.5.1. Marketing Strategy

        15.1.9. Corline Biomedical AB

            15.1.9.1. Overview

            15.1.9.2. Product Portfolio

            15.1.9.3. Profitability by Market Segment

            15.1.9.4. Sales Footprint

            15.1.9.5. Strategy Overview

                15.1.9.5.1. Marketing Strategy

        15.1.10. Cesca Therapeutics, Inc.

            15.1.10.1. Overview

            15.1.10.2. Product Portfolio

            15.1.10.3. Profitability by Market Segment

            15.1.10.4. Sales Footprint

            15.1.10.5. Strategy Overview

                15.1.10.5.1. Marketing Strategy

        15.1.11. Cook Biotech, Inc.

            15.1.11.1. Overview

            15.1.11.2. Product Portfolio

            15.1.11.3. Profitability by Market Segment

            15.1.11.4. Sales Footprint

            15.1.11.5. Strategy Overview

                15.1.11.5.1. Marketing Strategy

        15.1.12. Eli Lily and Company

            15.1.12.1. Overview

            15.1.12.2. Product Portfolio

            15.1.12.3. Profitability by Market Segment

            15.1.12.4. Sales Footprint

            15.1.12.5. Strategy Overview

                15.1.12.5.1. Marketing Strategy

        15.1.13. F. Hoffman-La Roche Ltd.

            15.1.13.1. Overview

            15.1.13.2. Product Portfolio

            15.1.13.3. Profitability by Market Segment

            15.1.13.4. Sales Footprint

            15.1.13.5. Strategy Overview

                15.1.13.5.1. Marketing Strategy

        15.1.14. GlaxoSmithKline

            15.1.14.1. Overview

            15.1.14.2. Product Portfolio

            15.1.14.3. Profitability by Market Segment

            15.1.14.4. Sales Footprint

            15.1.14.5. Strategy Overview

                15.1.14.5.1. Marketing Strategy

        15.1.15. Integra Lifesciences Corp.

            15.1.15.1. Overview

            15.1.15.2. Product Portfolio

            15.1.15.3. Profitability by Market Segment

            15.1.15.4. Sales Footprint

            15.1.15.5. Strategy Overview

                15.1.15.5.1. Marketing Strategy

        15.1.16. Merck KGaA

            15.1.16.1. Overview

            15.1.16.2. Product Portfolio

            15.1.16.3. Profitability by Market Segment

            15.1.16.4. Sales Footprint

            15.1.16.5. Strategy Overview

                15.1.16.5.1. Marketing Strategy

        15.1.17. MiMedx Group, Inc.

            15.1.17.1. Overview

            15.1.17.2. Product Portfolio

            15.1.17.3. Profitability by Market Segment

            15.1.17.4. Sales Footprint

            15.1.17.5. Strategy Overview

                15.1.17.5.1. Marketing Strategy

        15.1.18. Novartis AG

            15.1.18.1. Overview

            15.1.18.2. Product Portfolio

            15.1.18.3. Profitability by Market Segment

            15.1.18.4. Sales Footprint

            15.1.18.5. Strategy Overview

                15.1.18.5.1. Marketing Strategy

        15.1.19. NuVasive, Inc.

            15.1.19.1. Overview

            15.1.19.2. Product Portfolio

            15.1.19.3. Profitability by Market Segment

            15.1.19.4. Sales Footprint

            15.1.19.5. Strategy Overview

                15.1.19.5.1. Marketing Strategy

        15.1.20. Organogenesis, Inc.

            15.1.20.1. Overview

            15.1.20.2. Product Portfolio

            15.1.20.3. Profitability by Market Segment

            15.1.20.4. Sales Footprint

            15.1.20.5. Strategy Overview

                15.1.20.5.1. Marketing Strategy

16. Assumptions & Acronyms Used

17. Research Methodology

Don't pay for what you don't need

Customize your report by selecting specific countries or regions and save 30%!

List of Tables

Table 1: Global Market Value (US$ Mn) Forecast by Region, 2017-2032

Table 2: Global Market Value (US$ Mn) Forecast by Product Type, 2017-2032

Table 3: Global Market Value (US$ Mn) Forecast by Therapeutic Category, 2017-2032

Table 4: North America Market Value (US$ Mn) Forecast by Country, 2017-2032

Table 5: North America Market Value (US$ Mn) Forecast by Product Type, 2017-2032

Table 6: North America Market Value (US$ Mn) Forecast by Therapeutic Category, 2017-2032

Table 7: Latin America Market Value (US$ Mn) Forecast by Country, 2017-2032

Table 8: Latin America Market Value (US$ Mn) Forecast by Product Type, 2017-2032

Table 9: Latin America Market Value (US$ Mn) Forecast by Therapeutic Category, 2017-2032

Table 10: Europe Market Value (US$ Mn) Forecast by Country, 2017-2032

Table 11: Europe Market Value (US$ Mn) Forecast by Product Type, 2017-2032

Table 12: Europe Market Value (US$ Mn) Forecast by Therapeutic Category, 2017-2032

Table 13: Asia Pacific Market Value (US$ Mn) Forecast by Country, 2017-2032

Table 14: Asia Pacific Market Value (US$ Mn) Forecast by Product Type, 2017-2032

Table 15: Asia Pacific Market Value (US$ Mn) Forecast by Therapeutic Category, 2017-2032

Table 16: MEA Market Value (US$ Mn) Forecast by Country, 2017-2032

Table 17: MEA Market Value (US$ Mn) Forecast by Product Type, 2017-2032

Table 18: MEA Market Value (US$ Mn) Forecast by Therapeutic Category, 2017-2032
Sabyasachi Ghosh
Sabyasachi Ghosh

Principal Consultant

Talk to Analyst

Find your sweet spots for generating winning opportunities in this market.

List of Charts

Figure 1: Global Market Value (US$ Mn) by Product Type, 2022-2032

Figure 2: Global Market Value (US$ Mn) by Therapeutic Category, 2022-2032

Figure 3: Global Market Value (US$ Mn) by Region, 2022-2032

Figure 4: Global Market Value (US$ Mn) Analysis by Region, 2017-2032

Figure 5: Global Market Value Share (%) and BPS Analysis by Region, 2022-2032

Figure 6: Global Market Y-o-Y Growth (%) Projections by Region, 2022-2032

Figure 7: Global Market Value (US$ Mn) Analysis by Product Type, 2017-2032

Figure 8: Global Market Value Share (%) and BPS Analysis by Product Type, 2022-2032

Figure 9: Global Market Y-o-Y Growth (%) Projections by Product Type, 2022-2032

Figure 10: Global Market Value (US$ Mn) Analysis by Therapeutic Category, 2017-2032

Figure 11: Global Market Value Share (%) and BPS Analysis by Therapeutic Category, 2022-2032

Figure 12: Global Market Y-o-Y Growth (%) Projections by Therapeutic Category, 2022-2032

Figure 13: Global Market Attractiveness by Product Type, 2022-2032

Figure 14: Global Market Attractiveness by Therapeutic Category, 2022-2032

Figure 15: Global Market Attractiveness by Region, 2022-2032

Figure 16: North America Market Value (US$ Mn) by Product Type, 2022-2032

Figure 17: North America Market Value (US$ Mn) by Therapeutic Category, 2022-2032

Figure 18: North America Market Value (US$ Mn) by Country, 2022-2032

Figure 19: North America Market Value (US$ Mn) Analysis by Country, 2017-2032

Figure 20: North America Market Value Share (%) and BPS Analysis by Country, 2022-2032

Figure 21: North America Market Y-o-Y Growth (%) Projections by Country, 2022-2032

Figure 22: North America Market Value (US$ Mn) Analysis by Product Type, 2017-2032

Figure 23: North America Market Value Share (%) and BPS Analysis by Product Type, 2022-2032

Figure 24: North America Market Y-o-Y Growth (%) Projections by Product Type, 2022-2032

Figure 25: North America Market Value (US$ Mn) Analysis by Therapeutic Category, 2017-2032

Figure 26: North America Market Value Share (%) and BPS Analysis by Therapeutic Category, 2022-2032

Figure 27: North America Market Y-o-Y Growth (%) Projections by Therapeutic Category, 2022-2032

Figure 28: North America Market Attractiveness by Product Type, 2022-2032

Figure 29: North America Market Attractiveness by Therapeutic Category, 2022-2032

Figure 30: North America Market Attractiveness by Country, 2022-2032

Figure 31: Latin America Market Value (US$ Mn) by Product Type, 2022-2032

Figure 32: Latin America Market Value (US$ Mn) by Therapeutic Category, 2022-2032

Figure 33: Latin America Market Value (US$ Mn) by Country, 2022-2032

Figure 34: Latin America Market Value (US$ Mn) Analysis by Country, 2017-2032

Figure 35: Latin America Market Value Share (%) and BPS Analysis by Country, 2022-2032

Figure 36: Latin America Market Y-o-Y Growth (%) Projections by Country, 2022-2032

Figure 37: Latin America Market Value (US$ Mn) Analysis by Product Type, 2017-2032

Figure 38: Latin America Market Value Share (%) and BPS Analysis by Product Type, 2022-2032

Figure 39: Latin America Market Y-o-Y Growth (%) Projections by Product Type, 2022-2032

Figure 40: Latin America Market Value (US$ Mn) Analysis by Therapeutic Category, 2017-2032

Figure 41: Latin America Market Value Share (%) and BPS Analysis by Therapeutic Category, 2022-2032

Figure 42: Latin America Market Y-o-Y Growth (%) Projections by Therapeutic Category, 2022-2032

Figure 43: Latin America Market Attractiveness by Product Type, 2022-2032

Figure 44: Latin America Market Attractiveness by Therapeutic Category, 2022-2032

Figure 45: Latin America Market Attractiveness by Country, 2022-2032

Figure 46: Europe Market Value (US$ Mn) by Product Type, 2022-2032

Figure 47: Europe Market Value (US$ Mn) by Therapeutic Category, 2022-2032

Figure 48: Europe Market Value (US$ Mn) by Country, 2022-2032

Figure 49: Europe Market Value (US$ Mn) Analysis by Country, 2017-2032

Figure 50: Europe Market Value Share (%) and BPS Analysis by Country, 2022-2032

Figure 51: Europe Market Y-o-Y Growth (%) Projections by Country, 2022-2032

Figure 52: Europe Market Value (US$ Mn) Analysis by Product Type, 2017-2032

Figure 53: Europe Market Value Share (%) and BPS Analysis by Product Type, 2022-2032

Figure 54: Europe Market Y-o-Y Growth (%) Projections by Product Type, 2022-2032

Figure 55: Europe Market Value (US$ Mn) Analysis by Therapeutic Category, 2017-2032

Figure 56: Europe Market Value Share (%) and BPS Analysis by Therapeutic Category, 2022-2032

Figure 57: Europe Market Y-o-Y Growth (%) Projections by Therapeutic Category, 2022-2032

Figure 58: Europe Market Attractiveness by Product Type, 2022-2032

Figure 59: Europe Market Attractiveness by Therapeutic Category, 2022-2032

Figure 60: Europe Market Attractiveness by Country, 2022-2032

Figure 61: Asia Pacific Market Value (US$ Mn) by Product Type, 2022-2032

Figure 62: Asia Pacific Market Value (US$ Mn) by Therapeutic Category, 2022-2032

Figure 63: Asia Pacific Market Value (US$ Mn) by Country, 2022-2032

Figure 64: Asia Pacific Market Value (US$ Mn) Analysis by Country, 2017-2032

Figure 65: Asia Pacific Market Value Share (%) and BPS Analysis by Country, 2022-2032

Figure 66: Asia Pacific Market Y-o-Y Growth (%) Projections by Country, 2022-2032

Figure 67: Asia Pacific Market Value (US$ Mn) Analysis by Product Type, 2017-2032

Figure 68: Asia Pacific Market Value Share (%) and BPS Analysis by Product Type, 2022-2032

Figure 69: Asia Pacific Market Y-o-Y Growth (%) Projections by Product Type, 2022-2032

Figure 70: Asia Pacific Market Value (US$ Mn) Analysis by Therapeutic Category, 2017-2032

Figure 71: Asia Pacific Market Value Share (%) and BPS Analysis by Therapeutic Category, 2022-2032

Figure 72: Asia Pacific Market Y-o-Y Growth (%) Projections by Therapeutic Category, 2022-2032

Figure 73: Asia Pacific Market Attractiveness by Product Type, 2022-2032

Figure 74: Asia Pacific Market Attractiveness by Therapeutic Category, 2022-2032

Figure 75: Asia Pacific Market Attractiveness by Country, 2022-2032

Figure 76: MEA Market Value (US$ Mn) by Product Type, 2022-2032

Figure 77: MEA Market Value (US$ Mn) by Therapeutic Category, 2022-2032

Figure 78: MEA Market Value (US$ Mn) by Country, 2022-2032

Figure 79: MEA Market Value (US$ Mn) Analysis by Country, 2017-2032

Figure 80: MEA Market Value Share (%) and BPS Analysis by Country, 2022-2032

Figure 81: MEA Market Y-o-Y Growth (%) Projections by Country, 2022-2032

Figure 82: MEA Market Value (US$ Mn) Analysis by Product Type, 2017-2032

Figure 83: MEA Market Value Share (%) and BPS Analysis by Product Type, 2022-2032

Figure 84: MEA Market Y-o-Y Growth (%) Projections by Product Type, 2022-2032

Figure 85: MEA Market Value (US$ Mn) Analysis by Therapeutic Category, 2017-2032

Figure 86: MEA Market Value Share (%) and BPS Analysis by Therapeutic Category, 2022-2032

Figure 87: MEA Market Y-o-Y Growth (%) Projections by Therapeutic Category, 2022-2032

Figure 88: MEA Market Attractiveness by Product Type, 2022-2032

Figure 89: MEA Market Attractiveness by Therapeutic Category, 2022-2032

Figure 90: MEA Market Attractiveness by Country, 2022-2032

Recommendations

Healthcare

Stem Cell Therapy Market

Published : March 2024

Healthcare

Cell Culture Incubator Market

Published : July 2023

Healthcare

Cell Line Development Services Market

Published : July 2023

Explore Healthcare Insights

View Reports

Cell Regeneration Medicine Market