The global cellulose derivative market is projected to grow from USD 6,776.6 million in 2025 to approximately USD 11,466.2 million by 2035, recording an absolute increase of USD 4,689.6 million over the forecast period. This translates into a total growth of 69.2%, with the market forecast to expand at a compound annual growth rate (CAGR) of 5.4% between 2025 and 2035. The overall market size is expected to grow by nearly 1.7X during the same period, supported by increasing demand for sustainable bio-based materials, rising adoption in pharmaceutical formulations, and increasing focus on eco-friendly industrial solutions for specialized applications across the global food, pharmaceutical, and construction manufacturing sectors.
Between 2020 and 2025, the cellulose derivative market experienced steady expansion, driven by increasing recognition of bio-based materials' importance in industrial operations and growing acceptance of specialized polymer solutions in complex formulation processes. The market developed as manufacturers recognized the need for high-performance sustainable materials to address stringent environmental requirements and improve overall product quality outcomes. Research and development activities have begun to emphasize the importance of advanced cellulose derivative technologies in achieving better efficiency and sustainability in industrial manufacturing processes.
Between 2025 and 2030, the cellulose derivative market is projected to expand from USD 6,776.6 million to USD 8,814.8 million, resulting in a value increase of USD 2,038.2 million, which represents 43.5% of the total forecast growth for the decade. This phase of development will be shaped by rising demand for bio-based materials, increasing applications in pharmaceutical and food industries, and growing penetration in emerging industrial markets. Chemical manufacturers are expanding their cellulose derivative production capabilities to address the growing demand for specialized polymer systems in various industrial applications and formulation processes.
From 2030 to 2035, the market is forecast to grow from USD 8,814.8 million to USD 11,466.2 million, adding another USD 2,651.4 million, which constitutes 56.5% of the overall ten-year expansion. This period is expected to be characterized by the expansion of specialized bio-polymer manufacturing facilities, the integration of advanced processing technologies, and the development of customized cellulose derivatives for specific industrial applications. The growing adoption of sustainability standards and environmental requirements will drive demand for ultra-high purity cellulose derivatives with enhanced performance specifications and consistent quality characteristics.
Manufacturing constraints in food-grade cellulose derivative operations demonstrate cross-functional coordination difficulties between process engineering teams optimizing etherification reaction conditions and quality control departments ensuring compliance with specific migration limit requirements. Process engineers develop efficient alkalization and etherification processes to maximize degree of substitution while controlling molecular weight distribution, while quality teams enforce analytical testing protocols that may require specialized equipment for migration testing under food simulant conditions. These competing requirements create operational bottlenecks when pharmaceutical applications demand higher purity grades requiring additional purification steps during production campaigns.
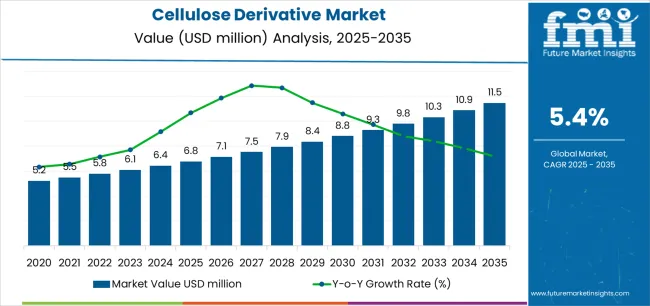
| Metric | Value |
|---|---|
| Estimated Value (2025E) | USD 6,776.6 million |
| Forecast Value (2035F) | USD 11,466.2 million |
| Forecast CAGR (2025–2035) | 5.4% |
Market expansion is being supported by the increasing demand for sustainable bio-based materials and the corresponding need for high-performance polymer systems in industrial applications across global food, pharmaceutical, and construction operations. Modern manufacturers are increasingly focused on specialized cellulose derivative technologies that can improve product performance, reduce environmental impact, and enhance formulation efficiency while meeting stringent regulatory requirements. The proven efficacy of cellulose derivatives in various industrial applications makes them an essential component of comprehensive sustainability strategies and industrial production.
The growing emphasis on green chemistry and circular economy principles is driving demand for ultra-efficient cellulose derivatives that meet stringent performance specifications and regulatory requirements for industrial applications. Chemical manufacturers' preference for reliable, high-performance bio-polymers that can ensure consistent quality outcomes is creating opportunities for innovative processing technologies and customized formulation solutions. The rising influence of environmental regulations and sustainability protocols is also contributing to increased adoption of premium-grade cellulose derivatives across different industrial applications and manufacturing systems requiring specialized polymer technology.
The cellulose derivative market represents a specialized growth opportunity, expanding from USD 6,776.6 million in 2025 to USD 11,466.2 million by 2035 at a 5.4% CAGR. As manufacturers prioritize sustainability, regulatory compliance, and performance optimization in complex industrial processes, cellulose derivatives have evolved from a niche chemical technology to an essential component enabling product innovation, formulation optimization, and multi-stage manufacturing across food, pharmaceutical, and construction applications.
The convergence of sustainability expansion, increasing bio-based material adoption, specialized industrial organization growth, and environmental requirements creates sustained momentum in demand. High-purity formulations offering superior performance, cost-effective methyl cellulose systems balancing performance with economics, and specialized carboxymethyl variants for critical applications will capture market premiums, while geographic expansion into high-growth Asian markets and emerging market penetration will drive volume leadership. Regulatory emphasis on environmental sustainability and product quality reliability provides structural support.
Pathway A - Methyl Cellulose Dominance: Leading with 28% market share, methyl cellulose drives primary demand through versatile applications requiring specialized polymer systems for industrial formulations. Advanced formulations enabling improved viscosity control, enhanced binding properties, and superior film-forming characteristics command premium pricing from manufacturers requiring stringent performance specifications and regulatory compliance. The segment's dominance stems from its excellent water retention properties, thermal gelation behavior, and compatibility with various industrial processes. Expected revenue pool: USD 1,800-2,400 million.
Pathway B - Food Industry Leadership: Dominating end-use applications through optimal balance of functionality and safety compliance, the food industry serves as the primary consumer of cellulose derivatives for applications including thickening, stabilizing, and texture modification. This application addresses both performance standards and food safety considerations, making it the preferred choice for food manufacturers seeking reliable natural ingredient alternatives. Opportunity: USD 2,000-2,800 million.
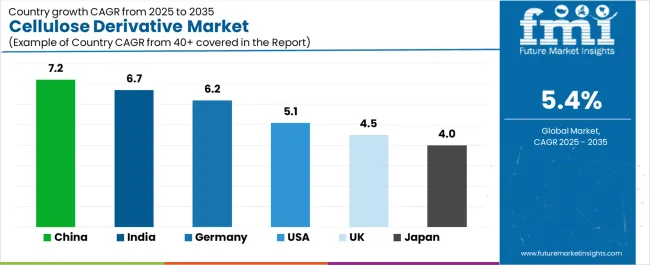
Pathway C - Asian Market Acceleration: China (7.2% CAGR) and India (6.7% CAGR) lead global growth through industrial infrastructure expansion, chemical manufacturing capability development, and domestic cellulose derivative demand. Strategic partnerships with local manufacturers, regulatory compliance expertise, and supply chain localization enable the expansion of bio-polymer technology in major industrial hubs. Geographic expansion upside: USD 2,500-3,500 million.
Pathway D - Pharmaceutical Premium Segment: Pharmaceutical applications serve specialized requirements demanding exceptional purity specifications for critical drug formulation processes. High-purity cellulose derivatives supporting controlled-release applications, tablet coating, and performance-sensitive pharmaceutical processes command significant premiums from advanced pharmaceutical companies and specialized drug manufacturers. Revenue potential: USD 1,600-2,200 million.
Pathway E - Advanced Manufacturing & Processing Systems: Companies investing in sophisticated processing technologies, continuous manufacturing systems, and automated quality control processes gain competitive advantages through consistent product performance and formulation reliability. Advanced manufacturing capabilities enabling customized specifications and rapid scale-up capture premium pharmaceutical and food industry partnerships. Technology premium: USD 1,400-1,900 million.
Pathway F - Carboxymethyl Cellulose Growth: Carboxymethyl cellulose (CMC) represents a high-growth segment driven by expanding applications in detergents, oil drilling, paper manufacturing, and personal care products. The versatility of CMC in providing viscosity control, water retention, and film-forming properties across diverse industries creates multiple revenue streams. Companies developing specialized CMC grades for specific applications capture premium pricing and long-term supply agreements. Market potential: USD 1,300-1,800 million.
Pathway G - Hydroxyethyl Cellulose Expansion: Hydroxyethyl cellulose (HEC) serves critical roles in construction materials, paints and coatings, cosmetics, and pharmaceutical applications. The segment benefits from construction industry growth, increasing demand for water-based coatings, and expanding personal care markets. HEC's excellent thickening properties and compatibility with various formulation systems position it for sustained growth. Opportunity: USD 1,100-1,500 million.
Pathway H - Supply Chain Optimization & Reliability: Specialized distribution networks, strategic inventory management, and reliable supply chain systems create competitive differentiation in industrial markets requiring consistent cellulose derivative availability. Companies offering guaranteed supply security, technical support, and comprehensive regulatory documentation gain preferred supplier status with compliance-focused manufacturers. Supply chain value: USD 900-1,300 million.
Pathway I - Emerging Applications & Market Development: Beyond traditional food and pharmaceutical uses, cellulose derivatives in personal care, construction additives, and specialty industrial applications represent growth opportunities. Companies developing new applications, supporting R&D initiatives, and expanding into adjacent industrial markets capture incremental demand while diversifying revenue streams. Emerging opportunity: USD 700-1,100 million.
The market is segmented by derivative type, end use, and region. By derivative type, the market is divided into Methyl Cellulose, Carboxymethyl Cellulose, Hydroxyethyl Cellulose, Ethyl Cellulose, and Others. Based on end use, the market is categorized into Food Industry, Pharmaceutical Industry, Personal Care, Construction, Paint Industry, and Others. Regionally, the market is divided into Asia Pacific, North America, Europe, Latin America, and the Middle East & Africa.
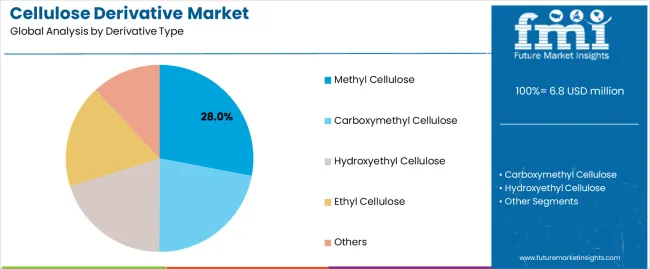
The Methyl Cellulose segment is projected to account for 28% of the cellulose derivative market in 2025, reaffirming its position as the category's dominant derivative type. Chemical manufacturers increasingly recognize the optimal balance of performance and versatility offered by methyl cellulose for most industrial applications, particularly in food processing and pharmaceutical formulations. This derivative type addresses both functional requirements and regulatory considerations while providing reliable performance across diverse industrial applications.
This derivative type forms the foundation of most industrial protocols for formulation applications, as it represents the most widely accepted and commercially viable level of cellulose modification in the industry. Quality control standards and extensive application testing continue to strengthen confidence in methyl cellulose formulations among chemical manufacturers and end-users. With increasing recognition of the performance-cost optimization requirements in industrial manufacturing, methyl cellulose aligns with both operational efficiency and sustainability goals, making it the central growth driver of comprehensive bio-polymer strategies.
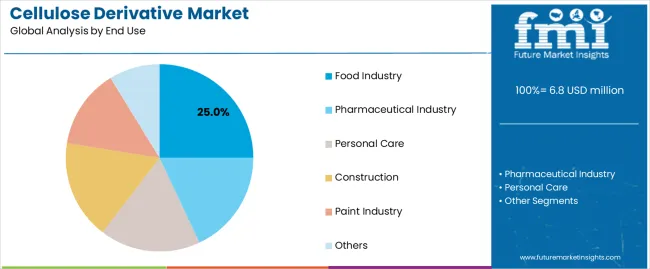
The food industry is projected to represent the largest share of cellulose derivative demand in 2025, underscoring its role as the primary application driving market adoption and growth. Food manufacturers recognize that complex processing requirements, including texture modification, moisture retention, and shelf-life extension, often require specialized cellulose derivatives that standard food additives cannot adequately provide. Cellulose derivatives offer enhanced formulation flexibility and regulatory compliance in food industry applications.
The segment is supported by the growing complexity of food processing, requiring sophisticated functional ingredients, and the increasing recognition that specialized cellulose derivatives can improve product quality and consumer satisfaction. Additionally, food manufacturers are increasingly adopting clean-label strategies that recommend natural and modified natural ingredients for optimal product outcomes. As understanding of food science advances and regulatory requirements become more stringent, cellulose derivatives will continue to play a crucial role in comprehensive formulation strategies within the food industry market.
The cellulose derivative market is advancing steadily due to increasing recognition of bio-based materials' importance and growing demand for high-performance polymer systems across the pharmaceutical, food, and construction sectors. However, the market faces challenges, including complex production processes, potential for quality variations during manufacturing and storage, and concerns about supply chain consistency for specialized chemical materials. Innovation in processing technologies and customized formulation protocols continues to influence product development and market expansion patterns.
The growing adoption of advanced chemical manufacturing facilities is enabling the development of more sophisticated cellulose derivative production and quality control systems that can meet stringent industrial requirements. Specialized manufacturing plants offer comprehensive processing services, including advanced etherification and purification processes that are particularly important for achieving high-purity requirements in pharmaceutical and food applications. Advanced processing channels provide access to premium derivatives that can optimize formulation performance and reduce processing costs while maintaining cost-effectiveness for large-scale industrial operations.
Modern chemical companies are incorporating digital technologies such as real-time quality monitoring, automated process control systems, and supply chain integration to enhance cellulose derivative manufacturing and distribution processes. These technologies improve product consistency, enable continuous quality monitoring, and provide better coordination between manufacturers and customers throughout the supply chain. Advanced digital platforms also enable customized product specifications and early identification of potential quality deviations or supply disruptions, supporting reliable industrial production.
| Country | CAGR (2025–2035) |
|---|---|
| China | 7.2% |
| India | 6.7% |
| Germany | 6.2% |
| USA | 5.1% |
| UK | 4.5% |
| Japan | 4% |
The cellulose derivative market is experiencing varied growth globally, with China leading at a 7.2% CAGR through 2035, driven by the expansion of chemical manufacturing infrastructure development, increasing bio-based material capabilities, and growing domestic demand for high-performance cellulose derivatives. India follows at 6.7%, supported by pharmaceutical industry expansion, growing recognition of sustainable material importance, and expanding manufacturing capacity. Germany shows growth at 6.2%, emphasizing advanced chemical manufacturing technologies and precision formulation applications. The USA shows 5.1% growth, representing a mature market with established manufacturing patterns and regulatory frameworks. The UK exhibits 4.5% growth, supported by advanced manufacturing frameworks and comprehensive sustainability guidelines. Japan demonstrates 4% growth, emphasizing precision chemical manufacturing infrastructure and systematic quality approaches.
The report covers an in-depth analysis of 40+ countries; seven top-performing countries are highlighted below.
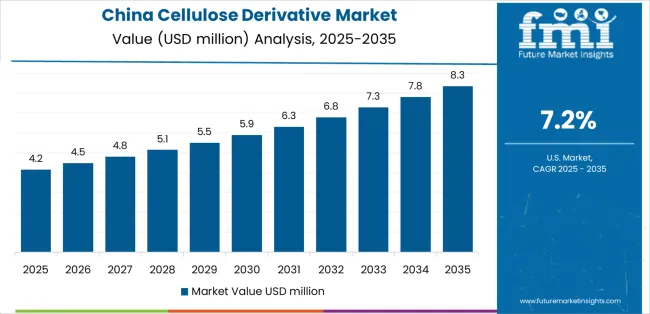
Revenue from cellulose derivatives in China is projected to exhibit robust growth with a CAGR of 7.2% through 2035, making it the leading global market. This momentum is fueled by the country’s strong chemical manufacturing base, rapid expansion of industrial infrastructure, and increasing recognition of bio-based materials as a core component of sustainable growth. China’s vast tire, food, pharmaceutical, and construction industries are steadily integrating high-performance cellulose derivatives to enhance product performance, improve quality control, and comply with stricter sustainability regulations. Major adoption hubs include Beijing, Shanghai, Guangzhou, and Suzhou, where large-scale manufacturers and export-focused plants are building capacity to meet both domestic and international demand.
Government support plays a critical role. The Made in China 2025 strategy emphasizes green chemistry and bio-based material adoption, driving direct investment into cellulose derivative production and processing capabilities. Chinese manufacturers are also expanding into specialty chemicals, leveraging cellulose derivatives for pharmaceuticals, food emulsifiers, coatings, and construction-grade applications. International companies are deepening partnerships with Chinese firms to establish distribution networks and joint ventures, ensuring reliable supply chains and broader reach. With rising domestic consumption, export-driven production, and comprehensive policy backing, China’s cellulose derivative market is positioned to remain the global leader over the next decade.
India is emerging as one of the fastest-growing cellulose derivative markets, expanding at a CAGR of 6.7% through 2035. This growth is anchored by the country’s rapidly expanding pharmaceutical manufacturing industry, which increasingly requires high-purity cellulose derivatives as excipients for tablets, capsules, and controlled-release drug formulations. India’s pharmaceutical hubs in Mumbai, Pune, Delhi NCR, and Bangalore are witnessing rising demand for reliable excipients that meet international regulatory standards such as US-FDA and EMA, particularly as India strengthens its position as the “pharmacy of the world.”
Alongside pharmaceuticals, India’s food processing and specialty chemical sectors are adopting cellulose derivatives as stabilizers, thickeners, and coating agents. Domestic manufacturers and international chemical players are scaling production capacity and building robust distribution networks to ensure supply security. Policy initiatives supporting Make in India and industrial infrastructure growth are creating a favorable investment climate, while regulatory frameworks such as BIS standards are encouraging consistent quality.
Growing awareness of sustainable and bio-based polymers also supports adoption, with cellulose derivatives seen as eco-friendly alternatives to synthetic ingredients. Combined with cost-competitive infrastructure, rising R&D investments, and export-focused manufacturing, India’s cellulose derivative industry is becoming a strategic hub not only for Asia-Pacific but also for global markets.
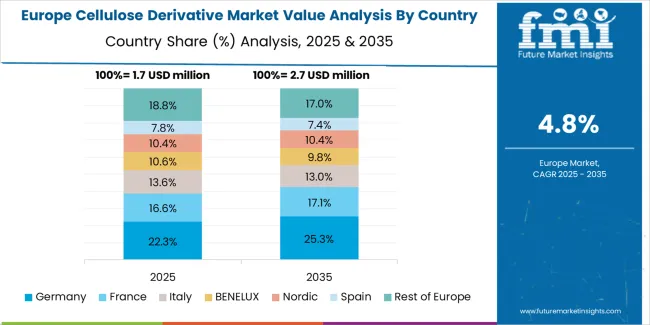
Germany remains a strong and steady growth market for cellulose derivatives, projected at a CAGR of 6.2% through 2035. As Europe’s chemical powerhouse, Germany benefits from advanced R&D, highly automated manufacturing infrastructure, and strict regulatory frameworks that ensure high-quality production. German manufacturers emphasize cellulose derivatives for specialty pharmaceutical and food applications, where precision, purity, and regulatory compliance are critical. High-value sectors such as oral solid dosage pharmaceuticals, functional food ingredients, and construction additives rely heavily on these materials.
Germany’s chemical clusters in Bavaria, Baden-Württemberg, and North Rhine-Westphalia host world-leading chemical companies and specialty producers. Continuous innovation in cleaner production technologies, energy-efficient processes, and green chemistry aligns the market with sustainability goals under the EU Green Deal. Evidence-based formulation guidelines and strong academic-industry collaborations further strengthen application development across multiple industries.
Germany’s logistics networks and regulatory stability also attract global suppliers to integrate operations with local manufacturers. The emphasis on product quality, traceability, and long-term technical collaboration makes Germany a strategic European hub. As pharmaceutical and specialty food demand expands globally, Germany’s reputation for precision chemical manufacturing positions it to remain a leader in cellulose derivative production and innovation.
Brazil’s cellulose derivative market is projected to grow steadily at a CAGR of 4.9% through 2035, driven by its industrial modernization programs, growing food sector, and expanding pharmaceutical production. The country’s large domestic food industry, combined with increasing demand for functional polymers in pharmaceuticals, is creating consistent opportunities for cellulose derivative suppliers. Adoption is strongest in industrial hubs such as São Paulo, Rio de Janeiro, and Minas Gerais, where food processing plants and pharmaceutical facilities are upgrading infrastructure to include bio-based material integration.
Brazil’s government-backed industrial development programs and sustainability initiatives are supporting investments in green chemistry and specialty chemicals. International suppliers are increasingly collaborating with local players through joint ventures and technology transfer programs, ensuring broader adoption of cellulose derivatives in critical applications. The country’s strategic position in South America also enables export opportunities into neighboring markets.
Private sector investments are improving local manufacturing capacity and technology access, enhancing availability of high-quality cellulose derivatives for domestic industries. With modernization accelerating and sustainability priorities rising, Brazil is positioning itself as a regional hub for cellulose derivative adoption, particularly in food stabilization, pharmaceutical excipients, and coatings applications.
The USA cellulose derivative market is expected to grow at a CAGR of 5.1% through 2035, characterized by stability, strong regulation, and innovation. The market is supported by mature pharmaceutical, food, and specialty chemical industries, which rely heavily on cellulose derivatives for excipients, emulsifiers, stabilizers, and coating agents. USA adoption is concentrated in states with major chemical and pharmaceutical clusters such as New Jersey, California, and North Carolina, where compliance with stringent FDA regulations ensures consistent demand for high-purity derivatives.
American manufacturers benefit from sophisticated R&D ecosystems, established supplier networks, and advanced logistics infrastructure, enabling reliable supply chains. The emphasis on product innovation, differentiation, and functional ingredient performance drives continuous application development across food and pharma. Strong regulatory frameworks such as GMP and FDA standards create a quality-driven environment for cellulose derivative utilization.
Collaboration between universities, research institutions, and manufacturers supports ongoing innovation in cellulose chemistry, particularly for next-generation drug delivery systems and clean-label food ingredients. The USA remains a strategic market for global suppliers seeking to tap into advanced, compliance-driven industries that value high-quality bio-based materials.
The UK cellulose derivative market is projected to expand at a CAGR of 4.5% through 2035, supported by advanced pharmaceutical clusters, strong research institutions, and growing demand for sustainable materials. Adoption is concentrated in regions such as London, Manchester, and Cambridge, where pharmaceutical manufacturing and specialty chemical development are expanding.
British manufacturers focus on quality management, regulatory compliance, and high-value applications, particularly in pharmaceuticals and clean-label food industries. The UK regulatory frameworks emphasize sustainability and ingredient security, encouraging investment in domestic cellulose derivative production. As post-Brexit supply chain concerns grow, local sourcing and manufacturing capacity are becoming increasingly critical.
Academic-industry collaborations play a pivotal role in innovation, with leading universities partnering with chemical firms to develop advanced cellulose derivative applications. These include excipients for drug delivery, biodegradable coatings, and specialty food stabilizers. Comprehensive manufacturing education programs also support skilled workforce development.
The UK market is defined by its innovation-driven approach, with an emphasis on high-performance specialty products. While smaller than Germany in overall volume, the UK positions itself as a hub for specialty and niche cellulose derivative applications across pharmaceuticals and advanced food processing.
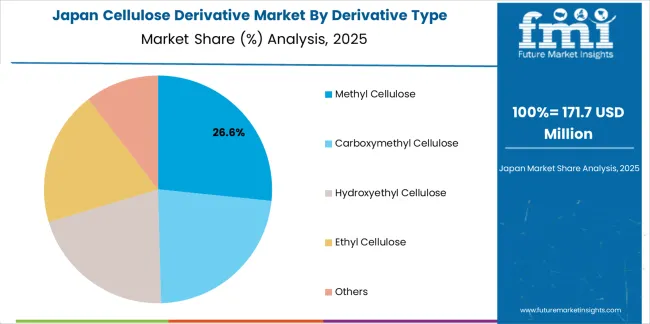
Japan’s cellulose derivative market is expected to grow at a CAGR of 4% through 2035, with its strength rooted in precision chemical manufacturing and long-term reliability. Japanese manufacturers emphasize quality consistency, technical excellence, and structured processes, making cellulose derivatives a critical component in pharmaceuticals and specialty food products. Industrial centers such as Tokyo, Osaka, and Nagoya serve as hubs for production and innovation.
Japan’s market is characterized by a strong focus on pharmaceutical excipients for high-value drug formulations, supported by an aging population that fuels consistent pharmaceutical demand. In addition, food manufacturers are incorporating cellulose derivatives into functional and clean-label products, where quality and safety standards are paramount.
The Japanese government’s emphasis on R&D investment and continuous improvement supports innovation in advanced cellulose chemistry and high-purity excipient production. Long-standing collaborations between academia and industry strengthen formulation capabilities and ensure alignment with international regulatory frameworks.
Japan’s manufacturers prioritize precision-engineered, durable solutions and maintain stable supplier relationships, ensuring long-term reliability. While growth is moderate compared to emerging markets, Japan’s reputation for quality-driven innovation secures its role as a leading producer and consumer of high-performance cellulose derivatives in Asia.
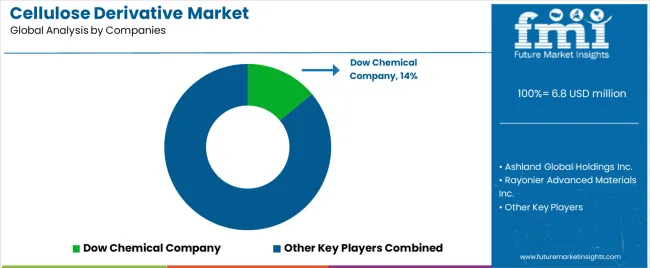
The Cellulose Derivative Market is growing steadily as industries shift toward bio-based, versatile, and highly functional materials for applications in pharmaceuticals, food and beverage, construction, personal care, and adhesives. Cellulose derivatives such as cellulose ethers, esters, and microcrystalline cellulose are valued for their thickening, stabilizing, binding, and film-forming properties. With manufacturers and end users prioritizing sustainable ingredients and regulatory-safe formulations, demand for high-purity and performance-enhanced cellulose derivatives continues to rise across global markets.
Dow Chemical Company and Ashland Global Holdings Inc. are among the leading suppliers, offering extensive portfolios of cellulose ethers for pharmaceutical excipients, food stabilization, and industrial formulations. Their focus on improved solubility, consistency, and performance is helping customers develop cleaner and more efficient end products. Rayonier Advanced Materials Inc. plays a key role in supplying high-quality cellulose sourced from sustainably managed forests, supporting downstream production of derivatives used in coatings, plastics, and specialty chemicals.
CP Kelco is a prominent participant in food, beverage, and personal care applications, leveraging expertise in sustainable hydrocolloids and customized cellulose-based functional systems. Celanese Corporation strengthens the market with high-performance cellulose esters used in coatings, filtration media, cosmetics, and packaging. Together, these companies are shaping a market that is moving rapidly toward renewable, high-purity, and multifunctional cellulose-based materials.
| Items | Values |
|---|---|
| Quantitative Units (2025) | USD 6,776.6 million |
| Derivative Type | Methyl Cellulose, Carboxymethyl Cellulose, Hydroxyethyl Cellulose, Ethyl Cellulose, Others |
| End Use | Food Industry, Pharmaceutical Industry, Personal Care, Construction, Paint Industry, Others |
| Regions Covered | Asia Pacific, North America, Europe, Latin America, Middle East & Africa |
| Countries Covered | China, India, Germany, United States, United Kingdom, Japan, and 40+ countries |
| Key Companies Profiled | Dow Chemical Company, Ashland Global Holdings Inc., Rayonier Advanced Materials Inc., CP Kelco, Celanese Corporation |
| Additional Attributes | Dollar sales by derivative type and end use, regional demand trends, competitive landscape, manufacturer preferences for specific cellulose derivatives, integration with specialty chemical supply chains, innovations in processing technologies, quality monitoring, and formulation optimization |
The global cellulose derivative market is estimated to be valued at USD 6.8 million in 2025.
The market size for the cellulose derivative market is projected to reach USD 11.5 million by 2035.
The cellulose derivative market is expected to grow at a 5.4% CAGR between 2025 and 2035.
The key product types in cellulose derivative market are methyl cellulose, carboxymethyl cellulose, hydroxyethyl cellulose, ethyl cellulose and others.
In terms of end use, food industry segment to command 25.0% share in the cellulose derivative market in 2025.


Our Research Products

The "Full Research Suite" delivers actionable market intel, deep dives on markets or technologies, so clients act faster, cut risk, and unlock growth.

The Leaderboard benchmarks and ranks top vendors, classifying them as Established Leaders, Leading Challengers, or Disruptors & Challengers.

Locates where complements amplify value and substitutes erode it, forecasting net impact by horizon

We deliver granular, decision-grade intel: market sizing, 5-year forecasts, pricing, adoption, usage, revenue, and operational KPIs—plus competitor tracking, regulation, and value chains—across 60 countries broadly.

Spot the shifts before they hit your P&L. We track inflection points, adoption curves, pricing moves, and ecosystem plays to show where demand is heading, why it is changing, and what to do next across high-growth markets and disruptive tech

Real-time reads of user behavior. We track shifting priorities, perceptions of today’s and next-gen services, and provider experience, then pace how fast tech moves from trial to adoption, blending buyer, consumer, and channel inputs with social signals (#WhySwitch, #UX).

Partner with our analyst team to build a custom report designed around your business priorities. From analysing market trends to assessing competitors or crafting bespoke datasets, we tailor insights to your needs.
Supplier Intelligence
Discovery & Profiling
Capacity & Footprint
Performance & Risk
Compliance & Governance
Commercial Readiness
Who Supplies Whom
Scorecards & Shortlists
Playbooks & Docs
Category Intelligence
Definition & Scope
Demand & Use Cases
Cost Drivers
Market Structure
Supply Chain Map
Trade & Policy
Operating Norms
Deliverables
Buyer Intelligence
Account Basics
Spend & Scope
Procurement Model
Vendor Requirements
Terms & Policies
Entry Strategy
Pain Points & Triggers
Outputs
Pricing Analysis
Benchmarks
Trends
Should-Cost
Indexation
Landed Cost
Commercial Terms
Deliverables
Brand Analysis
Positioning & Value Prop
Share & Presence
Customer Evidence
Go-to-Market
Digital & Reputation
Compliance & Trust
KPIs & Gaps
Outputs
Full Research Suite comprises of:
Market outlook & trends analysis
Interviews & case studies
Strategic recommendations
Vendor profiles & capabilities analysis
5-year forecasts
8 regions and 60+ country-level data splits
Market segment data splits
12 months of continuous data updates
DELIVERED AS:
PDF EXCEL ONLINE
Cellulose Ether and Derivatives Market Size and Share Forecast Outlook 2025 to 2035
Demand for Cellulose Derivative in Japan Size and Share Forecast Outlook 2025 to 2035
Demand for Cellulose Derivative in USA Size and Share Forecast Outlook 2025 to 2035
Cellulose Diacetate Film Market Size and Share Forecast Outlook 2025 to 2035
Cellulose Fiber Market Forecast and Outlook 2025 to 2035
Cellulose Film Packaging Market Size and Share Forecast Outlook 2025 to 2035
Cellulose Esters Market Size and Share Forecast Outlook 2025 to 2035
Cellulose Nanocrystals and Nanofibers Market Size and Share Forecast Outlook 2025 to 2035
Cellulose Gel Market Growth, Forecast, and Analysis 2025 to 2035
Market Share Insights for Cellulose Fiber Providers
Key Players & Market Share in Cellulose Film Packaging Market
Nanocellulose Coating Market Analysis - Size and Share Forecast Outlook 2025 to 2035
Nanocellulose Barrier Coating Market Analysis - Size and Share Forecast Outlook 2025 to 2035
Aeroderivative Sensor Market Size and Share Forecast Outlook 2025 to 2035
Aeroderivative Gas Turbine Service Market Size and Share Forecast Outlook 2025 to 2035
Nanocellulose Market Report - Demand, Growth & Industry Outlook 2025 to 2035
Rice Derivative Market Size and Share Forecast Outlook 2025 to 2035
Cocoa Derivatives Market Analysis by Type, Category, Application and Region through 2035
Ethyl Cellulose Market
Starch Derivatives Market by Product Type, Source, End Use and Region through 2035

Thank you!
You will receive an email from our Business Development Manager. Please be sure to check your SPAM/JUNK folder too.
Chat With
MaRIA