Cellulose Ether and Derivatives Market Outlook from 2024 to 2034

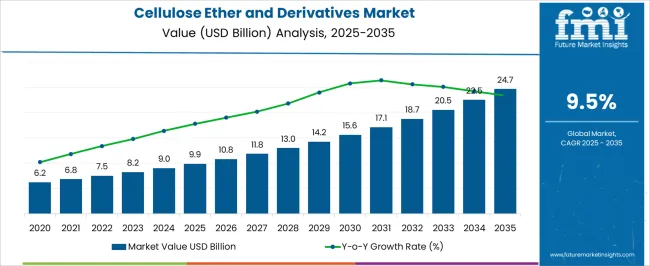
The cellulose ether and derivatives market is projected to be worth US$ 9.0 billion in 2024. The market is anticipated to reach US$ 22.6 billion by 2034. The market is further expected to surge at a CAGR of 9.6% during the forecast period 2024 to 2034.

Key Market Trends and Highlights

Water based coatings, which often utilize cellulose ethers as rheology modifiers, have gained popularity due to environmental concerns associated with solvent based coatings. The shift towards water based formulations in various industries, including paints and coatings, is expected to drive the demand for cellulose ethers.

  • Advances in manufacturing technologies and processes for cellulose derivativess are expected to improve efficiency, reduce costs, and expand the range of applications.
  • Cellulose ethers are utilized in personal care and cosmetic products as thickeners, stabilizers, and film forming agents. The expanding global cosmetics industry and the demand for natural and sustainable ingredients are expected to drive the use of cellulose ethers in this sector.
  • Government initiatives and increased investments in infrastructure projects, such as roads, bridges, and public buildings, are anticipated to fuel the demand for construction materials containing cellulose ethers.
Attributes Key Insights
Cellulose Ether and Derivatives Market Estimated Size in 2024 US$ 9.0 billion
Projected Market Value in 2034 US$ 22.6 billion
Value-based CAGR from 2024 to 2034 9.6%

Don't pay for what you don't need

Customize your report by selecting specific countries or regions and save 30%!

2019 to 2023 Historical Analysis vs. 2024 to 2034 Market Forecast Projections

The scope for cellulose ether and derivatives rose at a 12.3% CAGR between 2019 and 2023. The global market for cellulose ether and derivatives is anticipated to grow at a moderate CAGR of 9.6% over the forecast period 2024 to 2034.

The market experienced steady growth during the historical period from 2019 to 2023. Increased construction activities globally, especially in emerging markets, augmented the demand for cellulose ethers in construction materials.

  • Developments in the pharmaceutical and healthcare industries contributed to the use of cellulose ethers in drug formulations and medical applications.
  • Growing awareness of sustainability and environmentally friendly products led to increased adoption of cellulose ethers derived from renewable sources.
  • Advances in manufacturing technologies and product development influenced the market dynamics during this period.

Looking ahead to the forecast period from 2024 to 2034, the market is expected to witness significant growth. Projections consider the sustained growth in urbanization and infrastructure projects, driving the demand for construction materials containing cellulose ethers.

  • Anticipated expansion into newer industries, driven by ongoing research and development, can open up new applications for cellulose ethers.
  • Continued advancements in healthcare and pharmaceuticals are anticipated to drive the use of cellulose ethers in drug delivery systems and medical applications.
  • Forecasts incorporate expectations regarding further technological advancements in cellulose ether production processes, leading to improved efficiency and cost effectiveness.

Cellulose Ether and Derivatives Market Key Drivers

Cellulose ethers are commonly used in construction materials such as adhesives, mortars, and grouts. The growth of the construction industry, particularly in emerging economies, is expected to drive the demand for cellulose ethers.

  • Cellulose ethers find applications in pharmaceuticals as thickeners, binders, and disintegrants. The growth of the pharmaceutical industry and increasing demand for pharmaceutical excipients are anticipated to boost the cellulose ether market.
  • Cellulose ethers are used as stabilizers, thickeners, and emulsifiers in the food and beverage industry. The demand for processed and convenience foods is expected to increase, as the global population continues to grow, positively impacting the cellulose ether market.
  • Ongoing research and development efforts to enhance the properties and functionalities of cellulose ethers for various applications are expected to create new opportunities in the market.
Nikhil Kaitwade
Nikhil Kaitwade

Principal Consultant

Talk to Analyst

Find your sweet spots for generating winning opportunities in this market.

Challenges in the Cellulose Ether and Derivatives Market

The presence of alternative products or substitutes with similar functionalities can pose a challenge to the cellulose ether market. Companies may face competition from other polymers or synthetic materials.
  • The market is sensitive to the prices of raw materials, which are often derived from natural sources. Fluctuations in the prices of these raw materials can impact the production costs for cellulose ethers.
  • The market growth can be restrained by a lack of awareness and understanding among end users about the benefits and applications of cellulose ethers, especially in regions where the market is still emerging.
  • Technical challenges related to formulation compatibility, stability, and performance in certain applications can hamper widespread adoption of cellulose ethers.

Country-wise Insights

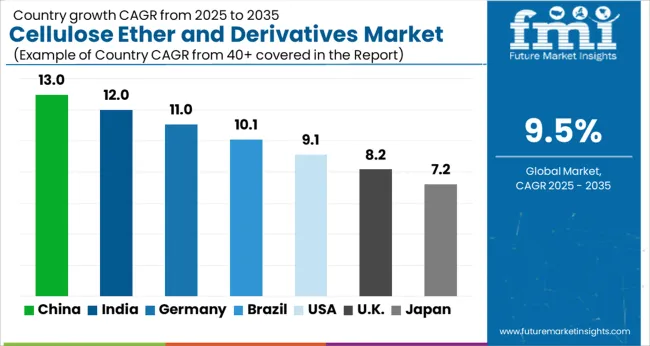
The below table showcases revenues in terms of the top 5 leading countries, spearheaded by Korea and Japan. The countries are expected to lead the market through 2034.

Countries Forecast CAGRs from 2024 to 2034
The United States 9.9%
China 10.3%
The United Kingdom 10.8%
Japan 11.2%
Korea 12.0%

Growth in Construction and Building Industry Driving the Market in the United States

The cellulose ether and derivatives market in the United States expected to expand at a CAGR of 9.9% through 2034. Cellulose ethers find extensive use in construction materials, including adhesives, mortars, and grouts. The growth in residential and commercial construction projects contributes to the demand for cellulose ethers in the United States.

  • The growth of pharmaceutical industry in the country, driven by research and development activities, contributes to the demand for cellulose ethers in pharmaceutical formulations as binders, disintegrants, and stabilizers.
  • The food and beverage industry utilizes cellulose ethers as thickeners, stabilizers, and emulsifiers. There is a continuous demand for cellulose ethers in various applications, with the United States having a large and diverse food and beverage sector.

Cosmetics and Personal Care Demand to Accelerate Market Growth in the United Kingdom

The cellulose ether and derivatives market in the United Kingdom is anticipated to expand at a CAGR of 10.8% through 2034. Cellulose ethers are commonly used in personal care and cosmetic products such as creams, lotions, and shampoos. The demand for skincare and cosmetic items in the country contributes to the growth of the cellulose ether market.

  • Compliance with stringent regulatory standards ensures the safety and quality of cellulose ether products in the United Kingdom, supporting their acceptance in various industries.
  • Research and development initiatives in the country drive innovation in cellulose ether products, leading to the development of new formulations and applications in different sectors.

Technological Advancements in Manufacturing Processes Spearhead the Market in China

Cellulose ether and derivatives trends in China are taking a turn for the better. A 10.3% CAGR is forecast for the country from 2024 to 2034. Continuous advancements in manufacturing technologies, including modifications to enhance efficiency and reduce costs, contribute to the growth of the cellulose ether market in China.
  • Increasing consumer awareness about the benefits of cellulose ethers, such as their natural origin and environmentally friendly properties, can drive their adoption in various industries.
  • China has been undergoing significant industrialization and urbanization, leading to increased demand for construction materials. Cellulose ethers find applications in the construction sector, contributing to market growth.

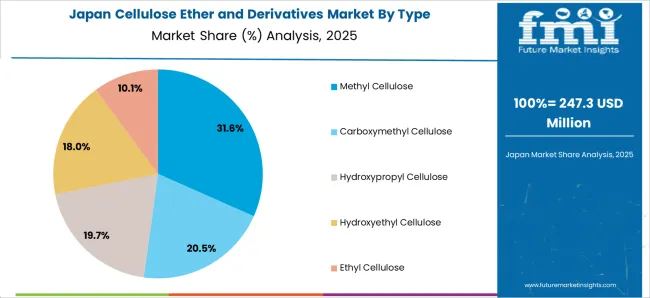
Expansion of E-Commerce and Retail Networks Fueling the Market in Japan

The cellulose ether and derivatives market in Japan is poised to expand at a CAGR of 11.2% through 2034. Japan has an aging population, leading to increased healthcare needs. The growth of healthcare sector, driven by healthcare demands, supports the demand for cellulose ethers.

  • The growth of e-commerce and retail activities in Japan facilitates the distribution and accessibility of cellulose ether products to a broader consumer base.
  • Japan is known for its stringent quality standards. The cellulose ether market benefits from the adherence to high quality standards, ensuring the safety and efficacy of products.

Integration of Advanced Technologies Driving the Demand in Korea

The cellulose ether and derivatives market in Korea is anticipated to expand at a CAGR of 12.0% through 2034. The participation of the country in global trade and export activities can contribute to the expansion of the cellulose ether market by reaching international markets.

  • Incorporating advanced technologies, such as nanotechnology, into the production processes of cellulose ethers can enhance their properties and open up new opportunities in high tech applications.
  • The expansion of textile and apparel industry can drive demand for cellulose ethers, which are used in textile processing as sizing agents and thickeners.

Get the data you need at a Fraction of the cost

Personalize your report by choosing insights you need
and save 40%!

Category-wise Insights

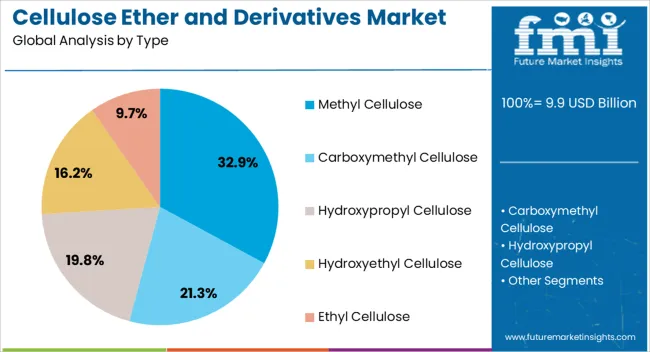
The below table highlights how carboxymethyl cellulose segment is projected to lead the market in terms of type, and is expected to account for a CAGR of 9.4% through 2034.

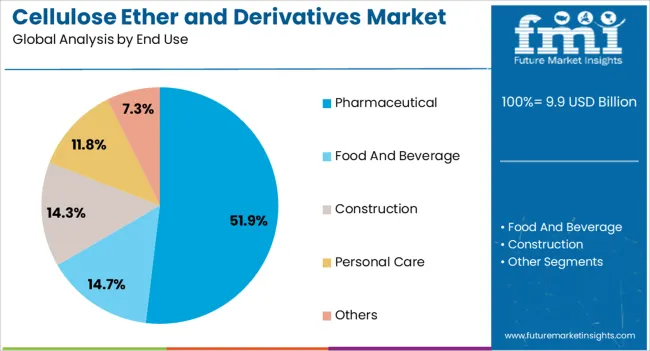
Based on end use, the pharmaceutical segment is expected to account for a CAGR of 9.2% through 2034.

Category CAGR through 2034
Carboxymethyl Cellulose 9.4%
Pharmaceutical 9.2%

Carboxymethyl Cellulose Claims High Demand for Cellulose Ether and Derivatives

Based on type, the carboxymethyl cellulose segment is expected to continue dominating the cellulose ether and derivatives market. Carboxymethyl cellulose finds applications across various industries, including food and beverages, pharmaceuticals, cosmetics, and personal care products. Its versatility and ability to function as a thickener, stabilizer, and viscosity modifier contribute to its widespread use.

  • Carboxymethyl cellulose is commonly used in the food and beverage industry as a thickener, stabilizer, and texturizer. The demand for processed and convenience foods has driven the use of this cellulose in products such as sauces, dressings, and bakery items.
  • The cellulose is also utilized in the pharmaceutical industry as a binder and disintegrant in tablet formulations. The growth of the pharmaceutical sector and increasing demand for pharmaceutical excipients contribute to the demand for this segment.

Pharmaceutical Segment to Hold High Demand for Cellulose Ether and Derivatives

In terms of end use, the pharmaceutical segment is expected to continue dominating the cellulose ether and derivatives market. Cellulose ethers, including carboxymethyl cellulose and methyl cellulose, are widely used as binders and disintegrants in pharmaceutical formulations. They contribute to the structural integrity of tablets and enhance their disintegration and dissolution properties.

  • Certain cellulose ethers are employed in pharmaceutical formulations to achieve controlled drug release, which is particularly important for medications requiring sustained or extended release, improving patient compliance and efficacy.
  • Cellulose ethers function as stabilizers for emulsions and suspensions in pharmaceutical formulations, which is crucial for drugs that are not soluble in water and require a stable formulation for effective delivery.
Competitive Landscape

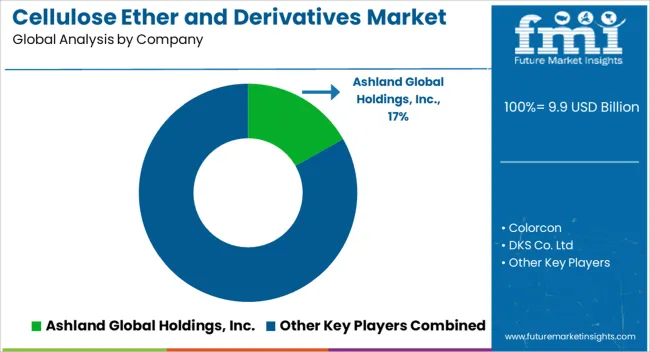
The cellulose ether and derivatives market is characterized by a competitive landscape shaped by key players striving for market share through innovations, strategic collaborations, and global expansion. The dynamism of the market is driven by the diverse applications of cellulose ethers in industries such as construction, pharmaceuticals, food and beverages, cosmetics, and textiles.

Company Portfolio

  • Ashland Global Holdings Inc. is a prominent player in the cellulose ether market, providing specialty chemicals for industries such as pharmaceuticals, personal care, and construction. The company emphasizes sustainability and has a robust product portfolio to cater to diverse market needs.
  • Based in South Korea, LOTTE Fine Chemical is a major player in the cellulose ether market, offering a range of products for applications in construction, cosmetics, and pharmaceuticals. The strategic partnerships and investments of the company in research and development enhance its market position.

Report Scope

Attribute Details
Estimated Market Size in 2024 US$ 9.0 billion
Projected Market Valuation in 2034 US$ 22.6 billion
Value-based CAGR 2024 to 2034 9.6%
Forecast Period 2024 to 2034
Historical Data Available for 2019 to 2023
Market Analysis Value in US$ billion
Key Regions Covered
  • North America
  • Latin America
  • Western Europe
  • Eastern Europe
  • South Asia and Pacific
  • East Asia
  • The Middle East & Africa
Key Market Segments Covered
  • Type
  • End Use
  • Region
Key Countries Profiled
  • The United States
  • Canada
  • Brazil
  • Mexico
  • Germany
  • France
  • France
  • Spain
  • Italy
  • Russia
  • Poland
  • Czech Republic
  • Romania
  • India
  • Bangladesh
  • Australia
  • New Zealand
  • China
  • Japan
  • South Korea
  • GCC countries
  • South Africa
  • Israel
Key Companies Profiled
  • Ashland Global Holdings, Inc
  • Colorcon
  • DKS Co. Ltd
  • Fenchem Biotek Ltd
  • Hebei Jiahua Cellulose Co., Ltd
  • J.M. Huber Corporation
  • J. RETTENMAIER SOHNE Gmbh
  • Lamberti S.p.A
  • LOTTE Fine Chemicals
  • Nouryon Chemical Holdings B.V

Segmentation Analysis of the Cellulose Ether and Derivatives Market

By Type:

  • Carboxymethyl Cellulose
  • Hydroxypropyl Cellulose
  • Methyl Cellulose
  • Hydroxyethyl Cellulose
  • Ethyl Cellulose

By End Use:

  • Pharmaceutical
  • Food and Beverage
  • Construction
  • Personal Care
  • Others

By Region:

  • North America
  • Latin America
  • Western Europe
  • Eastern Europe
  • South Asia and Pacific
  • East Asia
  • The Middle East and Africa

Frequently Asked Questions

What is the anticipated value of the Cellulose Ether and Derivatives market in 2024?

The cellulose ether and derivatives market is projected to reach a valuation of US$ 9.0 billion in 2024.

What is the expected CAGR for the Cellulose Ether and Derivatives market until 2034?

The cellulose ether and derivatives industry is set to expand by a CAGR of 9.6% through 2034.

How much valuation is projected for the Cellulose Ether and Derivatives market in 2034?

The cellulose ether and derivatives market is forecast to reach US$ 22.6 billion by 2034.

Which country is projected to lead the Cellulose Ether and Derivatives market?

Korea is expected to be the top performing market, exhibiting a CAGR of 12.0% through 2034.

Which is the dominant component in the Cellulose Ether and Derivatives domain?

Carboxymethyl cellulose segment is preferred, and is expected to account for a CAGR of 9.4% through 2034.

Table of Content
1. Executive Summary
    1.1. Global Market Outlook
    1.2. Demand-side Trends
    1.3. Supply-side Trends
    1.4. Technology Roadmap Analysis
    1.5. Analysis and Recommendations
2. Market Overview
    2.1. Market Coverage / Taxonomy
    2.2. Market Definition / Scope / Limitations
3. Market Background
    3.1. Market Dynamics
        3.1.1. Drivers
        3.1.2. Restraints
        3.1.3. Opportunity
        3.1.4. Trends
    3.2. Scenario Forecast
        3.2.1. Demand in Optimistic Scenario
        3.2.2. Demand in Likely Scenario
        3.2.3. Demand in Conservative Scenario
    3.3. Opportunity Map Analysis
    3.4. Product Life Cycle Analysis
    3.5. Supply Chain Analysis
        3.5.1. Supply Side Participants and their Roles
            3.5.1.1. Producers
            3.5.1.2. Mid-Level Participants (Traders/ Agents/ Brokers)
            3.5.1.3. Wholesalers and Distributors
        3.5.2. Value Added and Value Created at Node in the Supply Chain
        3.5.3. List of Raw Material Suppliers
        3.5.4. List of Existing and Potential Buyer’s
    3.6. Investment Feasibility Matrix
    3.7. Value Chain Analysis
        3.7.1. Profit Margin Analysis
        3.7.2. Wholesalers and Distributors
        3.7.3. Retailers
    3.8. PESTLE and Porter’s Analysis
    3.9. Regulatory Landscape
        3.9.1. By Key Regions
        3.9.2. By Key Countries
    3.10. Regional Parent Market Outlook
    3.11. Production and Consumption Statistics
    3.12. Import and Export Statistics
4. Global Market Analysis 2019 to 2023 and Forecast, 2024 to 2034
    4.1. Historical Market Size Value (US$ Million) & Volume (Tons) Analysis, 2019 to 2023
    4.2. Current and Future Market Size Value (US$ Million) & Volume (Tons) Projections, 2024 to 2034
        4.2.1. Y-o-Y Growth Trend Analysis
        4.2.2. Absolute $ Opportunity Analysis
5. Global Market Analysis 2019 to 2023 and Forecast 2024 to 2034, By Type
    5.1. Introduction / Key Findings
    5.2. Historical Market Size Value (US$ Million) & Volume (Tons) Analysis By Type, 2019 to 2023
    5.3. Current and Future Market Size Value (US$ Million) & Volume (Tons) Analysis and Forecast By Type, 2024 to 2034
        5.3.1. Carboxymethyl Cellulose
        5.3.2. Hydroxypropyl Cellulose
        5.3.3. Methyl Cellulose
        5.3.4. Hydroxyethyl Cellulose
        5.3.5. Ethyl Cellulose
    5.4. Y-o-Y Growth Trend Analysis By Type, 2019 to 2023
    5.5. Absolute $ Opportunity Analysis By Type, 2024 to 2034
6. Global Market Analysis 2019 to 2023 and Forecast 2024 to 2034, By End Use
    6.1. Introduction / Key Findings
    6.2. Historical Market Size Value (US$ Million) & Volume (Tons) Analysis By End Use, 2019 to 2023
    6.3. Current and Future Market Size Value (US$ Million) & Volume (Tons) Analysis and Forecast By End Use, 2024 to 2034
        6.3.1. Pharmaceutical
        6.3.2. Food and Beverage
        6.3.3. Construction
        6.3.4. Personal Care
        6.3.5. Others
    6.4. Y-o-Y Growth Trend Analysis By End Use, 2019 to 2023
    6.5. Absolute $ Opportunity Analysis By End Use, 2024 to 2034
7. Global Market Analysis 2019 to 2023 and Forecast 2024 to 2034, By Region
    7.1. Introduction
    7.2. Historical Market Size Value (US$ Million) & Volume (Tons) Analysis By Region, 2019 to 2023
    7.3. Current Market Size Value (US$ Million) & Volume (Tons) Analysis and Forecast By Region, 2024 to 2034
        7.3.1. North America
        7.3.2. Latin America
        7.3.3. Europe
        7.3.4. East Asia
        7.3.5. South Asia
        7.3.6. Oceania
        7.3.7. MEA
    7.4. Market Attractiveness Analysis By Region
8. North America Market Analysis 2019 to 2023 and Forecast 2024 to 2034, By Country
    8.1. Historical Market Size Value (US$ Million) & Volume (Tons) Trend Analysis By Market Taxonomy, 2019 to 2023
    8.2. Market Size Value (US$ Million) & Volume (Tons) Forecast By Market Taxonomy, 2024 to 2034
        8.2.1. By Country
            8.2.1.1. USA
            8.2.1.2. Canada
        8.2.2. By Type
        8.2.3. By End Use
    8.3. Market Attractiveness Analysis
        8.3.1. By Country
        8.3.2. By Type
        8.3.3. By End Use
    8.4. Key Takeaways
9. Latin America Market Analysis 2019 to 2023 and Forecast 2024 to 2034, By Country
    9.1. Historical Market Size Value (US$ Million) & Volume (Tons) Trend Analysis By Market Taxonomy, 2019 to 2023
    9.2. Market Size Value (US$ Million) & Volume (Tons) Forecast By Market Taxonomy, 2024 to 2034
        9.2.1. By Country
            9.2.1.1. Brazil
            9.2.1.2. Mexico
            9.2.1.3. Argentina
            9.2.1.4. Rest of Latin America
        9.2.2. By Type
        9.2.3. By End Use
    9.3. Market Attractiveness Analysis
        9.3.1. By Country
        9.3.2. By Type
        9.3.3. By End Use
    9.4. Key Takeaways
10. Europe Market Analysis 2019 to 2023 and Forecast 2024 to 2034, By Country
    10.1. Historical Market Size Value (US$ Million) & Volume (Tons) Trend Analysis By Market Taxonomy, 2019 to 2023
    10.2. Market Size Value (US$ Million) & Volume (Tons) Forecast By Market Taxonomy, 2024 to 2034
        10.2.1. By Country
            10.2.1.1. Germany
            10.2.1.2. Italy
            10.2.1.3. France
            10.2.1.4. UK
            10.2.1.5. Spain
            10.2.1.6. Russia
            10.2.1.7. BENELUX
            10.2.1.8. Rest of Europe
        10.2.2. By Type
        10.2.3. By End Use
    10.3. Market Attractiveness Analysis
        10.3.1. By Country
        10.3.2. By Type
        10.3.3. By End Use
    10.4. Key Takeaways
11. East Asia Market Analysis 2019 to 2023 and Forecast 2024 to 2034, By Country
    11.1. Historical Market Size Value (US$ Million) & Volume (Tons) Trend Analysis By Market Taxonomy, 2019 to 2023
    11.2. Market Size Value (US$ Million) & Volume (Tons) Forecast By Market Taxonomy, 2024 to 2034
        11.2.1. By Country
            11.2.1.1. China
            11.2.1.2. Japan
            11.2.1.3. South Korea
        11.2.2. By Type
        11.2.3. By End Use
    11.3. Market Attractiveness Analysis
        11.3.1. By Country
        11.3.2. By Type
        11.3.3. By End Use
    11.4. Key Takeaways
12. South Asia Market Analysis 2019 to 2023 and Forecast 2024 to 2034, By Country
    12.1. Historical Market Size Value (US$ Million) & Volume (Tons) Trend Analysis By Market Taxonomy, 2019 to 2023
    12.2. Market Size Value (US$ Million) & Volume (Tons) Forecast By Market Taxonomy, 2024 to 2034
        12.2.1. By Country
            12.2.1.1. India
            12.2.1.2. Thailand
            12.2.1.3. Malaysia
            12.2.1.4. Indonesia
            12.2.1.5. Rest of South Asia
        12.2.2. By Type
        12.2.3. By End Use
    12.3. Market Attractiveness Analysis
        12.3.1. By Country
        12.3.2. By Type
        12.3.3. By End Use
    12.4. Key Takeaways
13. Oceania Market Analysis 2019 to 2023 and Forecast 2024 to 2034, By Country
    13.1. Historical Market Size Value (US$ Million) & Volume (Tons) Trend Analysis By Market Taxonomy, 2019 to 2023
    13.2. Market Size Value (US$ Million) & Volume (Tons) Forecast By Market Taxonomy, 2024 to 2034
        13.2.1. By Country
            13.2.1.1. Australia
            13.2.1.2. New Zealand
        13.2.2. By Type
        13.2.3. By End Use
    13.3. Market Attractiveness Analysis
        13.3.1. By Country
        13.3.2. By Type
        13.3.3. By End Use
    13.4. Key Takeaways
14. MEA Market Analysis 2019 to 2023 and Forecast 2024 to 2034, By Country
    14.1. Historical Market Size Value (US$ Million) & Volume (Tons) Trend Analysis By Market Taxonomy, 2019 to 2023
    14.2. Market Size Value (US$ Million) & Volume (Tons) Forecast By Market Taxonomy, 2024 to 2034
        14.2.1. By Country
            14.2.1.1. GCC
            14.2.1.2. Rest of MEA
        14.2.2. By Type
        14.2.3. By End Use
    14.3. Market Attractiveness Analysis
        14.3.1. By Country
        14.3.2. By Type
        14.3.3. By End Use
    14.4. Key Takeaways
15. Key Countries Market Analysis
    15.1. USA
        15.1.1. Pricing Analysis
        15.1.2. Market Share Analysis, 2023
            15.1.2.1. By Type
            15.1.2.2. By End Use
    15.2. Canada
        15.2.1. Pricing Analysis
        15.2.2. Market Share Analysis, 2023
            15.2.2.1. By Type
            15.2.2.2. By End Use
    15.3. Brazil
        15.3.1. Pricing Analysis
        15.3.2. Market Share Analysis, 2023
            15.3.2.1. By Type
            15.3.2.2. By End Use
    15.4. Mexico
        15.4.1. Pricing Analysis
        15.4.2. Market Share Analysis, 2023
            15.4.2.1. By Type
            15.4.2.2. By End Use
    15.5. Argentina
        15.5.1. Pricing Analysis
        15.5.2. Market Share Analysis, 2023
            15.5.2.1. By Type
            15.5.2.2. By End Use
    15.6. Germany
        15.6.1. Pricing Analysis
        15.6.2. Market Share Analysis, 2023
            15.6.2.1. By Type
            15.6.2.2. By End Use
    15.7. Italy
        15.7.1. Pricing Analysis
        15.7.2. Market Share Analysis, 2023
            15.7.2.1. By Type
            15.7.2.2. By End Use
    15.8. France
        15.8.1. Pricing Analysis
        15.8.2. Market Share Analysis, 2023
            15.8.2.1. By Type
            15.8.2.2. By End Use
    15.9. UK
        15.9.1. Pricing Analysis
        15.9.2. Market Share Analysis, 2023
            15.9.2.1. By Type
            15.9.2.2. By End Use
    15.10. Spain
        15.10.1. Pricing Analysis
        15.10.2. Market Share Analysis, 2023
            15.10.2.1. By Type
            15.10.2.2. By End Use
    15.11. Russia
        15.11.1. Pricing Analysis
        15.11.2. Market Share Analysis, 2023
            15.11.2.1. By Type
            15.11.2.2. By End Use
    15.12. BENELUX
        15.12.1. Pricing Analysis
        15.12.2. Market Share Analysis, 2023
            15.12.2.1. By Type
            15.12.2.2. By End Use
    15.13. China
        15.13.1. Pricing Analysis
        15.13.2. Market Share Analysis, 2023
            15.13.2.1. By Type
            15.13.2.2. By End Use
    15.14. Japan
        15.14.1. Pricing Analysis
        15.14.2. Market Share Analysis, 2023
            15.14.2.1. By Type
            15.14.2.2. By End Use
    15.15. South Korea
        15.15.1. Pricing Analysis
        15.15.2. Market Share Analysis, 2023
            15.15.2.1. By Type
            15.15.2.2. By End Use
    15.16. India
        15.16.1. Pricing Analysis
        15.16.2. Market Share Analysis, 2023
            15.16.2.1. By Type
            15.16.2.2. By End Use
    15.17. Thailand
        15.17.1. Pricing Analysis
        15.17.2. Market Share Analysis, 2023
            15.17.2.1. By Type
            15.17.2.2. By End Use
    15.18. Malaysia
        15.18.1. Pricing Analysis
        15.18.2. Market Share Analysis, 2023
            15.18.2.1. By Type
            15.18.2.2. By End Use
    15.19. Indonesia
        15.19.1. Pricing Analysis
        15.19.2. Market Share Analysis, 2023
            15.19.2.1. By Type
            15.19.2.2. By End Use
    15.20. Australia
        15.20.1. Pricing Analysis
        15.20.2. Market Share Analysis, 2023
            15.20.2.1. By Type
            15.20.2.2. By End Use
    15.21. New Zealand
        15.21.1. Pricing Analysis
        15.21.2. Market Share Analysis, 2023
            15.21.2.1. By Type
            15.21.2.2. By End Use
    15.22. GCC Countries
        15.22.1. Pricing Analysis
        15.22.2. Market Share Analysis, 2023
            15.22.2.1. By Type
            15.22.2.2. By End Use
16. Market Structure Analysis
    16.1. Competition Dashboard
    16.2. Competition Benchmarking
    16.3. Market Share Analysis of Top Players
        16.3.1. By Regional
        16.3.2. By Type
        16.3.3. By End Use
17. Competition Analysis
    17.1. Competition Deep Dive
        17.1.1. Ashland Global Holdings, Inc
            17.1.1.1. Overview
            17.1.1.2. Product Portfolio
            17.1.1.3. Profitability by Market Segments
            17.1.1.4. Sales Footprint
            17.1.1.5. Strategy Overview
                17.1.1.5.1. Marketing Strategy
                17.1.1.5.2. Product Strategy
                17.1.1.5.3. Channel Strategy
        17.1.2. Colorcon
            17.1.2.1. Overview
            17.1.2.2. Product Portfolio
            17.1.2.3. Profitability by Market Segments
            17.1.2.4. Sales Footprint
            17.1.2.5. Strategy Overview
                17.1.2.5.1. Marketing Strategy
                17.1.2.5.2. Product Strategy
                17.1.2.5.3. Channel Strategy
        17.1.3. DKS Co. Ltd
            17.1.3.1. Overview
            17.1.3.2. Product Portfolio
            17.1.3.3. Profitability by Market Segments
            17.1.3.4. Sales Footprint
            17.1.3.5. Strategy Overview
                17.1.3.5.1. Marketing Strategy
                17.1.3.5.2. Product Strategy
                17.1.3.5.3. Channel Strategy
        17.1.4. Fenchem Biotek Ltd
            17.1.4.1. Overview
            17.1.4.2. Product Portfolio
            17.1.4.3. Profitability by Market Segments
            17.1.4.4. Sales Footprint
            17.1.4.5. Strategy Overview
                17.1.4.5.1. Marketing Strategy
                17.1.4.5.2. Product Strategy
                17.1.4.5.3. Channel Strategy
        17.1.5. Hebei Jiahua Cellulose Co., Ltd
            17.1.5.1. Overview
            17.1.5.2. Product Portfolio
            17.1.5.3. Profitability by Market Segments
            17.1.5.4. Sales Footprint
            17.1.5.5. Strategy Overview
                17.1.5.5.1. Marketing Strategy
                17.1.5.5.2. Product Strategy
                17.1.5.5.3. Channel Strategy
        17.1.6. J.M. Huber Corporation
            17.1.6.1. Overview
            17.1.6.2. Product Portfolio
            17.1.6.3. Profitability by Market Segments
            17.1.6.4. Sales Footprint
            17.1.6.5. Strategy Overview
                17.1.6.5.1. Marketing Strategy
                17.1.6.5.2. Product Strategy
                17.1.6.5.3. Channel Strategy
        17.1.7. J. RETTENMAIER SOHNE Gmbh
            17.1.7.1. Overview
            17.1.7.2. Product Portfolio
            17.1.7.3. Profitability by Market Segments
            17.1.7.4. Sales Footprint
            17.1.7.5. Strategy Overview
                17.1.7.5.1. Marketing Strategy
                17.1.7.5.2. Product Strategy
                17.1.7.5.3. Channel Strategy
        17.1.8. Lamberti S.p.A
            17.1.8.1. Overview
            17.1.8.2. Product Portfolio
            17.1.8.3. Profitability by Market Segments
            17.1.8.4. Sales Footprint
            17.1.8.5. Strategy Overview
                17.1.8.5.1. Marketing Strategy
                17.1.8.5.2. Product Strategy
                17.1.8.5.3. Channel Strategy
        17.1.9. LOTTE Fine Chemicals
            17.1.9.1. Overview
            17.1.9.2. Product Portfolio
            17.1.9.3. Profitability by Market Segments
            17.1.9.4. Sales Footprint
            17.1.9.5. Strategy Overview
                17.1.9.5.1. Marketing Strategy
                17.1.9.5.2. Product Strategy
                17.1.9.5.3. Channel Strategy
        17.1.10. Nouryon Chemical Holdings B.V
            17.1.10.1. Overview
            17.1.10.2. Product Portfolio
            17.1.10.3. Profitability by Market Segments
            17.1.10.4. Sales Footprint
            17.1.10.5. Strategy Overview
                17.1.10.5.1. Marketing Strategy
                17.1.10.5.2. Product Strategy
                17.1.10.5.3. Channel Strategy
18. Assumptions & Acronyms Used
19. Research Methodology
Recommendations

Chemicals & Materials

Esters Market

September 2023

REP-GB-1394

295 pages

Chemicals & Materials

Castor Oil Derivatives Market

May 2023

REP-GB-474

342 pages

Chemicals & Materials

Naphthalene Derivatives Market

November 2024

REP-GB-2332

Upcoming

Explore Chemicals & Materials Insights

View Reports
Future Market Insights

Cellulose Ether and Derivatives Market

Schedule a Call