Reports

- Global Locations -

Headquarters

Future Market Insights, Inc.

Christiana Corporate, 200
Continental Drive, Suite 401,
Newark, Delaware - 19713,
United States

T: +1-845-579-5705

Americas

Future Market Insights, Inc.

616 Corporate Way, Suite 2-9018,
Valley Cottage, NY 10989, United States

T: +1-347-918-3531

MEA

Future Market Insights

1602-6 Jumeirah Bay X2 Tower, Plot No: JLT-PH2-X2A,
Jumeirah Lakes Towers, Dubai,
United Arab Emirates

Europe

Future Market Insights

3rd Floor, 207 Regent Street,
W1B 3HH London
United Kingdom

T: + 44 (0) 20 8123 9659
D: +44 (0) 20 3287 4268

Asia Pacific

Future Market Insights

IndiaLand Global Tech Park, Unit UG-1, Behind Grand HighStreet, Phase 1, Hinjawadi, MH, Pune – 411057, India

Ethernet Access Device Market Snapshot (2022-2032)

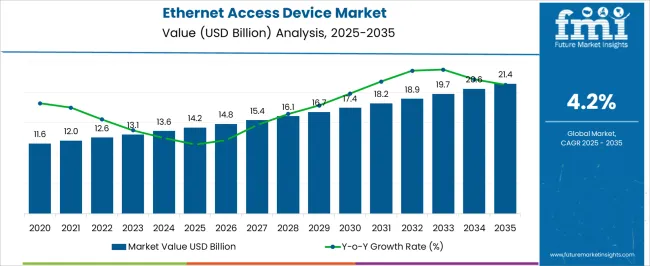
[306 Pages Report] The ethernet access device market is anticipated to be valued at US$ 12,556 Million in 2022, forecast to grow at a CAGR of 4.2% to be valued at US$ 18,977 Million from 2022 to 2032. Growth is attributed to increasing advancement in telecommunication. From 2016 to 2021 a CAGR of 3.3% was registered for the feed grade oils market.

Data Points Key Statistics
Growth Rate (2016-2021) 3.3% CAGR
Projected Growth Rate (2022 to 2032) 4.2% CAGR
Expected Market Value (2022) US$ 12,556 Million
Anticipated Forecast Value (2032) US$ 18,977 Million

Ethernet is a computer networking technology used to connect devices to communicate with each other through multiple protocols. Ethernet connectivity benefits almost every type of user, ranging from businesses to gamers, including security and reliability

Ethernet is a proven success in the wired local area network (LAN) environment. Apart from LAN, it can also be utilized in metropolitan area networks (MAN) and wide area networks (WAN) to make the services more scalable and flexible. Any device (whether in an office, school, or home setting) that accesses a localized network using a cable (wired connection) is most likely to use Ethernet. Ethernet service is standardized as per the working group IEEE 802.3.

Devices need to connect through physical cables and hence, it is very difficult for outsiders to access the network through an unsanctioned device and hijack the bandwidth. For a wireless LAN technology, Ethernet is less vulnerable to noise and disruptions, such as physical barriers, band interference, or bandwidth hogs. Over time, Ethernet has mostly replaced its other competing wired LAN technologies, such as Fiber Distributed Data Interface (FDDI), ARCNET`, and Token Ring.

Ethernet Access Devices (EADs) are compact carrier Ethernet fields that are employed to create high-quality and high-bandwidth packet service with low latency over multiple copper pairs for end-users (individual and business) by the communication/internet service providers.

Ethernet Access Device market is forecasted to witness a healthy double digit CAGR owing to exponential increase in adoption of Ethernet access device in telecom networks. Ethernet access device basically enhance the quality of network provided by service providers to customers increasing the customer satisfaction.

Don't pay for what you don't need

Customize your report by selecting specific countries or regions and save 30%!

Which are Some Prominent Drivers Spearheading Ethernet Access Devices Market Growth?

Growing Adoption of Ethernet Access Device in Telecom to Drive the Growth of the Market

Increasing adoption of Ethernet access device in telecom networks backhaul and decrease in price of Ethernet access device are the main drivers for the market growth. In addition to this, the Ethernet access device enables the service providers to deliver high-bandwidth and high-quality Carrier Ethernet services with low delay over multiple copper pairs to customers.

This is a cost-effective solution for service provider to enhance the quality when users increase. Also customer uptake of Ethernet connections and services is the driving factor for the growth of the market. Rising luxuries with advancing technologies in cellular connectivity drives the market growth. Having a fast Ethernet connection to obtain all the data in real time is the need of the day. The real time transfer of information is required in all the applications from a simple transfer of message to navigation in real time.

These conditions dominate the life of the fast paced modern world giving rise to an increased demand for such devices like Ethernet access device, which boost the quality of network even when the people using the network increases exponentially.

What are the Challenges Faced by the Ethernet Access Devices Industry?

High Implementation Cost May Hinder the Grow of the Market

Although the ethernet access device market has numerous end-uses, there are numerous obstacles that likely pose a challenge to market growth. The high implementation cost and long-term return on investment are some of the factors that can restrain the growth of the global Ethernet Access Device market.

Factors are hindering the growth of the global ethernet access device market, are fluctuating price of raw materials being used to manufacture switches and the presence of low-quality cheap products by other manufacturers in the market key restraints of the global Ethernet access device market.

Sudip Saha
Sudip Saha

Principal Consultant

Talk to Analyst

Find your sweet spots for generating winning opportunities in this market.

Why is North America Emerging as an Opportunistic Ethernet Access Devices Market?

Presence of Leading Market Players in the Region Provide Opportunity for the Growth of the Market

North America dominated the global ethernet access device market in 2022. North America accounts for a market share of 29.0% in the global Ethernet access device market.

The U.S. is offering the opportunity for revenue generation over the forecast period, owing to the introduction of advanced technologies and increasing investment by companies in various sectors for smart production techniques and process automation.

North America hosts corporate complexes more than the rest of the world. All corporate consumers want a private network loop from their service providers in order to allay security concerns. LAN effectively addresses this security concern, which is mostly deployed on EADs. The demand for wireless hotspots and Wi-Fi solutions and services is expected to increase due to the rise in wireless technology investments by the major companies in this region.
How is Europe Contributing to the Growth of the Ethernet Access Devices Market?

Rise in Adoption of 5G Technology to propel adoption of Ethernet Access Devices

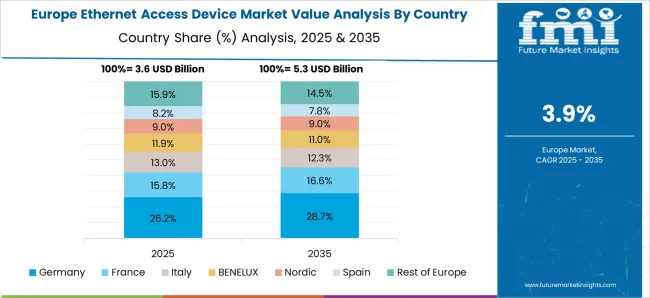
According to Future Market Insights, Europe is expected to provide immense growth opportunities for the ethernet access device market, owing to presence of significant number of leading market players in the region. The Europe ethernet access device market accounts for 25.4% share of the total global market.

The increasing demand for higher bandwidth internet connection, rise in adoption of 5G technology, an increasing number of data centers, and digitalization of businesses to boost the growth of the market in the region.

Get the data you need at a Fraction of the cost

Personalize your report by choosing insights you need
and save 40%!

Will the Asia Pacific emerge as an Attractive Ethernet Access Devices Market?

Increasing Advancements in Telecommunications to Boost the Ethernet Access Device Market

The ethernet access device market in the Asia Pacific is projected to expand at a rapid pace during the forecast period. The Asia Pacific, which follows North America, are expected to witness an increase in demand for Ethernet access device in the near future, as the demand for reliable, fast, and high-speed internet is rising in these regions.

The growing emergence of power over Ethernet (PoE) in various industries is projected to offer remunerative opportunities to the Ethernet access device market in Asia Pacific. Technological advancement in the telecommunication sector in the region to boost the Ethernet access device market.

Start-up Scenario

The new entrants in the ethernet access device market are continually indulging in several collaborations and highly investing in research and development activities to provide more convenient solutions to industry verticals. Some of the major start-ups that are leading the development of the market are – Nimbus Technology, SecureTel Networks Inc., Embsys Technologies Private Limited
  • Embsys Technologies Private Limited - Established in the year 2009, “Embsys Technologies Pvt Ltd”, are involved as the manufacturer and trader of Electrical Resistor, Development Board, Sensor Component, Wireless Module, and many more. These products are provided with best quality to ensure total customer satisfaction. We also render PCB Router Installation Service, PCB Router Maintenance Service and PCB Router Repairing Service.

Ethernet Access Device Market: Competition Landscape

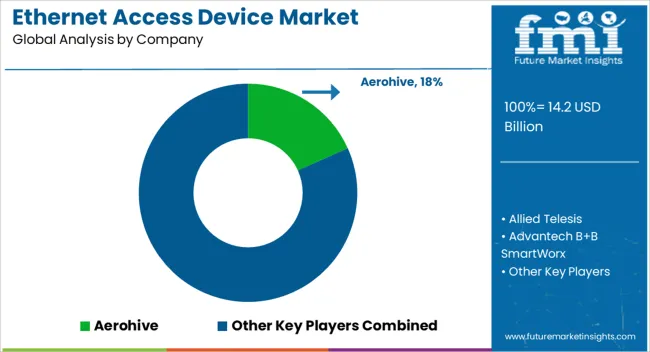
Some of the key participants present in the global ethernet access device market include Aerohive, Allied Telesis, Advantech B+B SmartWorx, Ericsson, Huawei, Mellanox Technologies, Moxa, NEC, NETGEAR, Oracle, PLANET Technology, Siemens, Telco Systems, Westermo (Beijer Electronics Group), ZTE among others.

Attributed to the presence of such a high number of participants, the market is highly competitive. While global players such as Aerohive, Allied Telesis, Advantech B+B SmartWorx, Ericsson account for considerable market size, several regional-level players are also operating across key growth regions, particularly in the Asia Pacific

  • In August 2022 - Rapid direct connections to Oracle Cloud Infrastructure (OCI) are now available to help Internet2 member institutions make a move to the cloud. Through an Internet2 Cloud Connect dedicated network connection, institutions can utilize their existing Internet2 connections to extend their data center to OCI in a matter of days for no additional fee from Internet2 for up to 5Gbps.
  • B+B SmartWorx powered by Advantech introduced its Ethernet switch Security Pack enhancement, which helps defend users from malicious attacks and confidential information leakage more than ever before. The new Security Pack enhancement is available with all EKI-7700 managed Ethernet switches.

Report Scope

Report Attribute Details
Growth Rate CAGR of 4.2% from 2022 to 2032
Expected Market Value (2022) US$ 12556.0 Million
Anticipated Forecast Value (2032) US$ 18977.0 Million
Base Year for Estimation 2021
Historical Data 2016-2021
Forecast Period 2022-2032
Quantitative Units Revenue in US$ Million and CAGR from 2022-2032
Report Coverage Revenue Forecast, Volume Forecast, Company Ranking, Competitive Landscape, Growth Factors, Trends and Pricing Analysis
Segments Covered
  • Product
  • Region
Regions Covered
  • North America
  • Latin America
  • Europe
  • Asia Pacific
  • Middle East and Africa
Key Countries Profiled
  • USA
  • Canada
  • Mexico
  • Brazil
  • Germany
  • Italy
  • France
  • UK
  • Spain
  • Russia
  • China
  • Japan
  • South Korea
  • Australia
  • Saudi Arabia
  • South Africa
  • UAE
  • Israel
Key Companies Profiled
  • Aerohive
  • Allied Telesis
  • Advantech B+B SmartWorx
  • Ericsson
  • Huawei
  • Mellanox Technologies
  • Moxa
  • NEC
  • NETGEAR
  • Oracle
  • PLANET Technology
  • Siemens
  • Telco Systems
  • Westermo (Beijer Electronics Group), ZTE
Customization Available Upon Request

Key Segments Profiled in the Ethernet Access Device Industry Survey

Ethernet Access Device Market by Product:

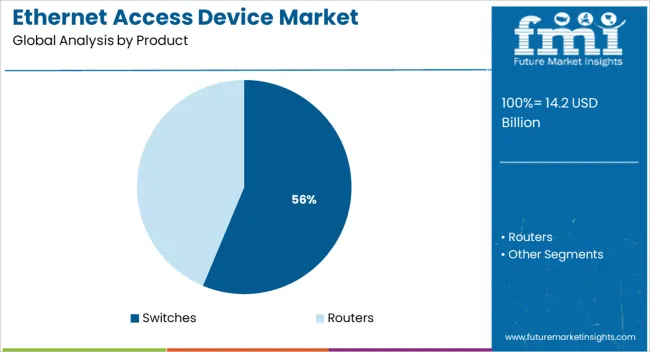
  • Switches
  • Routers

Ethernet Access Device Market by Region:

  • North America Ethernet Access Device Market
  • Latin America Ethernet Access Device Market
  • Europe Ethernet Access Device Market
  • Asia Pacific Ethernet Access Device Market
  • Middle East and Africa Ethernet Access Device Market

Frequently Asked Questions

What is the anticipated growth of the ethernet access device market until 2032?

FMI projects the global ethernet access device market to expand at a 4.2% value CAGR by 2032.

Which region is forecast to be the most lucrative for ethernet access device market growth?

North America is expected to be the most opportunistic with a 29.0% share of the total ethernet access device market.

Which are some prominent ethernet access device market manufacturers?

Aerohive, Allied Telesis, Advantech B+B SmartWorx, Ericsson, Huawei are some prominent ethernet access device, market manufacturers.

Table of Content

1. Executive Summary

    1.1. Global Market Outlook

    1.2. Demand-side Trends

    1.3. Supply-side Trends

    1.4. Technology Roadmap Analysis

    1.5. Analysis and Recommendations

2. Market Overview

    2.1. Market Coverage / Taxonomy

    2.2. Market Definition / Scope / Limitations

3. Market Background

    3.1. Market Dynamics

        3.1.1. Drivers

        3.1.2. Restraints

        3.1.3. Opportunity

        3.1.4. Trends

    3.2. Scenario Forecast

        3.2.1. Demand in Optimistic Scenario

        3.2.2. Demand in Likely Scenario

        3.2.3. Demand in Conservative Scenario

    3.3. Opportunity Map Analysis

    3.4. Product Life Cycle Analysis

    3.5. Supply Chain Analysis

        3.5.1. Supply Side Participants and their Roles

            3.5.1.1. Producers

            3.5.1.2. Mid-Level Participants (Traders/ Agents/ Brokers)

            3.5.1.3. Wholesalers and Distributors

        3.5.2. Value Added and Value Created at Node in the Supply Chain

        3.5.3. List of Raw Material Suppliers

        3.5.4. List of Existing and Potential Buyer’s

    3.6. Investment Feasibility Matrix

    3.7. Value Chain Analysis

        3.7.1. Profit Margin Analysis

        3.7.2. Wholesalers and Distributors

        3.7.3. Retailers

    3.8. PESTLE and Porter’s Analysis

    3.9. Regulatory Landscape

        3.9.1. By Key Regions

        3.9.2. By Key Countries

    3.10. Regional Parent Market Outlook

    3.11. Production and Consumption Statistics

    3.12. Import and Export Statistics

4. Global Ethernet Access Device Market Analysis 2016-2021 and Forecast, 2022-2032

    4.1. Historical Market Size Value (US$ Mn) Analysis, 2016-2021

    4.2. Current and Future Market Size Value (US$ Mn) Projections, 2022-2032

        4.2.1. Y-o-Y Growth Trend Analysis

        4.2.2. Absolute $ Opportunity Analysis

5. Global Ethernet Access Device Market Analysis 2016-2021 and Forecast 2022-2032, By Product

    5.1. Introduction / Key Findings

    5.2. Historical Market Size Value (US$ Mn) Analysis By Product, 2016-2021

    5.3. Current and Future Market Size Value (US$ Mn) Analysis and Forecast By Product, 2022-2032

        5.3.1. Switches

        5.3.2. Routers

    5.4. Y-o-Y Growth Trend Analysis By Product, 2016-2021

    5.5. Absolute $ Opportunity Analysis By Product, 2022-2032

6. Global Ethernet Access Device Market Analysis 2016-2021 and Forecast 2022-2032, By Region

    6.1. Introduction

    6.2. Historical Market Size Value (US$ Mn) Analysis By Region, 2016-2021

    6.3. Current Market Size Value (US$ Mn) Analysis and Forecast By Region, 2022-2032

        6.3.1. North America

        6.3.2. Latin America

        6.3.3. Europe

        6.3.4. Asia Pacific

        6.3.5. MEA

    6.4. Market Attractiveness Analysis By Region

7. North America Ethernet Access Device Market Analysis 2016-2021 and Forecast 2022-2032, By Country

    7.1. Historical Market Size Value (US$ Mn) Trend Analysis By Market Taxonomy, 2016-2021

    7.2. Market Size Value (US$ Mn) Forecast By Market Taxonomy, 2022-2032

        7.2.1. By Country

            7.2.1.1. U.S.

            7.2.1.2. Canada

        7.2.2. By Product

    7.3. Market Attractiveness Analysis

        7.3.1. By Country

        7.3.2. By Product

    7.4. Key Takeaways

8. Latin America Ethernet Access Device Market Analysis 2016-2021 and Forecast 2022-2032, By Country

    8.1. Historical Market Size Value (US$ Mn) Trend Analysis By Market Taxonomy, 2016-2021

    8.2. Market Size Value (US$ Mn) Forecast By Market Taxonomy, 2022-2032

        8.2.1. By Country

            8.2.1.1. Brazil

            8.2.1.2. Mexico

            8.2.1.3. Rest of Latin America

        8.2.2. By Product

    8.3. Market Attractiveness Analysis

        8.3.1. By Country

        8.3.2. By Product

    8.4. Key Takeaways

9. Europe Ethernet Access Device Market Analysis 2016-2021 and Forecast 2022-2032, By Country

    9.1. Historical Market Size Value (US$ Mn) Trend Analysis By Market Taxonomy, 2016-2021

    9.2. Market Size Value (US$ Mn) Forecast By Market Taxonomy, 2022-2032

        9.2.1. By Country

            9.2.1.1. Germany

            9.2.1.2. U.K.

            9.2.1.3. France

            9.2.1.4. Spain

            9.2.1.5. Italy

            9.2.1.6. Russia

            9.2.1.7. Rest of Europe

        9.2.2. By Product

    9.3. Market Attractiveness Analysis

        9.3.1. By Country

        9.3.2. By Product

    9.4. Key Takeaways

10. Asia Pacific Ethernet Access Device Market Analysis 2016-2021 and Forecast 2022-2032, By Country

    10.1. Historical Market Size Value (US$ Mn) Trend Analysis By Market Taxonomy, 2016-2021

    10.2. Market Size Value (US$ Mn) Forecast By Market Taxonomy, 2022-2032

        10.2.1. By Country

            10.2.1.1. China

            10.2.1.2. Japan

            10.2.1.3. India

            10.2.1.4. South Korea

            10.2.1.5. Australia

            10.2.1.6. Rest of APAC

        10.2.2. By Product

    10.3. Market Attractiveness Analysis

        10.3.1. By Country

        10.3.2. By Product

    10.4. Key Takeaways

11. MEA Ethernet Access Device Market Analysis 2016-2021 and Forecast 2022-2032, By Country

    11.1. Historical Market Size Value (US$ Mn) Trend Analysis By Market Taxonomy, 2016-2021

    11.2. Market Size Value (US$ Mn) Forecast By Market Taxonomy, 2022-2032

        11.2.1. By Country

            11.2.1.1. South Africa

            11.2.1.2. Saudi Arabia

            11.2.1.3. UAE

            11.2.1.4. Israel

            11.2.1.5. Rest of MEA

        11.2.2. By Product

    11.3. Market Attractiveness Analysis

        11.3.1. By Country

        11.3.2. By Product

    11.4. Key Takeaways

12. Key Countries Ethernet Access Device Market Analysis

    12.1. Value (US$ Mn) ed States

        12.1.1. Pricing Analysis

        12.1.2. Market Share Analysis, 2021

            12.1.2.1. By Product

    12.2. Canada

        12.2.1. Pricing Analysis

        12.2.2. Market Share Analysis, 2021

            12.2.2.1. By Product

    12.3. Brazil

        12.3.1. Pricing Analysis

        12.3.2. Market Share Analysis, 2021

            12.3.2.1. By Product

    12.4. Mexico

        12.4.1. Pricing Analysis

        12.4.2. Market Share Analysis, 2021

            12.4.2.1. By Product

    12.5. Germany

        12.5.1. Pricing Analysis

        12.5.2. Market Share Analysis, 2021

            12.5.2.1. By Product

    12.6. U.K.

        12.6.1. Pricing Analysis

        12.6.2. Market Share Analysis, 2021

            12.6.2.1. By Product

    12.7. France

        12.7.1. Pricing Analysis

        12.7.2. Market Share Analysis, 2021

            12.7.2.1. By Product

    12.8. Spain

        12.8.1. Pricing Analysis

        12.8.2. Market Share Analysis, 2021

            12.8.2.1. By Product

    12.9. Italy

        12.9.1. Pricing Analysis

        12.9.2. Market Share Analysis, 2021

            12.9.2.1. By Product

    12.10. Russia

        12.10.1. Pricing Analysis

        12.10.2. Market Share Analysis, 2021

            12.10.2.1. By Product

    12.11. China

        12.11.1. Pricing Analysis

        12.11.2. Market Share Analysis, 2021

            12.11.2.1. By Product

    12.12. Japan

        12.12.1. Pricing Analysis

        12.12.2. Market Share Analysis, 2021

            12.12.2.1. By Product

    12.13. India

        12.13.1. Pricing Analysis

        12.13.2. Market Share Analysis, 2021

            12.13.2.1. By Product

    12.14. South Korea

        12.14.1. Pricing Analysis

        12.14.2. Market Share Analysis, 2021

            12.14.2.1. By Product

    12.15. Australia

        12.15.1. Pricing Analysis

        12.15.2. Market Share Analysis, 2021

            12.15.2.1. By Product

    12.16. South Africa

        12.16.1. Pricing Analysis

        12.16.2. Market Share Analysis, 2021

            12.16.2.1. By Product

    12.17. Saudi Arabia

        12.17.1. Pricing Analysis

        12.17.2. Market Share Analysis, 2021

            12.17.2.1. By Product

    12.18. UAE

        12.18.1. Pricing Analysis

        12.18.2. Market Share Analysis, 2021

            12.18.2.1. By Product

    12.19. Israel

        12.19.1. Pricing Analysis

        12.19.2. Market Share Analysis, 2021

            12.19.2.1. By Product

13. Market Structure Analysis

    13.1. Competition Dashboard

    13.2. Competition Benchmarking

    13.3. Market Share Analysis of Top Players

        13.3.1. By Regional

        13.3.2. By Product

14. Competition Analysis

    14.1. Competition Deep Dive

        14.1.1. Aerohive

            14.1.1.1. Overview

            14.1.1.2. Product Portfolio

            14.1.1.3. Profitability by Market Segments

            14.1.1.4. Sales Footprint

            14.1.1.5. Strategy Overview

                14.1.1.5.1. Marketing Strategy

                14.1.1.5.2. Product Strategy

                14.1.1.5.3. Channel Strategy

        14.1.2. Allied Telesis

            14.1.2.1. Overview

            14.1.2.2. Product Portfolio

            14.1.2.3. Profitability by Market Segments

            14.1.2.4. Sales Footprint

            14.1.2.5. Strategy Overview

                14.1.2.5.1. Marketing Strategy

                14.1.2.5.2. Product Strategy

                14.1.2.5.3. Channel Strategy

        14.1.3. Advantech B+B SmartWorx

            14.1.3.1. Overview

            14.1.3.2. Product Portfolio

            14.1.3.3. Profitability by Market Segments

            14.1.3.4. Sales Footprint

            14.1.3.5. Strategy Overview

                14.1.3.5.1. Marketing Strategy

                14.1.3.5.2. Product Strategy

                14.1.3.5.3. Channel Strategy

        14.1.4. Ericsson

            14.1.4.1. Overview

            14.1.4.2. Product Portfolio

            14.1.4.3. Profitability by Market Segments

            14.1.4.4. Sales Footprint

            14.1.4.5. Strategy Overview

                14.1.4.5.1. Marketing Strategy

                14.1.4.5.2. Product Strategy

                14.1.4.5.3. Channel Strategy

        14.1.5. A. Huawei

            14.1.5.1. Overview

            14.1.5.2. Product Portfolio

            14.1.5.3. Profitability by Market Segments

            14.1.5.4. Sales Footprint

            14.1.5.5. Strategy Overview

                14.1.5.5.1. Marketing Strategy

                14.1.5.5.2. Product Strategy

                14.1.5.5.3. Channel Strategy

        14.1.6. Mellanox Technologies

            14.1.6.1. Overview

            14.1.6.2. Product Portfolio

            14.1.6.3. Profitability by Market Segments

            14.1.6.4. Sales Footprint

            14.1.6.5. Strategy Overview

                14.1.6.5.1. Marketing Strategy

                14.1.6.5.2. Product Strategy

                14.1.6.5.3. Channel Strategy

        14.1.7. Oracle

            14.1.7.1. Overview

            14.1.7.2. Product Portfolio

            14.1.7.3. Profitability by Market Segments

            14.1.7.4. Sales Footprint

            14.1.7.5. Strategy Overview

                14.1.7.5.1. Marketing Strategy

                14.1.7.5.2. Product Strategy

                14.1.7.5.3. Channel Strategy

        14.1.8. PLANET Technology 

            14.1.8.1. Overview

            14.1.8.2. Product Portfolio

            14.1.8.3. Profitability by Market Segments

            14.1.8.4. Sales Footprint

            14.1.8.5. Strategy Overview

                14.1.8.5.1. Marketing Strategy

                14.1.8.5.2. Product Strategy

                14.1.8.5.3. Channel Strategy

        14.1.9. Siemens

            14.1.9.1. Overview

            14.1.9.2. Product Portfolio

            14.1.9.3. Profitability by Market Segments

            14.1.9.4. Sales Footprint

            14.1.9.5. Strategy Overview

                14.1.9.5.1. Marketing Strategy

                14.1.9.5.2. Product Strategy

                14.1.9.5.3. Channel Strategy

        14.1.10. Telco Systems

            14.1.10.1. Overview

            14.1.10.2. Product Portfolio

            14.1.10.3. Profitability by Market Segments

            14.1.10.4. Sales Footprint

            14.1.10.5. Strategy Overview

                14.1.10.5.1. Marketing Strategy

                14.1.10.5.2. Product Strategy

                14.1.10.5.3. Channel Strategy

15. Assumptions & Acronyms Used

16. Research Methodology

Don't pay for what you don't need

Customize your report by selecting specific countries or regions and save 30%!

List of Tables

Table 1: Global Ethernet Access Device Market Value (US$ Mn) Forecast by Region, 2016-2032

Table 2: Global Ethernet Access Device Market Volume (Units) Forecast by Region, 2016-2032

Table 3: Global Ethernet Access Device Market Value (US$ Mn) Forecast by Product, 2016-2032

Table 4: Global Ethernet Access Device Market Volume (Units) Forecast by Product, 2016-2032

Table 5: North America Ethernet Access Device Market Value (US$ Mn) Forecast by Country, 2016-2032

Table 6: North America Ethernet Access Device Market Volume (Units) Forecast by Country, 2016-2032

Table 7: North America Ethernet Access Device Market Value (US$ Mn) Forecast by Product, 2016-2032

Table 8: North America Ethernet Access Device Market Volume (Units) Forecast by Product, 2016-2032

Table 9: Latin America Ethernet Access Device Market Value (US$ Mn) Forecast by Country, 2016-2032

Table 10: Latin America Ethernet Access Device Market Volume (Units) Forecast by Country, 2016-2032

Table 11: Latin America Ethernet Access Device Market Value (US$ Mn) Forecast by Product, 2016-2032

Table 12: Latin America Ethernet Access Device Market Volume (Units) Forecast by Product, 2016-2032

Table 13: Europe Ethernet Access Device Market Value (US$ Mn) Forecast by Country, 2016-2032

Table 14: Europe Ethernet Access Device Market Volume (Units) Forecast by Country, 2016-2032

Table 15: Europe Ethernet Access Device Market Value (US$ Mn) Forecast by Product, 2016-2032

Table 16: Europe Ethernet Access Device Market Volume (Units) Forecast by Product, 2016-2032

Table 17: Asia Pacific Ethernet Access Device Market Value (US$ Mn) Forecast by Country, 2016-2032

Table 18: Asia Pacific Ethernet Access Device Market Volume (Units) Forecast by Country, 2016-2032

Table 19: Asia Pacific Ethernet Access Device Market Value (US$ Mn) Forecast by Product, 2016-2032

Table 20: Asia Pacific Ethernet Access Device Market Volume (Units) Forecast by Product, 2016-2032

Table 21: MEA Ethernet Access Device Market Value (US$ Mn) Forecast by Country, 2016-2032

Table 22: MEA Ethernet Access Device Market Volume (Units) Forecast by Country, 2016-2032

Table 23: MEA Ethernet Access Device Market Value (US$ Mn) Forecast by Product, 2016-2032

Table 24: MEA Ethernet Access Device Market Volume (Units) Forecast by Product, 2016-2032
Sudip Saha
Sudip Saha

Principal Consultant

Talk to Analyst

Find your sweet spots for generating winning opportunities in this market.

List of Charts

Figure 1: Global Ethernet Access Device Market Value (US$ Mn) by Product, 2022-2032

Figure 2: Global Ethernet Access Device Market Value (US$ Mn) by Region, 2022-2032

Figure 3: Global Ethernet Access Device Market Value (US$ Mn) Analysis by Region, 2016-2032

Figure 4: Global Ethernet Access Device Market Volume (Units) Analysis by Region, 2016-2032

Figure 5: Global Ethernet Access Device Market Value Share (%) and BPS Analysis by Region, 2022-2032

Figure 6: Global Ethernet Access Device Market Y-o-Y Growth (%) Projections by Region, 2022-2032

Figure 7: Global Ethernet Access Device Market Value (US$ Mn) Analysis by Product, 2016-2032

Figure 8: Global Ethernet Access Device Market Volume (Units) Analysis by Product, 2016-2032

Figure 9: Global Ethernet Access Device Market Value Share (%) and BPS Analysis by Product, 2022-2032

Figure 10: Global Ethernet Access Device Market Y-o-Y Growth (%) Projections by Product, 2022-2032

Figure 11: Global Ethernet Access Device Market Attractiveness by Product, 2022-2032

Figure 12: Global Ethernet Access Device Market Attractiveness by Region, 2022-2032

Figure 13: North America Ethernet Access Device Market Value (US$ Mn) by Product, 2022-2032

Figure 14: North America Ethernet Access Device Market Value (US$ Mn) by Country, 2022-2032

Figure 15: North America Ethernet Access Device Market Value (US$ Mn) Analysis by Country, 2016-2032

Figure 16: North America Ethernet Access Device Market Volume (Units) Analysis by Country, 2016-2032

Figure 17: North America Ethernet Access Device Market Value Share (%) and BPS Analysis by Country, 2022-2032

Figure 18: North America Ethernet Access Device Market Y-o-Y Growth (%) Projections by Country, 2022-2032

Figure 19: North America Ethernet Access Device Market Value (US$ Mn) Analysis by Product, 2016-2032

Figure 20: North America Ethernet Access Device Market Volume (Units) Analysis by Product, 2016-2032

Figure 21: North America Ethernet Access Device Market Value Share (%) and BPS Analysis by Product, 2022-2032

Figure 22: North America Ethernet Access Device Market Y-o-Y Growth (%) Projections by Product, 2022-2032

Figure 23: North America Ethernet Access Device Market Attractiveness by Product, 2022-2032

Figure 24: North America Ethernet Access Device Market Attractiveness by Country, 2022-2032

Figure 25: Latin America Ethernet Access Device Market Value (US$ Mn) by Product, 2022-2032

Figure 26: Latin America Ethernet Access Device Market Value (US$ Mn) by Country, 2022-2032

Figure 27: Latin America Ethernet Access Device Market Value (US$ Mn) Analysis by Country, 2016-2032

Figure 28: Latin America Ethernet Access Device Market Volume (Units) Analysis by Country, 2016-2032

Figure 29: Latin America Ethernet Access Device Market Value Share (%) and BPS Analysis by Country, 2022-2032

Figure 30: Latin America Ethernet Access Device Market Y-o-Y Growth (%) Projections by Country, 2022-2032

Figure 31: Latin America Ethernet Access Device Market Value (US$ Mn) Analysis by Product, 2016-2032

Figure 32: Latin America Ethernet Access Device Market Volume (Units) Analysis by Product, 2016-2032

Figure 33: Latin America Ethernet Access Device Market Value Share (%) and BPS Analysis by Product, 2022-2032

Figure 34: Latin America Ethernet Access Device Market Y-o-Y Growth (%) Projections by Product, 2022-2032

Figure 35: Latin America Ethernet Access Device Market Attractiveness by Product, 2022-2032

Figure 36: Latin America Ethernet Access Device Market Attractiveness by Country, 2022-2032

Figure 37: Europe Ethernet Access Device Market Value (US$ Mn) by Product, 2022-2032

Figure 38: Europe Ethernet Access Device Market Value (US$ Mn) by Country, 2022-2032

Figure 39: Europe Ethernet Access Device Market Value (US$ Mn) Analysis by Country, 2016-2032

Figure 40: Europe Ethernet Access Device Market Volume (Units) Analysis by Country, 2016-2032

Figure 41: Europe Ethernet Access Device Market Value Share (%) and BPS Analysis by Country, 2022-2032

Figure 42: Europe Ethernet Access Device Market Y-o-Y Growth (%) Projections by Country, 2022-2032

Figure 43: Europe Ethernet Access Device Market Value (US$ Mn) Analysis by Product, 2016-2032

Figure 44: Europe Ethernet Access Device Market Volume (Units) Analysis by Product, 2016-2032

Figure 45: Europe Ethernet Access Device Market Value Share (%) and BPS Analysis by Product, 2022-2032

Figure 46: Europe Ethernet Access Device Market Y-o-Y Growth (%) Projections by Product, 2022-2032

Figure 47: Europe Ethernet Access Device Market Attractiveness by Product, 2022-2032

Figure 48: Europe Ethernet Access Device Market Attractiveness by Country, 2022-2032

Figure 49: Asia Pacific Ethernet Access Device Market Value (US$ Mn) by Product, 2022-2032

Figure 50: Asia Pacific Ethernet Access Device Market Value (US$ Mn) by Country, 2022-2032

Figure 51: Asia Pacific Ethernet Access Device Market Value (US$ Mn) Analysis by Country, 2016-2032

Figure 52: Asia Pacific Ethernet Access Device Market Volume (Units) Analysis by Country, 2016-2032

Figure 53: Asia Pacific Ethernet Access Device Market Value Share (%) and BPS Analysis by Country, 2022-2032

Figure 54: Asia Pacific Ethernet Access Device Market Y-o-Y Growth (%) Projections by Country, 2022-2032

Figure 55: Asia Pacific Ethernet Access Device Market Value (US$ Mn) Analysis by Product, 2016-2032

Figure 56: Asia Pacific Ethernet Access Device Market Volume (Units) Analysis by Product, 2016-2032

Figure 57: Asia Pacific Ethernet Access Device Market Value Share (%) and BPS Analysis by Product, 2022-2032

Figure 58: Asia Pacific Ethernet Access Device Market Y-o-Y Growth (%) Projections by Product, 2022-2032

Figure 59: Asia Pacific Ethernet Access Device Market Attractiveness by Product, 2022-2032

Figure 60: Asia Pacific Ethernet Access Device Market Attractiveness by Country, 2022-2032

Figure 61: MEA Ethernet Access Device Market Value (US$ Mn) by Product, 2022-2032

Figure 62: MEA Ethernet Access Device Market Value (US$ Mn) by Country, 2022-2032

Figure 63: MEA Ethernet Access Device Market Value (US$ Mn) Analysis by Country, 2016-2032

Figure 64: MEA Ethernet Access Device Market Volume (Units) Analysis by Country, 2016-2032

Figure 65: MEA Ethernet Access Device Market Value Share (%) and BPS Analysis by Country, 2022-2032

Figure 66: MEA Ethernet Access Device Market Y-o-Y Growth (%) Projections by Country, 2022-2032

Figure 67: MEA Ethernet Access Device Market Value (US$ Mn) Analysis by Product, 2016-2032

Figure 68: MEA Ethernet Access Device Market Volume (Units) Analysis by Product, 2016-2032

Figure 69: MEA Ethernet Access Device Market Value Share (%) and BPS Analysis by Product, 2022-2032

Figure 70: MEA Ethernet Access Device Market Y-o-Y Growth (%) Projections by Product, 2022-2032

Figure 71: MEA Ethernet Access Device Market Attractiveness by Product, 2022-2032

Figure 72: MEA Ethernet Access Device Market Attractiveness by Country, 2022-2032

Recommendations

Technology

Ethernet Storage Fabric Market

Published : February 2023

Technology

SP Routing And Ethernet Switching Market

Published : January 2023

Automotive

In-Vehicle Ethernet System Market

Published : December 2022

Technology

Ethernet Backhaul Equipment Market

Published : September 2022

Explore Technology Insights

View Reports

Ethernet Access Device Market