Access Control as a Service Market Size and Share Forecast Outlook 2025 to 2035
The Access Control as a Service Market is estimated to be valued at USD 12.4 billion in 2025 and is projected to reach USD 29.1 billion by 2035, registering a compound annual growth rate (CAGR) of 8.8% over the forecast period.
Quick Stats for Access Control as a Service Market
- Access Control as a Service Market Industry Value (2025): USD 12.4 billion
- Access Control as a Service Market Forecast Value (2035): USD 29.1 billion
- Access Control as a Service Market Forecast CAGR: 8.8%
- Leading Segment in Access Control as a Service Market in 2025: Authentication System (34.2%)
- Key Growth Region in Access Control as a Service Market: North America, Asia-Pacific, Europe
- Top Key Players in Access Control as a Service Market: Oracle Corporation, Workable Software Ltd., Grupo Navent S.R.L, GUPY Tecnologia Em Recrutamento LTDA, ApplicantStack, iCIMS, Inc, ClearCompany, Pemasys, Greenhouse Software, Inc., Jobvite Inc., Automatic Data Processing, Inc., SAP SE, Hyrell, Bullhorn, Inc., 4Talent, Kenoby
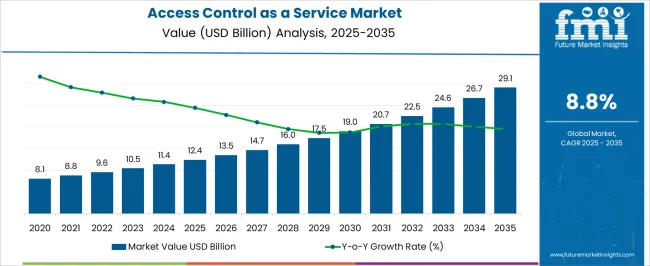
| Metric |
Value |
| Access Control as a Service Market Estimated Value in (2025 E) |
USD 12.4 billion |
| Access Control as a Service Market Forecast Value in (2035 F) |
USD 29.1 billion |
| Forecast CAGR (2025 to 2035) |
8.8% |
Rationale for Segmental Growth in the Access Control as a Service Market
The access control as a service (ACaaS) market is gaining momentum, supported by the growing shift from on-premise security systems to cloud-based solutions that enhance flexibility, scalability, and cost efficiency. Increasing concerns regarding data security, workplace safety, and regulatory compliance have accelerated adoption across industries.
Cloud-based access systems enable remote management, real-time monitoring, and seamless integration with video surveillance and identity management platforms, enhancing overall operational efficiency. Small and medium enterprises benefit from reduced upfront costs, while large organizations adopt ACaaS to unify multi-site security under centralized control.
The current market is characterized by rapid technological advancements, including biometrics, AI-driven analytics, and multi-factor authentication, which enhance reliability and user experience. With the rising adoption of smart infrastructure and growing need for subscription-based models, ACaaS is positioned for strong future growth.
Segmental Analysis
Insights into the Authentication System Segment
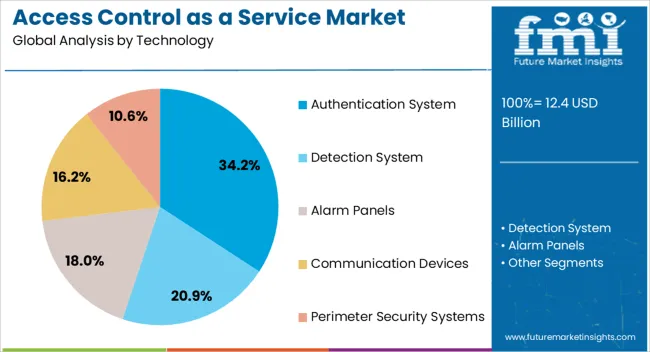
The authentication system segment holds approximately 34.20% share in the technology category of the ACaaS market. Its leadership is underpinned by the critical role of authentication in verifying and securing user identities across diverse entry points.
The segment benefits from rapid adoption of biometric technologies, including fingerprint and facial recognition, which enhance reliability and reduce risks associated with traditional credentials. Multi-factor authentication, combining physical and digital verification methods, has further strengthened demand.
The segment’s prominence is reinforced by regulatory pressure to ensure data protection and safeguard access to sensitive environments. With advancements in AI and machine learning enhancing accuracy and reducing false acceptance rates, the authentication system segment is expected to sustain its significant share in the coming years.
Insights into the Commercial Segment
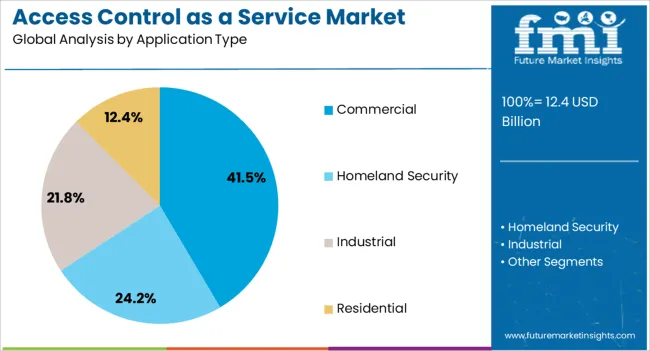
The commercial segment dominates the application type category with approximately 41.50% share, reflecting high adoption across offices, retail spaces, and institutional buildings. Businesses prioritize ACaaS solutions to improve operational security, prevent unauthorized entry, and streamline employee access management.
Cloud deployment models enable commercial entities to scale security systems in line with workforce growth and location expansion. The segment benefits from increased demand for hybrid work environments, where secure, remote, and flexible access solutions are essential.
Cost efficiency and simplified management offered by subscription-based models further encourage adoption. With the growing emphasis on workplace safety and compliance with security regulations, the commercial segment is expected to maintain its leadership throughout the forecast period.
Key Opportunities in the Access Control as a Service Market
- The rising demand for cloud-based security solutions that provide cost-effective and scalable access control services is boosting the market. The growing trend of smart cities, which require advanced access control systems to ensure the safety and security of citizens, is also expected to raise market revenue over the forecast period.
- The increasing adoption of mobile devices and IoT technologies is expected to drive the demand for access control-as-a-service solutions that can be easily integrated with these technologies. Overall, the access control-as-a-service market offers immense growth potential for businesses that can provide innovative and reliable solutions to meet the evolving security needs of customers across various industries.
- The growing trend of smart homes, which require advanced access control systems to ensure the safety and security of homeowners and their families, drives market growth.
- The need for integrated access control systems that can be seamlessly integrated with other security and surveillance systems to provide a comprehensive and cohesive security solution also generates opportunities for market players.
Challenges in the Access Control as a Service Market
- The increasing demand for more advanced security solutions, which requires service providers to update and improve their offerings constantly, is expected to hamper the market growth during the forecast period.
- As businesses adopt various security solutions, it becomes increasingly important for access control systems to integrate seamlessly. This requires service providers to deeply understand various security technologies and protocols. The lack of trained professionals also acts as a restraint in the market.
- The rise of cloud-based solutions has created challenges for market players. While cloud-based solutions offer several benefits, including scalability and flexibility, they also introduce new security risks. Service providers must ensure that their solutions are secure and reliable and comply with industry standards and regulations.
- The lack of customer education and awareness also poses a threat to the market’s progress. Many businesses are not fully aware of the importance of access control and the risks associated with poor security. Service providers need to educate their customers on the importance of access control and help them understand how their solutions work. This requires effective communication and marketing strategies and a deep understanding of customer needs and pain points.
Historical Market Analysis
The market was valued at USD 12.4 billion in 2025. The rising demand for security solutions and convenient access to facilities resulted in the growth of the market during the historical period.
| Historical Market Value in 2025 |
USD 12.4 billion |
Category-wise Insights
The Authentication System Segment Dominates the Market by Technology Type
| Attributes |
Details |
| Top Technology |
Authentication System |
| CAGR through 2035 |
10.2% |
- The authentication system plays a crucial role in ensuring secure access to data and resources of an organization.
- With the increasing demand for secure access control solutions, authentication systems have become popular for businesses of all sizes.
- Authentication systems offer various benefits, such as multi-factor authentication, user data protection, and easy integration with existing systems. These features make them a preferred choice for organizations seeking efficient and secure access control solutions.
The Homeland Segment Leads the Market by Application Type
| Attributes |
Details |
| Top Application |
Homeland Security |
| CAGR through 2035 |
10.0% |
- The market value of homeland security in access control as a service is expected to rise at a 10.0% CAGR through 2035.
- The homeland security segment is dominating the access control as a service market due to its increasing demand for enhanced security measures and the need for real-time access control monitoring.
- The increasing adoption of cloud-based access control solutions has further fueled the growth of this segment. Cloud-based solutions offer greater flexibility and scalability, allowing organizations to manage access control efficiently across multiple locations and devices. This has led to the increased adoption of access control as a service by the homeland security sector.
Country-wise insights
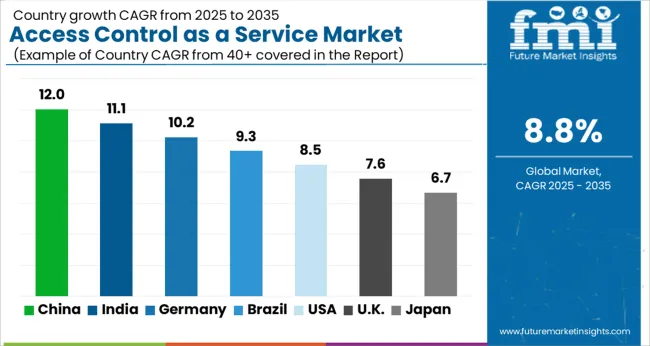
Access Control as a Service Market in the United States
- The increasing need for enhanced security measures across various industries in the United States is fueling growth in the market. As more businesses and organizations look for ways to protect their assets and data, they turn to access control solutions offering advanced features such as biometric identification and real-time monitoring.
- Another factor contributing to the growth of this market is the rise of cloud-based services. Access control as service solutions are often cloud-based, which makes them more accessible and cost-effective for businesses of all sizes.
Access Control as a Service Market in China
- With the rise of smart cities and the need for enhanced security in various industries, there is a greater focus on implementing access control systems that can provide real-time monitoring and management of access to buildings, facilities, and other assets.
- The increasing adoption of cloud-based solutions in China is also driving the growth of the market. Cloud-based access control systems offer greater flexibility, scalability, and cost-effectiveness, making them an attractive option for businesses of all sizes.
Access Control as a Service Market in Japan
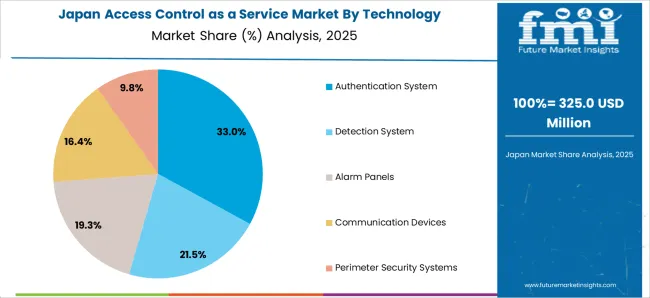
- The growing awareness of the need for security among businesses and individuals is boosting market demand. With increasing security threats and attacks, businesses are realizing the importance of strong access control systems to protect their assets and data.
- The trend toward cloud-based services also drives the growth of the market in Japan. Cloud-based access control systems offer greater flexibility and scalability than traditional on-premise systems, making them an attractive option for businesses of all sizes.
Access Control as a Service Market in the United Kingdom
- The need for enhanced security measures is growing in various industries, such as healthcare, banking, and finance in the United Kingdom. With the rise of technology, there is also an increase in cyberattacks and data breaches, leading to a higher demand for secure access control systems.
- The demand for Access control as a service is increasing as it offers several benefits over traditional access control systems, such as cost-effectiveness, scalability, and flexibility. It allows businesses to have better control over their security systems and enables them to monitor access to their facilities remotely.
Competitive Landscape
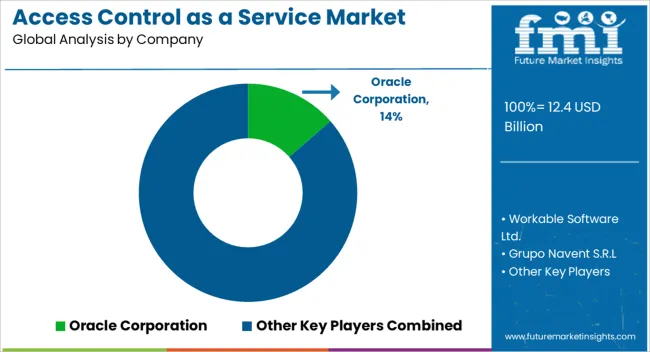
The access control as a service market is becoming increasingly competitive, with a growing number of companies offering cloud-based solutions for managing access to facilities and data. The companies provide a range of solutions, from basic access control systems to more advanced solutions that incorporate biometric authentication and real-time monitoring.
Recent Developments:
- In 2025, Thales acquired OneWelcome, a supplier of cloud-based customer authentication and access control systems for highly regulated industries. This enabled Thales to securely connect customers and business partners to online services. Due to the acquisition, Thales is expected to expand its product portfolio for digital identification and security.
- In 2024, Kastle Systems released KastlePark, a cloud-based program that combines office building and parking garage access management into a single synchronized solution. KastlePark allows building management, renters, and office workers to manage and streamline a property's parking operations, including access control and billing.
- In 2025, Dormakaba collaborated with Schüco, a German business that specializes in creating and selling solutions for facades, doors, and windows. The collaboration comprises both companies working together to enhance development projects in digitization and access control.
Key Market Players
- Workable Software Ltd.
- Grupo Navent S.R.L
- GUPY Tecnologia em Recrutamento LTDA
- ApplicantStack
- Oracle Corporation
- iCIMS, Inc
- ClearCompany
- Pemasys
- Greenhouse Software, Inc.
- Jobvite Inc.
- Automatic Data Processing, Inc.
- SAP SE
- Hyrell
- Bullhorn, Inc.
- 4Talent
- Kenoby
Key Segments in the Access Control as a Service Market Research
By Technology:
- Authentication System
- Biometric
- Card Based
- Touch Screen & Keypads
- Door Contacts
- Intruder Alarm System
- Detection System
- Motion Detection
- Glass Break Detector
- Door/Window Sensor
- Alarm Panels
- Communication Devices
- Perimeter Security Systems
- Free Standing Perimeter Security
- Buried Perimeter Security
By Application Type:
- Homeland Security
- Commercial
- Airports
- Financial Institutions
- Healthcare
- Telecommunications
- Stadiums
- Industrial
- Residential
By Region:
- North America
- Latin America
- East Asia
- South Asia
- Europe
- Oceania
- MEA
Frequently Asked Questions
How big is the access control as a service market in 2025?
The global access control as a service market is estimated to be valued at USD 12.4 billion in 2025.
What will be the size of access control as a service market in 2035?
The market size for the access control as a service market is projected to reach USD 29.1 billion by 2035.
How much will be the access control as a service market growth between 2025 and 2035?
The access control as a service market is expected to grow at a 8.8% CAGR between 2025 and 2035.
What are the key product types in the access control as a service market?
The key product types in access control as a service market are authentication system, _biometric, _card based, _touch screen & keypads, _door contacts, _intruder alarm system, detection system, _motion detection, _glass break detector, _door/window sensor, alarm panels, communication devices, perimeter security systems, _free standing perimeter security and _buried perimeter security.
Which application type segment to contribute significant share in the access control as a service market in 2025?
In terms of application type, commercial segment to command 41.5% share in the access control as a service market in 2025.


