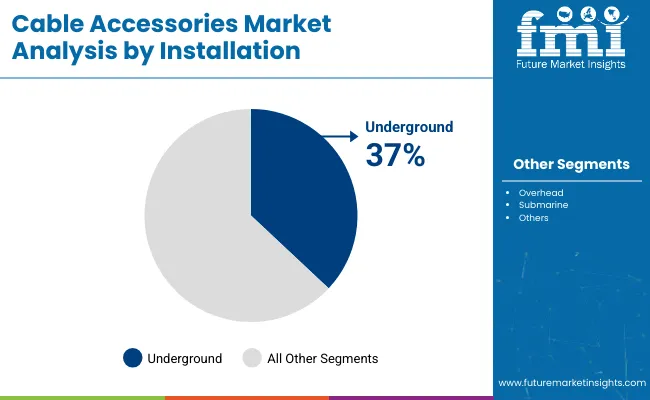
The global cable accessories market is poised for significant growth from 2025 to 2035, driven by increasing demand for electricity infrastructure expansion, rapid industrialization, and advancements in cable technology. With global energy use increasing, the need for innovative and durable cable attachments is growing.
Diverse types of power network accessories serve as safety equipment, obstructing unauthorized currents while guaranteeing an uninterrupted, secure, and efficient electric flow across several applications. Growth in renewable projects coupled with urbanization and modernized transmission and distribution network will generate demand for high performance cable accessories market.
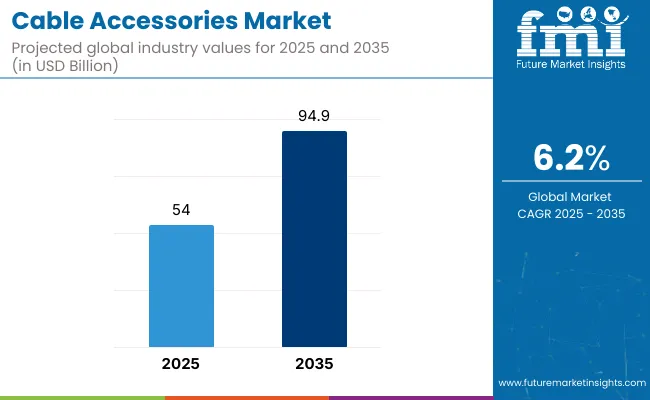
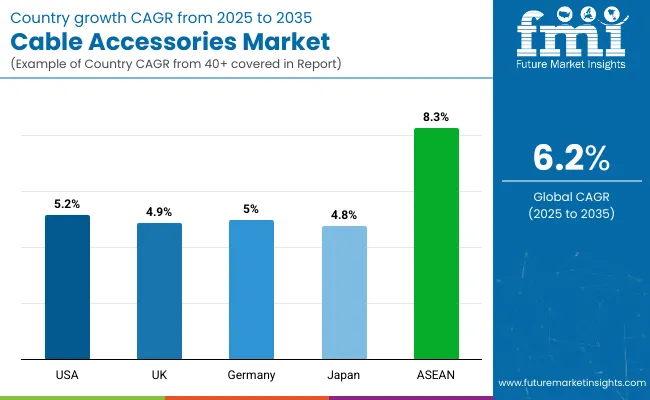
The market is estimated to generate USD 52,028.8 million in 2025 and grow to USD 94,948.7 million until 2035, at a compound annual growth rate (CAGR) of 6.2% during the forecast period.
cable accessories are an essential part of that which is required for the installation, maintenance and protection of these power cables. Sealand has specialized in joints, terminations, connectors and insulation materials offering extended cable life and enhanced performance.
Some of the key growth drivers for the market include the growing number of smart grids, underground cables and fiber optics, as well as demanding regulatory policies for energy efficiency. Moreover, technological advancements, such as advanced insulating materials, corrosion-resistant parts, and environmentally sustainable production methods, indicate high growth opportunities in the market in the near future.
The cable accessories market is experiencing significant growth due to the rising global demand for efficient and reliable power distribution systems. The growing concern of government in developing countries for cybersecurity and the installation of high voltage transmission lines and the growing demand for a continuous power supply in the residential, commercial and industrial sectors are few of the key driving factors.
Climate change is an additional factor leading to the increasing demand for high-performance cable accessories that can withstand extreme environmental conditions and ensure long-term reliability, as they are further needed for the integration of renewable energy sources (such as wind and solar power) into the grid.
Urbanization is another critical factor fueling market growth. In addition to delivering more dependable electricity, underground cabling solutions are required to make sure enhanced aesthetics, especially as cities grow larger, there are fewer power cutbacks.
Such a trend is particularly prominent in developed countries, where overhead power lines are being transitioned to underground networks to improve reliability and minimize environmental exposure. Moreover, with material technology advancements, polymer-based insulation and various types of advanced shielding techniques are expected to enhance cable durability, performance and safety.
The North American cable accessories market is witnessing steady growth due to increasing investments in smart grids, renewable energy infrastructure, and underground cable networks. North America is leading the way in the development of technologies that enable more efficient power transmission, while regulatory policies are forcing a re-examination of aging infrastructure. Increasing use of electric vehicles (EVs) is another vital reason for the demand for high-voltage cable accessories in charging stations as well as in grid expansion projects.
This means there has been a lot of investment in this space, with the USA government committing to the strengthening of power grids with energy-efficient solutions. Moreover, extreme weather conditions in few areas contribute to high demand for strong and weather resistant cable accessories as an uninterrupted power supply is a necessity. As concern for cleaner, renewable forms of natural power generation are on the rise in Canada (including hydropower and wind energy), the need for better quality cable accessories is also boosting.
Europe also is a major market, fueled by strict energy-efficiency regulations, growing numbers of offshore wind farms and long networks of underground power. Investments in cable accessories have been boosted by green energy transitions, such as those being made by Germany, the UK and France. The European Union's ambitious commitment to carbon neutrality has also led to strong upgrades of overall infrastructure and aided market expansion.
This is due to the rise of smart city solutions developing rapidly throughout Europe, leading to a growing need for new cabling solutions. The increasing adoption of electric and hybrid vehicles requires the development of reliable charging infrastructure; these will increase the demand for cable accessories suitable for high-voltage applications. With cables now buried rather than spread across the top of a pole, manufacturers are concentrating on producing better technical insulations that can withstand the elements.
The Asia-Pacific region is expected to witness the highest growth rate owing to increasing urbanization, rapid industrial development, and increasing electrification rates in developing economies like China, India, and Southeast Asian nations. Growth in smart cities, high-speed rail networks and large-scale renewable energy projects is driving demand for high-performance cable accessories. The market outlook is further supported by China’s outsized presence in manufacturing and infrastructure investments.
Market growth is significantly attributable to India's aggressive electrification projects and government-led rural electrification campaigns. Moreover, as digitalization is increasing throughout the region, the demand for telecommunications also includes the deployment of fiber optic cables. As both countries maintain technologically-advancing landscapes, the focus on energy-efficient power transmission systems is growing, and this is why high-quality cable accessories are more in demand.
Demand in Middle East & Africa is growing from growing investments in its power generation, grid expansion, and urban environments. The Gulf states are building grand infrastructure and investing heavily in renewable energy, and African countries, in the meantime, are expanding and promoting electrification in the rural areas. High demand for durable and weather-resistant cable accessories in adverse climatic conditions is one of the prominent factors propelling market growth.
Challenges
Durability and Performance Limitations in Harsh Environments
One of the major challenges in the cable accessories market is ensuring durability and performance in extreme operating conditions. Cable accessories joints, connectors, and terminations are used in harsh environments with extreme temperature cycles, moisture, UV radiation and mechanical stress.
This is especially true for industrial applications such as energy transmission, offshore installations, and underground networks where robust insulation and resistance to environmental degradation are paramount. Corrosion, electrical stress, thermal expansion and other factors can affect long-term reliability, causing expensive power outages and maintenance expenses. They need new high-performance materials, improved insulation technologies, and protective coatings to optimize durability with minimal boost in cost of production.
Growing Complexity of High-Voltage and Smart Grid Requirements
As high-voltage power transmission and intelligent grid technologies have gained momentum, cable accessories are coming up against increasingly complex performance and regulatory needs. Power lines are being developed for renewable power integration, improved productivity, and real-time monitoring; thus, cable accessories with better insulation, better conductivity, and digital interaction are required.
Technical challenges arise as the industry moves to extra-high-voltage (EHV) and ultra-high-voltage (UHV) networks, supported by rigorous testing and certification processes. Furthermore, incorporating both legacy as well as present-day smart grid may result in compatibility issues, further adding to the design complexity & increasing the development efforts. Power distribution manufacturers must keep up with changing electrical standards, they should also ensure compatibility with existing systems without interruptions.
Opportunities
Advancements in Smart and Self-Healing Cable Accessories
The development of smart and self-healing cable accessories is opening new growth opportunities in the market. Fiber optics and smart sensors are helping improve grid reliability with advanced cable accessories with integrated real-time monitoring capabilities, IoT connectivity and predictive maintenance capabilities. In these critical infrastructure applications, self-healing materials can repair minor insulation damage autonomously, lowering failure rates and maintenance downtime.
The increasing adoption of digital substations and other intelligent power distribution networks has also increased the demand for next generation cable accessories with capabilities for remote diagnostics and automated fault detection. The need for performance, technology-oriented smart cable accessories gives a fair opportunity for companies investing in smart cable accessories.
Rising Demand for Cable Accessories in Renewable Energy Projects
The global shift toward renewable energy sources, such as wind and solar power, is driving demand for specialized cable accessories. High-performance cable joints, terminations, and connectors that can accommodate variable loads and extreme environmental conditions are the basis for offshore wind farms, large-scale solar installations, and hybrid energy grids. The global investment of the government in clean energy infrastructure is leading to the lucrative opportunity for manufacturing cable accessories.
Moreover, the growing deployment of energy storage systems and interconnecting infrastructure between national grids we're driving demand for high-performance cable accessories with enhanced insulation, conductivity and life-cycle reliability. In this fast-growing market, businesses that specialize in customized solutions for renewable energy use will stand to benefit.
Between 2020 and 2024, the cable accessories market experienced steady expansion, as the demand for electricity infrastructure increased, coupled with rapid urbanization and the rising investment in renewable energy. The market growth of advanced cable accessories such as connectors, joints and terminations, was significantly raised with investments in smart infrastructure projects, industrial automation, and high-voltage power transmission.
The shift towards operating on higher voltage networks and the growing adoption of underground cable installations promoted market growth, where manufacturers targeted products with better durability, quality of insulation, and heat resistance.
Looking ahead to 2025 to 2035, the cable accessories market is expected to undergo substantial evolution with the integration of smart materials, AI-powered predictive maintenance, and environmentally sustainable solutions.
With high-performance superconducting cables, self-healing insulation materials, and IoT-enabled monitoring systems gaining momentum, the super-conducting cable market will reshape the industry. The increasing demand for cable accessories with high-efficiency and long life will be fueled by the growth of electric vehicle charging infrastructures, offshore wind farms, and digital power networks.
Market Shifts: A Comparative Analysis (2020 to 2024 vs. 2025 to 2035)
Market Shift | 2020 to 2024 |
---|---|
Demand from Key Industry Segments | Increasing demand from power utilities, industrial automation, telecommunications, and renewable energy projects. |
Shift Toward Smart Cable Accessories | Use of weather-resistant, high-durability, & insulated cable accessories for power transmission & distribution. |
Material & Design Innovations | High-temperature resistant insulation and flame-retardant coatings. Cold and compact cable joints. |
Regulatory & Compliance Standards | Standards such as IEC, IEEE as well as ISO for electrical safety, fire resistance, and durability. |
Impact of Automation & AI | Automation allowed other sectors, like manufacturing, to increase product efficiency and reliability. |
Market Growth Drivers | Increasing electrification, renewable energy integration, and urban expansion. |
Market Shift | 2025 to 2035 |
---|---|
Demand from Key Industry Segments | Growth in AI-driven power networks, electric vehicle charging stations, offshore wind farms, and high-speed rail electrification. |
Shift Toward Smart Cable Accessories | Wide-scale introduction of IoT-enabled cable accessories with live monitoring, AI-based fault prediction, and automated diagnostics. |
Material & Design Innovations | Self-healing materials, bio-based insulation and ultra-lightweight superconducting cable accessories. |
Regulatory & Compliance Standards | Digitization of various industries has led to safety tracking using artificial intelligence, stricter global regulations on environmental sustainability. |
Impact of Automation & AI | Self-monitoring cable accessories, autonomous grid maintenance, and fault prevention predictive analytics. |
Market Growth Drivers | Surge in smart grid investments, AI-powered energy management, electrification of transport, and sustainability-focused infrastructure development. |
USA Cable Accessories Market is growing at a high CAGR during the forecast period of 2023 to 2028. Increased investments in underground and high-voltage power transmission systems are expected to drive the need for cable joints, terminations, and connectors.
The increasing demand for high-speed data rate transmission owing to the expansion of 5G deployment is further supporting the growth of this market. This is supported by strict regulatory policies related to the grid modernization and energy efficiency; this is driving growth of the cable accessories market.
Country | CAGR (2025 to 2035) |
---|---|
United States | 5.3% |
The United Kingdom cable accessories market conveys a moderate growth with investments increasing in renewable energy, offshore wind farms and urban infrastructure. A strong focus in the country on modernizing aging power networks and underground power networks drives demand for high-quality cable accessories.
The exponential growth of data centers and 5G networks is also driving the demand for advanced fiber-optic accessories. Furthermore, regulatory mandates for energy efficiency and sustainability in electrical installations are boosting the market growth.
Country | CAGR (2025 to 2035) |
---|---|
United Kingdom | 4.9% |
The European Union cable accessories market is witnessing steady growth, driven by increased investments in renewable energy projects, grid modernization, and smart city developments. Rigorous regulatory landscape regarding electrical safety and energy efficiency in the EU is driving the demand for high-performance cable accessories.
Market growth is further propelled by the development of advanced power transmission systems led by Germany, France, and Italy. Another driving force behind the demand is the movement towards underground cabling solutions and the expansion of high-speed broadband networks.
Region | CAGR (2025 to 2035) |
---|---|
European Union | 5.1% |
Japan’s cable accessories market is experiencing moderate growth due to the country’s emphasis on energy efficiency, advanced power transmission networks, and smart factory initiatives. With the growth of underground power infrastructure and renewable energy projects, the demand for high-performance cable accessories is increasing.
The growing demand for robust cable terminations and connectors is also being driven by developments in robotics, the rollout of 5G and high speed rail networks. The fact that the country pays a lot of attention to electrical systems resistant to area movement action is also responsible for changing market trends.
Country | CAGR (2025 to 2035) |
---|---|
Japan | 4.8% |
South Korea's cable accessories market is expanding due to rapid developments in 5G, smart manufacturing, and renewable energy projects. Demand for quality cable accessories is being driven by the country leader in electronics, semiconductors, and high-tech industries.
Market growth is also expected to be fueled by investments in underground power networks and smart grid technology. South Korea's emphasis on sustainable energy solutions means demand for cable terminations, joints and connectors in solar and wind power projects is growing.
Country | CAGR (2025 to 2035) |
---|---|
South Korea | 5.4% |
Joint & Terminations dominate the market due to their critical role in ensuring efficient and reliable power distribution in railway electrification. These components play a pivotal role in ensuring the seamless operation of rail networks by connecting high-voltage cables and allowing a continuous flow of electricity. Growing expansion of railway infrastructure especially, in developing economies is expected to aid the demand for high-performance joint & termination solutions.
For instance, improved insulation materials and heat-shrink solutions are providing improved durability and efficiency in railway applications. Strict safety and regulatory compliance for Railway electrification projects encourages innovation in this segment and manufacturers need to develop corrosion resistant and high temperature resistant products.
Heat shrink shapes are increasingly being used by the construction industry as they offer better insulation, mechanical protection and resistance against environmental factors. In commercial and residential buildings, these parts are employed to seal cable joints, which helps to avoid moisture ingress and ensures safe electrical installation.
Rising emphasis on smart cities and energy-efficient structure is increasing the need for heat shrink solutions with high fire resistance and UV stability. In addition, regulatory guidelines which promote electrical safety and sustainability are driving manufacturers towards the development of halogen-free and eco-friendly heat shrink forms with respect to demands in the market.
The electric power industry is a key driver of demand for din lugs and connectors, as these components are integral to power distribution, transmission, and grid modernization projects. As more and more investments are made in renewable energy integration and smart grid technologies, there is an escalating demand for dependable electrical connectors boasting the load capacity to endure high currents for effective energy transmission.
Moreover, stringent safety and performance standards in power infrastructure require high-quality corrosion-resistant din lugs, especially in high-voltage applications. The transition to greener energy systems has driven the demand for new-age, low-resistance connectors to boost efficiency and minimize energy losses.
The power transmission industry plays a vital role in supporting the market for joint & terminations, din lugs, and other cable accessories. Countries worldwide are modernizing old electrical infrastructure and building new transmission systems to accommodate renewable power generation, which in turn is creating demand for robust and high-performance cable accessories.
They contribute significantly to grid stability, thermal losses reduction, and sustainable operational reliability. As the demand grows for high-voltage direct current (HVDC) transmission systems and underground power cables, so too does the need for specialized termination solutions that can endure extreme electrical and environmental conditions.
The global cable accessories market is growing rapidly due to the increasing demand for reliable power transmission and distribution infrastructure. The demand for innovations in cable accessories such as connectors, terminations, and joints has been primarily driven by urbanization, industrialization, and renewable energy projects. In addition, the market is served by these technological developments such as the smart grid and high-voltage direct current (HVDC) transmission, which require durables and high-performance accessories.
As a response to strict government regulations, key players in cable accessories market are concentrating on designing advanced, energy-efficient, as well as eco-friendly cable accessories. The market is also accelerating due to its increasing focus on grid modernization, as well as rising investments in underground and submarine cabling systems. The companies are also utilizing the automation and digital technologies for improving the efficiency and the life span of cable accessories, developing their competitive advantage.
Market Share Analysis by Company
Company Name | Estimated Market Share (%) |
---|---|
Nexans S.A. | 12-15% |
Prysmian Group | 10-13% |
TE Connectivity | 8-11% |
Sumitomo Electric Industries | 6-9% |
3M Company | 5-8% |
Other Companies (combined) | 44-55% |
Company Name | Key Offerings/Activities |
---|---|
Nexans S.A. | Designs high-performance power distribution cable accessories, including HVDC and smart grid technology. |
Prysmian Group | Focuses on energy/cost-saving, high-durability cable joints and terminations for industrial/utility. |
TE Connectivity | Offers advanced electrical insulation and waterproofing accessories for underground and submarine cabling. |
Sumitomo Electric Industries | Provides lightweight corrosion resistant cable accessories suitable for high voltage transmission projects. |
3M Company | Creates advanced, user-friendly cable splicing and insulation technologies designed to improve safety and productivity. |
Key Company Insights
Nexans S.A.
Nexans is a world leader in cable manufacturing and accessories for the transmission and distribution of power, as well as for a wide range of other applications. As a leader in smart grid development, the company provides HVDC-compatible cable accessories that increase efficiency while decreasing energy losses. Nexans is investing in nature-friendly solutions with recyclable materials and low-carbon manufacturing processes. Its high-tech cable joints & terminations are utilized in industrial, utility and renewable energy.
Prysmian Group
Prysmian Group specializes in durable and energy-efficient cable accessories, serving power utilities, industrial plants, and infrastructure projects. he company’s offerings include high-voltage cables joints and terminations capable of extreme conditions. Prysmian is a leader in submarine cabling solutions, serving offshore wind and undersea transmission projects. With a strong commitment to R&D, it has pioneered flexible, durable and green cable accessories.
TE Connectivity
TE Connectivity is a market leader in electrical insulation and waterproofing cable accessories for underground and marine application. he solutions provided by the company offers improved safety, longevity, and power transmission networks performance. TE Connectivity is adding to its line of heat-shrinkable and gel cable terminations that facilitate installation and maintenance. Its accessories also incorporate digital monitoring technologies for real-time diagnostics and predictive maintenance, the company added.
Sumitomo Electric Industries
Sumitomo Electric Industries specializes in lightweight and corrosion-resistant cable accessories for high-voltage transmission projects. The company’s prowess in superconducting and fiber optic cables and their applications for modern power networks has made an instrumental force. Recent advancements by Sumitomo include self-healing insulation technology, which increases the longevity and durability of cable accessories. The company also makes advanced materials that can minimize energy loss and make for a more efficient grid.
3M Company
3M is a brand known for its innovative cable splicing and insulation solutions that make electrical networks more reliable and efficient. The company’s splicing kits for fast installations and resin-based insulation solutions are used extensively in utility and industrial applications. 3M is prioritizing sustainability, bringing forward sustainable insulation materials and minimizing the eco-footprint of its production methodologies. Its cable accessories have been designed for 'ease of installation' in order to minimize downtime for maintenance and repairs.
Joint & Terminations, Din Lugs and Connectors, Heat Shrink Shapes, Other
Railways, Electric Power Industry, Construction Industry, Power Transmission Industry, Manufacturing Industry, Other
North America, Latin America, Eastern Europe, Western Europe, East Asia, South Asia and Pacific, Middle East and Africa
Table 1: Global Market Value (US$ Million) Forecast by Region, 2018 to 2033
Table 2: Global Market Volume (Units) Forecast by Region, 2018 to 2033
Table 3: Global Market Value (US$ Million) Forecast by Voltage, 2018 to 2033
Table 4: Global Market Volume (Units) Forecast by Voltage, 2018 to 2033
Table 5: Global Market Value (US$ Million) Forecast by End-Use Industry, 2018 to 2033
Table 6: Global Market Volume (Units) Forecast by End-Use Industry, 2018 to 2033
Table 7: Global Market Value (US$ Million) Forecast by Type, 2018 to 2033
Table 8: Global Market Volume (Units) Forecast by Type, 2018 to 2033
Table 9: North America Market Value (US$ Million) Forecast by Country, 2018 to 2033
Table 10: North America Market Volume (Units) Forecast by Country, 2018 to 2033
Table 11: North America Market Value (US$ Million) Forecast by Voltage, 2018 to 2033
Table 12: North America Market Volume (Units) Forecast by Voltage, 2018 to 2033
Table 13: North America Market Value (US$ Million) Forecast by End-Use Industry, 2018 to 2033
Table 14: North America Market Volume (Units) Forecast by End-Use Industry, 2018 to 2033
Table 15: North America Market Value (US$ Million) Forecast by Type, 2018 to 2033
Table 16: North America Market Volume (Units) Forecast by Type, 2018 to 2033
Table 17: Latin America Market Value (US$ Million) Forecast by Country, 2018 to 2033
Table 18: Latin America Market Volume (Units) Forecast by Country, 2018 to 2033
Table 19: Latin America Market Value (US$ Million) Forecast by Voltage, 2018 to 2033
Table 20: Latin America Market Volume (Units) Forecast by Voltage, 2018 to 2033
Table 21: Latin America Market Value (US$ Million) Forecast by End-Use Industry, 2018 to 2033
Table 22: Latin America Market Volume (Units) Forecast by End-Use Industry, 2018 to 2033
Table 23: Latin America Market Value (US$ Million) Forecast by Type, 2018 to 2033
Table 24: Latin America Market Volume (Units) Forecast by Type, 2018 to 2033
Table 25: Western Europe Market Value (US$ Million) Forecast by Country, 2018 to 2033
Table 26: Western Europe Market Volume (Units) Forecast by Country, 2018 to 2033
Table 27: Western Europe Market Value (US$ Million) Forecast by Voltage, 2018 to 2033
Table 28: Western Europe Market Volume (Units) Forecast by Voltage, 2018 to 2033
Table 29: Western Europe Market Value (US$ Million) Forecast by End-Use Industry, 2018 to 2033
Table 30: Western Europe Market Volume (Units) Forecast by End-Use Industry, 2018 to 2033
Table 31: Western Europe Market Value (US$ Million) Forecast by Type, 2018 to 2033
Table 32: Western Europe Market Volume (Units) Forecast by Type, 2018 to 2033
Table 33: Eastern Europe Market Value (US$ Million) Forecast by Country, 2018 to 2033
Table 34: Eastern Europe Market Volume (Units) Forecast by Country, 2018 to 2033
Table 35: Eastern Europe Market Value (US$ Million) Forecast by Voltage, 2018 to 2033
Table 36: Eastern Europe Market Volume (Units) Forecast by Voltage, 2018 to 2033
Table 37: Eastern Europe Market Value (US$ Million) Forecast by End-Use Industry, 2018 to 2033
Table 38: Eastern Europe Market Volume (Units) Forecast by End-Use Industry, 2018 to 2033
Table 39: Eastern Europe Market Value (US$ Million) Forecast by Type, 2018 to 2033
Table 40: Eastern Europe Market Volume (Units) Forecast by Type, 2018 to 2033
Table 41: South Asia and Pacific Market Value (US$ Million) Forecast by Country, 2018 to 2033
Table 42: South Asia and Pacific Market Volume (Units) Forecast by Country, 2018 to 2033
Table 43: South Asia and Pacific Market Value (US$ Million) Forecast by Voltage, 2018 to 2033
Table 44: South Asia and Pacific Market Volume (Units) Forecast by Voltage, 2018 to 2033
Table 45: South Asia and Pacific Market Value (US$ Million) Forecast by End-Use Industry, 2018 to 2033
Table 46: South Asia and Pacific Market Volume (Units) Forecast by End-Use Industry, 2018 to 2033
Table 47: South Asia and Pacific Market Value (US$ Million) Forecast by Type, 2018 to 2033
Table 48: South Asia and Pacific Market Volume (Units) Forecast by Type, 2018 to 2033
Table 49: East Asia Market Value (US$ Million) Forecast by Country, 2018 to 2033
Table 50: East Asia Market Volume (Units) Forecast by Country, 2018 to 2033
Table 51: East Asia Market Value (US$ Million) Forecast by Voltage, 2018 to 2033
Table 52: East Asia Market Volume (Units) Forecast by Voltage, 2018 to 2033
Table 53: East Asia Market Value (US$ Million) Forecast by End-Use Industry, 2018 to 2033
Table 54: East Asia Market Volume (Units) Forecast by End-Use Industry, 2018 to 2033
Table 55: East Asia Market Value (US$ Million) Forecast by Type, 2018 to 2033
Table 56: East Asia Market Volume (Units) Forecast by Type, 2018 to 2033
Table 57: Middle East and Africa Market Value (US$ Million) Forecast by Country, 2018 to 2033
Table 58: Middle East and Africa Market Volume (Units) Forecast by Country, 2018 to 2033
Table 59: Middle East and Africa Market Value (US$ Million) Forecast by Voltage, 2018 to 2033
Table 60: Middle East and Africa Market Volume (Units) Forecast by Voltage, 2018 to 2033
Table 61: Middle East and Africa Market Value (US$ Million) Forecast by End-Use Industry, 2018 to 2033
Table 62: Middle East and Africa Market Volume (Units) Forecast by End-Use Industry, 2018 to 2033
Table 63: Middle East and Africa Market Value (US$ Million) Forecast by Type, 2018 to 2033
Table 64: Middle East and Africa Market Volume (Units) Forecast by Type, 2018 to 2033
Figure 1: Global Market Value (US$ Million) by Voltage, 2023 to 2033
Figure 2: Global Market Value (US$ Million) by End-Use Industry, 2023 to 2033
Figure 3: Global Market Value (US$ Million) by Type, 2023 to 2033
Figure 4: Global Market Value (US$ Million) by Region, 2023 to 2033
Figure 5: Global Market Value (US$ Million) Analysis by Region, 2018 to 2033
Figure 6: Global Market Volume (Units) Analysis by Region, 2018 to 2033
Figure 7: Global Market Value Share (%) and BPS Analysis by Region, 2023 to 2033
Figure 8: Global Market Y-o-Y Growth (%) Projections by Region, 2023 to 2033
Figure 9: Global Market Value (US$ Million) Analysis by Voltage, 2018 to 2033
Figure 10: Global Market Volume (Units) Analysis by Voltage, 2018 to 2033
Figure 11: Global Market Value Share (%) and BPS Analysis by Voltage, 2023 to 2033
Figure 12: Global Market Y-o-Y Growth (%) Projections by Voltage, 2023 to 2033
Figure 13: Global Market Value (US$ Million) Analysis by End-Use Industry, 2018 to 2033
Figure 14: Global Market Volume (Units) Analysis by End-Use Industry, 2018 to 2033
Figure 15: Global Market Value Share (%) and BPS Analysis by End-Use Industry, 2023 to 2033
Figure 16: Global Market Y-o-Y Growth (%) Projections by End-Use Industry, 2023 to 2033
Figure 17: Global Market Value (US$ Million) Analysis by Type, 2018 to 2033
Figure 18: Global Market Volume (Units) Analysis by Type, 2018 to 2033
Figure 19: Global Market Value Share (%) and BPS Analysis by Type, 2023 to 2033
Figure 20: Global Market Y-o-Y Growth (%) Projections by Type, 2023 to 2033
Figure 21: Global Market Attractiveness by Voltage, 2023 to 2033
Figure 22: Global Market Attractiveness by End-Use Industry, 2023 to 2033
Figure 23: Global Market Attractiveness by Type, 2023 to 2033
Figure 24: Global Market Attractiveness by Region, 2023 to 2033
Figure 25: North America Market Value (US$ Million) by Voltage, 2023 to 2033
Figure 26: North America Market Value (US$ Million) by End-Use Industry, 2023 to 2033
Figure 27: North America Market Value (US$ Million) by Type, 2023 to 2033
Figure 28: North America Market Value (US$ Million) by Country, 2023 to 2033
Figure 29: North America Market Value (US$ Million) Analysis by Country, 2018 to 2033
Figure 30: North America Market Volume (Units) Analysis by Country, 2018 to 2033
Figure 31: North America Market Value Share (%) and BPS Analysis by Country, 2023 to 2033
Figure 32: North America Market Y-o-Y Growth (%) Projections by Country, 2023 to 2033
Figure 33: North America Market Value (US$ Million) Analysis by Voltage, 2018 to 2033
Figure 34: North America Market Volume (Units) Analysis by Voltage, 2018 to 2033
Figure 35: North America Market Value Share (%) and BPS Analysis by Voltage, 2023 to 2033
Figure 36: North America Market Y-o-Y Growth (%) Projections by Voltage, 2023 to 2033
Figure 37: North America Market Value (US$ Million) Analysis by End-Use Industry, 2018 to 2033
Figure 38: North America Market Volume (Units) Analysis by End-Use Industry, 2018 to 2033
Figure 39: North America Market Value Share (%) and BPS Analysis by End-Use Industry, 2023 to 2033
Figure 40: North America Market Y-o-Y Growth (%) Projections by End-Use Industry, 2023 to 2033
Figure 41: North America Market Value (US$ Million) Analysis by Type, 2018 to 2033
Figure 42: North America Market Volume (Units) Analysis by Type, 2018 to 2033
Figure 43: North America Market Value Share (%) and BPS Analysis by Type, 2023 to 2033
Figure 44: North America Market Y-o-Y Growth (%) Projections by Type, 2023 to 2033
Figure 45: North America Market Attractiveness by Voltage, 2023 to 2033
Figure 46: North America Market Attractiveness by End-Use Industry, 2023 to 2033
Figure 47: North America Market Attractiveness by Type, 2023 to 2033
Figure 48: North America Market Attractiveness by Country, 2023 to 2033
Figure 49: Latin America Market Value (US$ Million) by Voltage, 2023 to 2033
Figure 50: Latin America Market Value (US$ Million) by End-Use Industry, 2023 to 2033
Figure 51: Latin America Market Value (US$ Million) by Type, 2023 to 2033
Figure 52: Latin America Market Value (US$ Million) by Country, 2023 to 2033
Figure 53: Latin America Market Value (US$ Million) Analysis by Country, 2018 to 2033
Figure 54: Latin America Market Volume (Units) Analysis by Country, 2018 to 2033
Figure 55: Latin America Market Value Share (%) and BPS Analysis by Country, 2023 to 2033
Figure 56: Latin America Market Y-o-Y Growth (%) Projections by Country, 2023 to 2033
Figure 57: Latin America Market Value (US$ Million) Analysis by Voltage, 2018 to 2033
Figure 58: Latin America Market Volume (Units) Analysis by Voltage, 2018 to 2033
Figure 59: Latin America Market Value Share (%) and BPS Analysis by Voltage, 2023 to 2033
Figure 60: Latin America Market Y-o-Y Growth (%) Projections by Voltage, 2023 to 2033
Figure 61: Latin America Market Value (US$ Million) Analysis by End-Use Industry, 2018 to 2033
Figure 62: Latin America Market Volume (Units) Analysis by End-Use Industry, 2018 to 2033
Figure 63: Latin America Market Value Share (%) and BPS Analysis by End-Use Industry, 2023 to 2033
Figure 64: Latin America Market Y-o-Y Growth (%) Projections by End-Use Industry, 2023 to 2033
Figure 65: Latin America Market Value (US$ Million) Analysis by Type, 2018 to 2033
Figure 66: Latin America Market Volume (Units) Analysis by Type, 2018 to 2033
Figure 67: Latin America Market Value Share (%) and BPS Analysis by Type, 2023 to 2033
Figure 68: Latin America Market Y-o-Y Growth (%) Projections by Type, 2023 to 2033
Figure 69: Latin America Market Attractiveness by Voltage, 2023 to 2033
Figure 70: Latin America Market Attractiveness by End-Use Industry, 2023 to 2033
Figure 71: Latin America Market Attractiveness by Type, 2023 to 2033
Figure 72: Latin America Market Attractiveness by Country, 2023 to 2033
Figure 73: Western Europe Market Value (US$ Million) by Voltage, 2023 to 2033
Figure 74: Western Europe Market Value (US$ Million) by End-Use Industry, 2023 to 2033
Figure 75: Western Europe Market Value (US$ Million) by Type, 2023 to 2033
Figure 76: Western Europe Market Value (US$ Million) by Country, 2023 to 2033
Figure 77: Western Europe Market Value (US$ Million) Analysis by Country, 2018 to 2033
Figure 78: Western Europe Market Volume (Units) Analysis by Country, 2018 to 2033
Figure 79: Western Europe Market Value Share (%) and BPS Analysis by Country, 2023 to 2033
Figure 80: Western Europe Market Y-o-Y Growth (%) Projections by Country, 2023 to 2033
Figure 81: Western Europe Market Value (US$ Million) Analysis by Voltage, 2018 to 2033
Figure 82: Western Europe Market Volume (Units) Analysis by Voltage, 2018 to 2033
Figure 83: Western Europe Market Value Share (%) and BPS Analysis by Voltage, 2023 to 2033
Figure 84: Western Europe Market Y-o-Y Growth (%) Projections by Voltage, 2023 to 2033
Figure 85: Western Europe Market Value (US$ Million) Analysis by End-Use Industry, 2018 to 2033
Figure 86: Western Europe Market Volume (Units) Analysis by End-Use Industry, 2018 to 2033
Figure 87: Western Europe Market Value Share (%) and BPS Analysis by End-Use Industry, 2023 to 2033
Figure 88: Western Europe Market Y-o-Y Growth (%) Projections by End-Use Industry, 2023 to 2033
Figure 89: Western Europe Market Value (US$ Million) Analysis by Type, 2018 to 2033
Figure 90: Western Europe Market Volume (Units) Analysis by Type, 2018 to 2033
Figure 91: Western Europe Market Value Share (%) and BPS Analysis by Type, 2023 to 2033
Figure 92: Western Europe Market Y-o-Y Growth (%) Projections by Type, 2023 to 2033
Figure 93: Western Europe Market Attractiveness by Voltage, 2023 to 2033
Figure 94: Western Europe Market Attractiveness by End-Use Industry, 2023 to 2033
Figure 95: Western Europe Market Attractiveness by Type, 2023 to 2033
Figure 96: Western Europe Market Attractiveness by Country, 2023 to 2033
Figure 97: Eastern Europe Market Value (US$ Million) by Voltage, 2023 to 2033
Figure 98: Eastern Europe Market Value (US$ Million) by End-Use Industry, 2023 to 2033
Figure 99: Eastern Europe Market Value (US$ Million) by Type, 2023 to 2033
Figure 100: Eastern Europe Market Value (US$ Million) by Country, 2023 to 2033
Figure 101: Eastern Europe Market Value (US$ Million) Analysis by Country, 2018 to 2033
Figure 102: Eastern Europe Market Volume (Units) Analysis by Country, 2018 to 2033
Figure 103: Eastern Europe Market Value Share (%) and BPS Analysis by Country, 2023 to 2033
Figure 104: Eastern Europe Market Y-o-Y Growth (%) Projections by Country, 2023 to 2033
Figure 105: Eastern Europe Market Value (US$ Million) Analysis by Voltage, 2018 to 2033
Figure 106: Eastern Europe Market Volume (Units) Analysis by Voltage, 2018 to 2033
Figure 107: Eastern Europe Market Value Share (%) and BPS Analysis by Voltage, 2023 to 2033
Figure 108: Eastern Europe Market Y-o-Y Growth (%) Projections by Voltage, 2023 to 2033
Figure 109: Eastern Europe Market Value (US$ Million) Analysis by End-Use Industry, 2018 to 2033
Figure 110: Eastern Europe Market Volume (Units) Analysis by End-Use Industry, 2018 to 2033
Figure 111: Eastern Europe Market Value Share (%) and BPS Analysis by End-Use Industry, 2023 to 2033
Figure 112: Eastern Europe Market Y-o-Y Growth (%) Projections by End-Use Industry, 2023 to 2033
Figure 113: Eastern Europe Market Value (US$ Million) Analysis by Type, 2018 to 2033
Figure 114: Eastern Europe Market Volume (Units) Analysis by Type, 2018 to 2033
Figure 115: Eastern Europe Market Value Share (%) and BPS Analysis by Type, 2023 to 2033
Figure 116: Eastern Europe Market Y-o-Y Growth (%) Projections by Type, 2023 to 2033
Figure 117: Eastern Europe Market Attractiveness by Voltage, 2023 to 2033
Figure 118: Eastern Europe Market Attractiveness by End-Use Industry, 2023 to 2033
Figure 119: Eastern Europe Market Attractiveness by Type, 2023 to 2033
Figure 120: Eastern Europe Market Attractiveness by Country, 2023 to 2033
Figure 121: South Asia and Pacific Market Value (US$ Million) by Voltage, 2023 to 2033
Figure 122: South Asia and Pacific Market Value (US$ Million) by End-Use Industry, 2023 to 2033
Figure 123: South Asia and Pacific Market Value (US$ Million) by Type, 2023 to 2033
Figure 124: South Asia and Pacific Market Value (US$ Million) by Country, 2023 to 2033
Figure 125: South Asia and Pacific Market Value (US$ Million) Analysis by Country, 2018 to 2033
Figure 126: South Asia and Pacific Market Volume (Units) Analysis by Country, 2018 to 2033
Figure 127: South Asia and Pacific Market Value Share (%) and BPS Analysis by Country, 2023 to 2033
Figure 128: South Asia and Pacific Market Y-o-Y Growth (%) Projections by Country, 2023 to 2033
Figure 129: South Asia and Pacific Market Value (US$ Million) Analysis by Voltage, 2018 to 2033
Figure 130: South Asia and Pacific Market Volume (Units) Analysis by Voltage, 2018 to 2033
Figure 131: South Asia and Pacific Market Value Share (%) and BPS Analysis by Voltage, 2023 to 2033
Figure 132: South Asia and Pacific Market Y-o-Y Growth (%) Projections by Voltage, 2023 to 2033
Figure 133: South Asia and Pacific Market Value (US$ Million) Analysis by End-Use Industry, 2018 to 2033
Figure 134: South Asia and Pacific Market Volume (Units) Analysis by End-Use Industry, 2018 to 2033
Figure 135: South Asia and Pacific Market Value Share (%) and BPS Analysis by End-Use Industry, 2023 to 2033
Figure 136: South Asia and Pacific Market Y-o-Y Growth (%) Projections by End-Use Industry, 2023 to 2033
Figure 137: South Asia and Pacific Market Value (US$ Million) Analysis by Type, 2018 to 2033
Figure 138: South Asia and Pacific Market Volume (Units) Analysis by Type, 2018 to 2033
Figure 139: South Asia and Pacific Market Value Share (%) and BPS Analysis by Type, 2023 to 2033
Figure 140: South Asia and Pacific Market Y-o-Y Growth (%) Projections by Type, 2023 to 2033
Figure 141: South Asia and Pacific Market Attractiveness by Voltage, 2023 to 2033
Figure 142: South Asia and Pacific Market Attractiveness by End-Use Industry, 2023 to 2033
Figure 143: South Asia and Pacific Market Attractiveness by Type, 2023 to 2033
Figure 144: South Asia and Pacific Market Attractiveness by Country, 2023 to 2033
Figure 145: East Asia Market Value (US$ Million) by Voltage, 2023 to 2033
Figure 146: East Asia Market Value (US$ Million) by End-Use Industry, 2023 to 2033
Figure 147: East Asia Market Value (US$ Million) by Type, 2023 to 2033
Figure 148: East Asia Market Value (US$ Million) by Country, 2023 to 2033
Figure 149: East Asia Market Value (US$ Million) Analysis by Country, 2018 to 2033
Figure 150: East Asia Market Volume (Units) Analysis by Country, 2018 to 2033
Figure 151: East Asia Market Value Share (%) and BPS Analysis by Country, 2023 to 2033
Figure 152: East Asia Market Y-o-Y Growth (%) Projections by Country, 2023 to 2033
Figure 153: East Asia Market Value (US$ Million) Analysis by Voltage, 2018 to 2033
Figure 154: East Asia Market Volume (Units) Analysis by Voltage, 2018 to 2033
Figure 155: East Asia Market Value Share (%) and BPS Analysis by Voltage, 2023 to 2033
Figure 156: East Asia Market Y-o-Y Growth (%) Projections by Voltage, 2023 to 2033
Figure 157: East Asia Market Value (US$ Million) Analysis by End-Use Industry, 2018 to 2033
Figure 158: East Asia Market Volume (Units) Analysis by End-Use Industry, 2018 to 2033
Figure 159: East Asia Market Value Share (%) and BPS Analysis by End-Use Industry, 2023 to 2033
Figure 160: East Asia Market Y-o-Y Growth (%) Projections by End-Use Industry, 2023 to 2033
Figure 161: East Asia Market Value (US$ Million) Analysis by Type, 2018 to 2033
Figure 162: East Asia Market Volume (Units) Analysis by Type, 2018 to 2033
Figure 163: East Asia Market Value Share (%) and BPS Analysis by Type, 2023 to 2033
Figure 164: East Asia Market Y-o-Y Growth (%) Projections by Type, 2023 to 2033
Figure 165: East Asia Market Attractiveness by Voltage, 2023 to 2033
Figure 166: East Asia Market Attractiveness by End-Use Industry, 2023 to 2033
Figure 167: East Asia Market Attractiveness by Type, 2023 to 2033
Figure 168: East Asia Market Attractiveness by Country, 2023 to 2033
Figure 169: Middle East and Africa Market Value (US$ Million) by Voltage, 2023 to 2033
Figure 170: Middle East and Africa Market Value (US$ Million) by End-Use Industry, 2023 to 2033
Figure 171: Middle East and Africa Market Value (US$ Million) by Type, 2023 to 2033
Figure 172: Middle East and Africa Market Value (US$ Million) by Country, 2023 to 2033
Figure 173: Middle East and Africa Market Value (US$ Million) Analysis by Country, 2018 to 2033
Figure 174: Middle East and Africa Market Volume (Units) Analysis by Country, 2018 to 2033
Figure 175: Middle East and Africa Market Value Share (%) and BPS Analysis by Country, 2023 to 2033
Figure 176: Middle East and Africa Market Y-o-Y Growth (%) Projections by Country, 2023 to 2033
Figure 177: Middle East and Africa Market Value (US$ Million) Analysis by Voltage, 2018 to 2033
Figure 178: Middle East and Africa Market Volume (Units) Analysis by Voltage, 2018 to 2033
Figure 179: Middle East and Africa Market Value Share (%) and BPS Analysis by Voltage, 2023 to 2033
Figure 180: Middle East and Africa Market Y-o-Y Growth (%) Projections by Voltage, 2023 to 2033
Figure 181: Middle East and Africa Market Value (US$ Million) Analysis by End-Use Industry, 2018 to 2033
Figure 182: Middle East and Africa Market Volume (Units) Analysis by End-Use Industry, 2018 to 2033
Figure 183: Middle East and Africa Market Value Share (%) and BPS Analysis by End-Use Industry, 2023 to 2033
Figure 184: Middle East and Africa Market Y-o-Y Growth (%) Projections by End-Use Industry, 2023 to 2033
Figure 185: Middle East and Africa Market Value (US$ Million) Analysis by Type, 2018 to 2033
Figure 186: Middle East and Africa Market Volume (Units) Analysis by Type, 2018 to 2033
Figure 187: Middle East and Africa Market Value Share (%) and BPS Analysis by Type, 2023 to 2033
Figure 188: Middle East and Africa Market Y-o-Y Growth (%) Projections by Type, 2023 to 2033
Figure 189: Middle East and Africa Market Attractiveness by Voltage, 2023 to 2033
Figure 190: Middle East and Africa Market Attractiveness by End-Use Industry, 2023 to 2033
Figure 191: Middle East and Africa Market Attractiveness by Type, 2023 to 2033
Figure 192: Middle East and Africa Market Attractiveness by Country, 2023 to 2033
The global cable accessories market is projected to reach USD 52,028.8 million by the end of 2025.
The market is anticipated to grow at a CAGR of 6.2% over the forecast period.
By 2035, the cable accessories market is expected to reach USD 94,948.7 million.
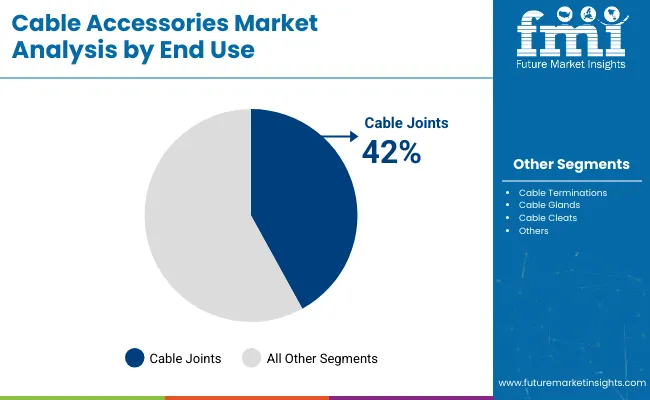
The Joint & Terminations segment is expected to dominate due to its critical role in high-voltage power transmission and increased adoption in railway and utility infrastructure.
Key players in the cable accessories market include Nexans S.A., Prysmian Group, TE Connectivity, Sumitomo Electric Industries, and 3M Company.
Explore Similar Insights
Thank you!
You will receive an email from our Business Development Manager. Please be sure to check your SPAM/JUNK folder too.