Methodology

Cable Granulator Market Size and Share Forecast Outlook 2025 to 2035

The Cable Granulator Market is estimated to be valued at USD 268.3 million in 2025 and is projected to reach USD 542.7 million by 2035, registering a compound annual growth rate (CAGR) of 7.3% over the forecast period.
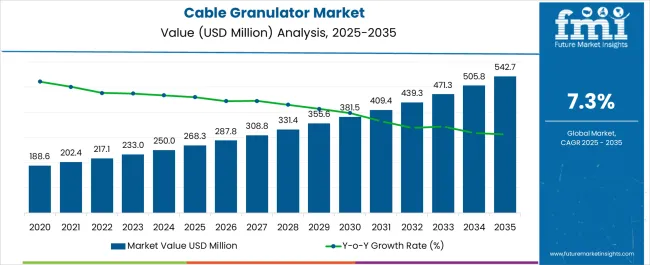
Quick Stats for Cable Granulator Market

  • Cable Granulator Market Value (2025): USD 268.3 million
  • Cable Granulator Market Forecast Value (2035): USD 542.7 million
  • Cable Granulator Market Forecast CAGR: 7.3%
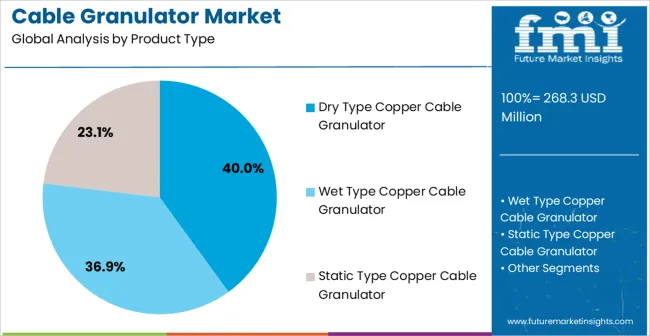
  • Leading Segment in Cable Granulator Market in 2025: Dry Type Copper Cable Granulator (40.0%)
  • Key Growth Regions in Cable Granulator Market: North America, Asia-Pacific, Europe
  • Top Key Players in Cable Granulator Market: Humanetics Innovative Solutions, Qizheng Machinery, San Lan Technologies, Changshu Shouyu Machinery, Carl Bennet, Guidetti Recycling Systems, Zhangjiagang Tairong Machinery, Jiangsu Jingliang New Energy, Zhengzhou Gofine Machine Equipment, Shanghai Winner Industrial, Vortex De-pollution

Cable Granulator Market Market Value Analysis

Cable Granulator Market Key Takeaways

Metric Value
Cable Granulator Market Estimated Value in (2025 E) USD 268.3 million
Cable Granulator Market Forecast Value in (2035 F) USD 542.7 million
Forecast CAGR (2025 to 2035) 7.3%

Why is the Cable Granulator Market Growing?

The Cable Granulator market is experiencing strong growth driven by the rising demand for efficient recycling of copper and other non-ferrous metals from scrap cables. The market’s expansion is fueled by increasing environmental regulations and sustainability initiatives across industries, encouraging the adoption of advanced cable granulation technologies. The future outlook is shaped by ongoing innovations in granulation machinery, which enhance separation efficiency, reduce operational costs, and improve recovery rates of valuable metals.

Growing industrialization and urbanization have led to an increase in electrical infrastructure, which generates higher volumes of scrap cables, further driving market demand. Investments in automated and high-capacity granulation systems are enabling businesses to optimize resource utilization and achieve better operational efficiency.

The market is also supported by the shift toward circular economy practices and the focus on reducing e-waste, which is creating significant growth opportunities for manufacturers and service providers As companies aim to improve profitability while adhering to environmental standards, the Cable Granulator market is poised for sustained growth in both developed and emerging regions.

Segmental Analysis

The cable granulator market is segmented by product type, capacity, end-use industry, and geographic regions. By product type, cable granulator market is divided into Dry Type Copper Cable Granulator, Wet Type Copper Cable Granulator, and Static Type Copper Cable Granulator. In terms of capacity, cable granulator market is classified into High Capacity (More Than 300 t/h), Medium Capacity (200 t/h - 299 t/h), and Low Capacity (Less Than 200 t/h). Based on end-use industry, cable granulator market is segmented into Automotive, Industrial Machinery, Shipbuilding, Building And Construction, Electrical And Electronics, Consumer Appliances, and Others. Regionally, the cable granulator industry is classified into North America, Latin America, Western Europe, Eastern Europe, Balkan & Baltic Countries, Russia & Belarus, Central Asia, East Asia, South Asia & Pacific, and the Middle East & Africa.
Insights into the Dry Type Copper Cable Granulator Product Type Segment

Cable Granulator Market Analysis By Product Type

The dry type copper cable granulator is projected to hold 40.0% of the market revenue share in 2025, making it the leading product type. This segment has been driven by its high efficiency in separating copper from insulation without the use of water, reducing environmental impact and operational costs.

The dry granulation process allows for easy handling, lower maintenance, and faster processing speeds, which enhance overall productivity. The adoption of dry type granulators has been supported by the growing focus on sustainable recycling practices and the need to meet regulatory compliance for waste management.

Additionally, improvements in machine design and automation capabilities have made dry type granulators more reliable and versatile for diverse scrap cable types The segment’s dominance is reinforced by its ability to deliver high-purity copper recovery, which is critical for industries relying on recycled copper as a raw material.
Insights into the High Capacity End-Use Segment

Cable Granulator Market Analysis By Capacity

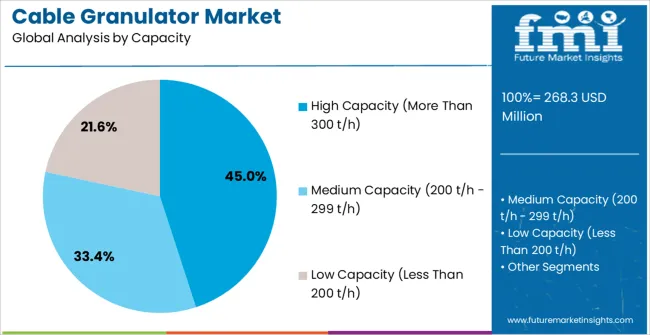
The high capacity segment, processing more than 300 tons per hour, is anticipated to account for 45.0% of market revenue in 2025. This growth is driven by the increasing need for large-scale recycling operations in industrial settings, where efficiency and throughput are critical.

High capacity granulators enable faster processing of scrap materials, reduce labor dependency, and improve overall cost-effectiveness for businesses. The adoption of high capacity systems has been supported by industrial expansion and the need to manage rising volumes of electrical waste efficiently.

Enhanced automation, real-time monitoring, and advanced separation technologies have further strengthened the appeal of high capacity systems As companies seek to optimize operations, maximize resource recovery, and meet stringent environmental standards, the high capacity end-use segment continues to lead the market in revenue contribution.
Insights into the Automotive End-Use Industry Segment

Cable Granulator Market Analysis By End Use Industry

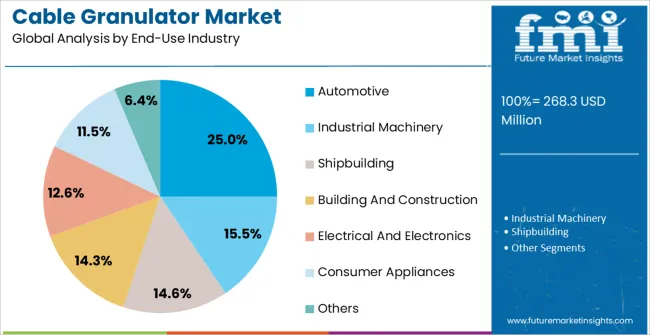
The automotive sector is expected to hold 25.0% of the Cable Granulator market revenue in 2025, emerging as the leading end-use industry segment. This is primarily due to the high volume of copper and aluminum wiring generated during automotive manufacturing, assembly, and recycling processes.

Cable granulators are increasingly used in the automotive industry to recover valuable metals from end-of-life vehicles and manufacturing scrap, supporting sustainability goals and reducing raw material costs. The growth of electric vehicles, which contain more extensive wiring and cabling systems, has further accelerated the demand for cable granulation solutions.

The adoption of automated and high-efficiency granulators has enabled automotive manufacturers and recyclers to improve throughput, reduce waste, and enhance material recovery rates As the industry continues to focus on circular economy practices and resource optimization, the commercial and operational reliance on cable granulators is expected to strengthen, supporting sustained growth in this segment.

Market Overview

Cable Granulator Market Overview

Cable granulators have become the most popular scrap copper wire recycling machines used across various end-use industries including automotive, electrical & electronics, consumer appliances, and industrial machinery.

These machines work on crushing and separating principle, wherein they initially crush the copper wires or cables and then separate copper granulators from insulation granules. They are compact and high output machines that offer various attractive benefits such easy operating mode, ecofriendly nature, and pollution reduction.

Rising adoption of cable granulators for separating or recovering essential metals form wires and cables is proving a major thrust to the growth of cable granulator market and the trend is likely to continue in the future.

Moreover, factors such as rapid urbanization and increasing investments for expanding cable transmission network are projected to generate sales prospects for cable granulators during the forecast period.
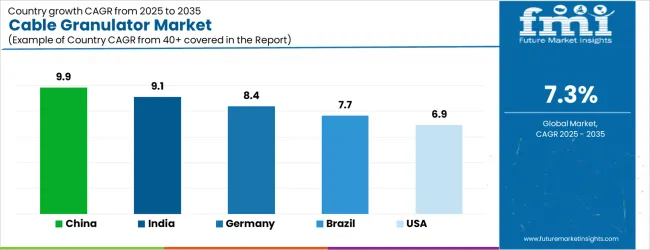
Analysis of Cable Granulator Market By Key Countries

Cable Granulator Market Cagr Analysis By Country

Country CAGR
China 9.9%
India 9.1%
Germany 8.4%
Brazil 7.7%
USA 6.9%
UK 6.2%
Japan 5.5%

Country-wise Analysis

The Cable Granulator Market is expected to register a CAGR of 7.3% during the forecast period, exhibiting varied country level momentum. China leads with the highest CAGR of 9.9%, followed by India at 9.1%. Developed markets such as Germany, France, and the UK continue to expand steadily, while the USA is likely to grow at consistent rates. Japan posts the lowest CAGR at 5.5%, yet still underscores a broadly positive trajectory for the global Cable Granulator Market. In 2024, Germany held a dominant revenue in the Western Europe market and is expected to grow with a CAGR of 8.4%. The USA Cable Granulator Market is estimated to be valued at USD 95.1 million in 2025 and is anticipated to reach a valuation of USD 95.1 million by 2035. Sales are projected to rise at a CAGR of 0.0% over the forecast period between 2025 and 2035. While Japan and South Korea markets are estimated to be valued at USD 14.2 million and USD 7.8 million respectively in 2025.
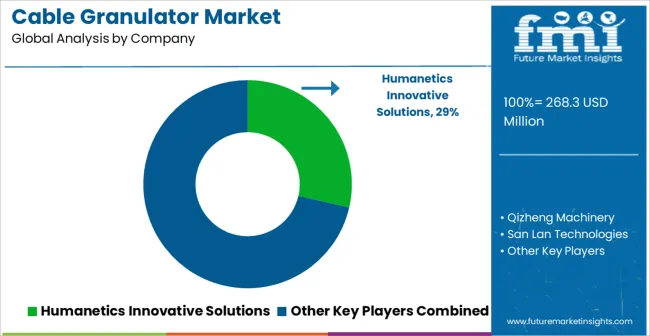
Key Players in the Cable Granulator Market

Cable Granulator Market Analysis By Company

  • Humanetics Innovative Solutions
  • Qizheng Machinery
  • San Lan Technologies
  • Changshu Shouyu Machinery
  • Carl Bennet
  • Guidetti Recycling Systems
  • Zhangjiagang Tairong Machinery
  • Jiangsu Jingliang New Energy
  • Zhengzhou Gofine Machine Equipment
  • Shanghai Winner Industrial
  • Vortex De-pollution

Scope of the Report

Item Value
Quantitative Units USD 268.3 Million
Product Type Dry Type Copper Cable Granulator, Wet Type Copper Cable Granulator, and Static Type Copper Cable Granulator
Capacity High Capacity (More Than 300 t/h), Medium Capacity (200 t/h - 299 t/h), and Low Capacity (Less Than 200 t/h)
End-Use Industry Automotive, Industrial Machinery, Shipbuilding, Building And Construction, Electrical And Electronics, Consumer Appliances, and Others
Regions Covered North America, Europe, Asia-Pacific, Latin America, Middle East & Africa
Country Covered United States, Canada, Germany, France, United Kingdom, China, Japan, India, Brazil, South Africa
Key Companies Profiled Humanetics Innovative Solutions, Qizheng Machinery, San Lan Technologies, Changshu Shouyu Machinery, Carl Bennet, Guidetti Recycling Systems, Zhangjiagang Tairong Machinery, Jiangsu Jingliang New Energy, Zhengzhou Gofine Machine Equipment, Shanghai Winner Industrial, and Vortex De-pollution

Cable Granulator Market by Segments

  • Product Type :

    • Dry Type Copper Cable Granulator
    • Wet Type Copper Cable Granulator
    • Static Type Copper Cable Granulator
  • Capacity :

    • High Capacity (More Than 300 t/h)
    • Medium Capacity (200 t/h - 299 t/h)
    • Low Capacity (Less Than 200 t/h)
  • End-Use Industry :

    • Automotive
    • Industrial Machinery
    • Shipbuilding
    • Building And Construction
    • Electrical And Electronics
    • Consumer Appliances
    • Others
  • Region :

    • North America
      • USA
      • Canada
      • Mexico
    • Latin America
      • Brazil
      • Chile
      • Rest of Latin America
    • Western Europe
      • Germany
      • UK
      • Italy
      • Spain
      • France
      • Nordic
      • BENELUX
      • Rest of Western Europe
    • Eastern Europe
      • Russia
      • Poland
      • Hungary
      • Balkan & Baltic
      • Rest of Eastern Europe
    • East Asia
      • China
      • Japan
      • South Korea
    • South Asia and Pacific
      • India
      • ASEAN
      • Australia & New Zealand
      • Rest of South Asia and Pacific
    • Middle East & Africa
      • Kingdom of Saudi Arabia
      • Other GCC Countries
      • Turkiye
      • South Africa
      • Other African Union
      • Rest of Middle East & Africa

Frequently Asked Questions

How big is the cable granulator market in 2025?

The global cable granulator market is estimated to be valued at USD 268.3 million in 2025.

What will be the size of cable granulator market in 2035?

The market size for the cable granulator market is projected to reach USD 542.7 million by 2035.

How much will be the cable granulator market growth between 2025 and 2035?

The cable granulator market is expected to grow at a 7.3% CAGR between 2025 and 2035.

What are the key product types in the cable granulator market?

The key product types in cable granulator market are dry type copper cable granulator, wet type copper cable granulator and static type copper cable granulator.

Which capacity segment to contribute significant share in the cable granulator market in 2025?

In terms of capacity, high capacity (more than 300 t/h) segment to command 45.0% share in the cable granulator market in 2025.

Table of Content

  1. Executive Summary
    • Global Market Outlook
    • Demand-side Trends
    • Supply-side Trends
    • Technology Roadmap Analysis
    • Analysis and Recommendations
  2. Market Overview
    • Market Coverage / Taxonomy
    • Market Definition / Scope / Limitations
  3. Market Background
    • Market Dynamics
      • Drivers
      • Restraints
      • Opportunity
      • Trends
    • Scenario Forecast
      • Demand in Optimistic Scenario
      • Demand in Likely Scenario
      • Demand in Conservative Scenario
    • Opportunity Map Analysis
    • Product Life Cycle Analysis
    • Supply Chain Analysis
    • Investment Feasibility Matrix
    • Value Chain Analysis
    • PESTLE and Porter’s Analysis
    • Regulatory Landscape
    • Regional Parent Market Outlook
    • Production and Consumption Statistics
    • Import and Export Statistics
  4. Global Market Analysis 2020 to 2024 and Forecast, 2025 to 2035
    • Historical Market Size Value (USD Million) Analysis, 2020 to 2024
    • Current and Future Market Size Value (USD Million) Projections, 2025 to 2035
      • Y-o-Y Growth Trend Analysis
      • Absolute $ Opportunity Analysis
  5. Global Market Pricing Analysis 2020 to 2024 and Forecast 2025 to 2035
  6. Global Market Analysis 2020 to 2024 and Forecast 2025 to 2035, By Product Type
    • Introduction / Key Findings
    • Historical Market Size Value (USD Million) Analysis By Product Type , 2020 to 2024
    • Current and Future Market Size Value (USD Million) Analysis and Forecast By Product Type , 2025 to 2035
      • Dry Type Copper Cable Granulator
      • Wet Type Copper Cable Granulator
      • Static Type Copper Cable Granulator
    • Y-o-Y Growth Trend Analysis By Product Type , 2020 to 2024
    • Absolute $ Opportunity Analysis By Product Type , 2025 to 2035
  7. Global Market Analysis 2020 to 2024 and Forecast 2025 to 2035, By Capacity
    • Introduction / Key Findings
    • Historical Market Size Value (USD Million) Analysis By Capacity, 2020 to 2024
    • Current and Future Market Size Value (USD Million) Analysis and Forecast By Capacity, 2025 to 2035
      • High Capacity (More Than 300 t/h)
      • Medium Capacity (200 t/h - 299 t/h)
      • Low Capacity (Less Than 200 t/h)
    • Y-o-Y Growth Trend Analysis By Capacity, 2020 to 2024
    • Absolute $ Opportunity Analysis By Capacity, 2025 to 2035
  8. Global Market Analysis 2020 to 2024 and Forecast 2025 to 2035, By End-Use Industry
    • Introduction / Key Findings
    • Historical Market Size Value (USD Million) Analysis By End-Use Industry, 2020 to 2024
    • Current and Future Market Size Value (USD Million) Analysis and Forecast By End-Use Industry, 2025 to 2035
      • Automotive
      • Industrial Machinery
      • Shipbuilding
      • Building And Construction
      • Electrical And Electronics
      • Consumer Appliances
      • Others
    • Y-o-Y Growth Trend Analysis By End-Use Industry, 2020 to 2024
    • Absolute $ Opportunity Analysis By End-Use Industry, 2025 to 2035
  9. Global Market Analysis 2020 to 2024 and Forecast 2025 to 2035, By Region
    • Introduction
    • Historical Market Size Value (USD Million) Analysis By Region, 2020 to 2024
    • Current Market Size Value (USD Million) Analysis and Forecast By Region, 2025 to 2035
      • North America
      • Latin America
      • Western Europe
      • Eastern Europe
      • East Asia
      • South Asia and Pacific
      • Middle East & Africa
    • Market Attractiveness Analysis By Region
  10. North America Market Analysis 2020 to 2024 and Forecast 2025 to 2035, By Country
    • Historical Market Size Value (USD Million) Trend Analysis By Market Taxonomy, 2020 to 2024
    • Market Size Value (USD Million) Forecast By Market Taxonomy, 2025 to 2035
      • By Country
        • USA
        • Canada
        • Mexico
      • By Product Type
      • By Capacity
      • By End-Use Industry
    • Market Attractiveness Analysis
      • By Country
      • By Product Type
      • By Capacity
      • By End-Use Industry
    • Key Takeaways
  11. Latin America Market Analysis 2020 to 2024 and Forecast 2025 to 2035, By Country
    • Historical Market Size Value (USD Million) Trend Analysis By Market Taxonomy, 2020 to 2024
    • Market Size Value (USD Million) Forecast By Market Taxonomy, 2025 to 2035
      • By Country
        • Brazil
        • Chile
        • Rest of Latin America
      • By Product Type
      • By Capacity
      • By End-Use Industry
    • Market Attractiveness Analysis
      • By Country
      • By Product Type
      • By Capacity
      • By End-Use Industry
    • Key Takeaways
  12. Western Europe Market Analysis 2020 to 2024 and Forecast 2025 to 2035, By Country
    • Historical Market Size Value (USD Million) Trend Analysis By Market Taxonomy, 2020 to 2024
    • Market Size Value (USD Million) Forecast By Market Taxonomy, 2025 to 2035
      • By Country
        • Germany
        • UK
        • Italy
        • Spain
        • France
        • Nordic
        • BENELUX
        • Rest of Western Europe
      • By Product Type
      • By Capacity
      • By End-Use Industry
    • Market Attractiveness Analysis
      • By Country
      • By Product Type
      • By Capacity
      • By End-Use Industry
    • Key Takeaways
  13. Eastern Europe Market Analysis 2020 to 2024 and Forecast 2025 to 2035, By Country
    • Historical Market Size Value (USD Million) Trend Analysis By Market Taxonomy, 2020 to 2024
    • Market Size Value (USD Million) Forecast By Market Taxonomy, 2025 to 2035
      • By Country
        • Russia
        • Poland
        • Hungary
        • Balkan & Baltic
        • Rest of Eastern Europe
      • By Product Type
      • By Capacity
      • By End-Use Industry
    • Market Attractiveness Analysis
      • By Country
      • By Product Type
      • By Capacity
      • By End-Use Industry
    • Key Takeaways
  14. East Asia Market Analysis 2020 to 2024 and Forecast 2025 to 2035, By Country
    • Historical Market Size Value (USD Million) Trend Analysis By Market Taxonomy, 2020 to 2024
    • Market Size Value (USD Million) Forecast By Market Taxonomy, 2025 to 2035
      • By Country
        • China
        • Japan
        • South Korea
      • By Product Type
      • By Capacity
      • By End-Use Industry
    • Market Attractiveness Analysis
      • By Country
      • By Product Type
      • By Capacity
      • By End-Use Industry
    • Key Takeaways
  15. South Asia and Pacific Market Analysis 2020 to 2024 and Forecast 2025 to 2035, By Country
    • Historical Market Size Value (USD Million) Trend Analysis By Market Taxonomy, 2020 to 2024
    • Market Size Value (USD Million) Forecast By Market Taxonomy, 2025 to 2035
      • By Country
        • India
        • ASEAN
        • Australia & New Zealand
        • Rest of South Asia and Pacific
      • By Product Type
      • By Capacity
      • By End-Use Industry
    • Market Attractiveness Analysis
      • By Country
      • By Product Type
      • By Capacity
      • By End-Use Industry
    • Key Takeaways
  16. Middle East & Africa Market Analysis 2020 to 2024 and Forecast 2025 to 2035, By Country
    • Historical Market Size Value (USD Million) Trend Analysis By Market Taxonomy, 2020 to 2024
    • Market Size Value (USD Million) Forecast By Market Taxonomy, 2025 to 2035
      • By Country
        • Kingdom of Saudi Arabia
        • Other GCC Countries
        • Turkiye
        • South Africa
        • Other African Union
        • Rest of Middle East & Africa
      • By Product Type
      • By Capacity
      • By End-Use Industry
    • Market Attractiveness Analysis
      • By Country
      • By Product Type
      • By Capacity
      • By End-Use Industry
    • Key Takeaways
  17. Key Countries Market Analysis
    • USA
      • Pricing Analysis
      • Market Share Analysis, 2024
        • By Product Type
        • By Capacity
        • By End-Use Industry
    • Canada
      • Pricing Analysis
      • Market Share Analysis, 2024
        • By Product Type
        • By Capacity
        • By End-Use Industry
    • Mexico
      • Pricing Analysis
      • Market Share Analysis, 2024
        • By Product Type
        • By Capacity
        • By End-Use Industry
    • Brazil
      • Pricing Analysis
      • Market Share Analysis, 2024
        • By Product Type
        • By Capacity
        • By End-Use Industry
    • Chile
      • Pricing Analysis
      • Market Share Analysis, 2024
        • By Product Type
        • By Capacity
        • By End-Use Industry
    • Germany
      • Pricing Analysis
      • Market Share Analysis, 2024
        • By Product Type
        • By Capacity
        • By End-Use Industry
    • UK
      • Pricing Analysis
      • Market Share Analysis, 2024
        • By Product Type
        • By Capacity
        • By End-Use Industry
    • Italy
      • Pricing Analysis
      • Market Share Analysis, 2024
        • By Product Type
        • By Capacity
        • By End-Use Industry
    • Spain
      • Pricing Analysis
      • Market Share Analysis, 2024
        • By Product Type
        • By Capacity
        • By End-Use Industry
    • France
      • Pricing Analysis
      • Market Share Analysis, 2024
        • By Product Type
        • By Capacity
        • By End-Use Industry
    • India
      • Pricing Analysis
      • Market Share Analysis, 2024
        • By Product Type
        • By Capacity
        • By End-Use Industry
    • ASEAN
      • Pricing Analysis
      • Market Share Analysis, 2024
        • By Product Type
        • By Capacity
        • By End-Use Industry
    • Australia & New Zealand
      • Pricing Analysis
      • Market Share Analysis, 2024
        • By Product Type
        • By Capacity
        • By End-Use Industry
    • China
      • Pricing Analysis
      • Market Share Analysis, 2024
        • By Product Type
        • By Capacity
        • By End-Use Industry
    • Japan
      • Pricing Analysis
      • Market Share Analysis, 2024
        • By Product Type
        • By Capacity
        • By End-Use Industry
    • South Korea
      • Pricing Analysis
      • Market Share Analysis, 2024
        • By Product Type
        • By Capacity
        • By End-Use Industry
    • Russia
      • Pricing Analysis
      • Market Share Analysis, 2024
        • By Product Type
        • By Capacity
        • By End-Use Industry
    • Poland
      • Pricing Analysis
      • Market Share Analysis, 2024
        • By Product Type
        • By Capacity
        • By End-Use Industry
    • Hungary
      • Pricing Analysis
      • Market Share Analysis, 2024
        • By Product Type
        • By Capacity
        • By End-Use Industry
    • Kingdom of Saudi Arabia
      • Pricing Analysis
      • Market Share Analysis, 2024
        • By Product Type
        • By Capacity
        • By End-Use Industry
    • Turkiye
      • Pricing Analysis
      • Market Share Analysis, 2024
        • By Product Type
        • By Capacity
        • By End-Use Industry
    • South Africa
      • Pricing Analysis
      • Market Share Analysis, 2024
        • By Product Type
        • By Capacity
        • By End-Use Industry
  18. Market Structure Analysis
    • Competition Dashboard
    • Competition Benchmarking
    • Market Share Analysis of Top Players
      • By Regional
      • By Product Type
      • By Capacity
      • By End-Use Industry
  19. Competition Analysis
    • Competition Deep Dive
      • Humanetics Innovative Solutions
        • Overview
        • Product Portfolio
        • Profitability by Market Segments (Product/Age /Sales Channel/Region)
        • Sales Footprint
        • Strategy Overview
          • Marketing Strategy
          • Product Strategy
          • Channel Strategy
      • Qizheng Machinery
      • San Lan Technologies
      • Changshu Shouyu Machinery
      • Carl Bennet
      • Guidetti Recycling Systems
      • Zhangjiagang Tairong Machinery
      • Jiangsu Jingliang New Energy
      • Zhengzhou Gofine Machine Equipment
      • Shanghai Winner Industrial
      • Vortex De-pollution
  20. Assumptions & Acronyms Used
  21. Research Methodology

List of Tables

  • Table 1: Global Market Value (USD Million) Forecast by Region, 2020 to 2035
  • Table 2: Global Market Value (USD Million) Forecast by Product Type , 2020 to 2035
  • Table 3: Global Market Value (USD Million) Forecast by Capacity, 2020 to 2035
  • Table 4: Global Market Value (USD Million) Forecast by End-Use Industry, 2020 to 2035
  • Table 5: North America Market Value (USD Million) Forecast by Country, 2020 to 2035
  • Table 6: North America Market Value (USD Million) Forecast by Product Type , 2020 to 2035
  • Table 7: North America Market Value (USD Million) Forecast by Capacity, 2020 to 2035
  • Table 8: North America Market Value (USD Million) Forecast by End-Use Industry, 2020 to 2035
  • Table 9: Latin America Market Value (USD Million) Forecast by Country, 2020 to 2035
  • Table 10: Latin America Market Value (USD Million) Forecast by Product Type , 2020 to 2035
  • Table 11: Latin America Market Value (USD Million) Forecast by Capacity, 2020 to 2035
  • Table 12: Latin America Market Value (USD Million) Forecast by End-Use Industry, 2020 to 2035
  • Table 13: Western Europe Market Value (USD Million) Forecast by Country, 2020 to 2035
  • Table 14: Western Europe Market Value (USD Million) Forecast by Product Type , 2020 to 2035
  • Table 15: Western Europe Market Value (USD Million) Forecast by Capacity, 2020 to 2035
  • Table 16: Western Europe Market Value (USD Million) Forecast by End-Use Industry, 2020 to 2035
  • Table 17: Eastern Europe Market Value (USD Million) Forecast by Country, 2020 to 2035
  • Table 18: Eastern Europe Market Value (USD Million) Forecast by Product Type , 2020 to 2035
  • Table 19: Eastern Europe Market Value (USD Million) Forecast by Capacity, 2020 to 2035
  • Table 20: Eastern Europe Market Value (USD Million) Forecast by End-Use Industry, 2020 to 2035
  • Table 21: East Asia Market Value (USD Million) Forecast by Country, 2020 to 2035
  • Table 22: East Asia Market Value (USD Million) Forecast by Product Type , 2020 to 2035
  • Table 23: East Asia Market Value (USD Million) Forecast by Capacity, 2020 to 2035
  • Table 24: East Asia Market Value (USD Million) Forecast by End-Use Industry, 2020 to 2035
  • Table 25: South Asia and Pacific Market Value (USD Million) Forecast by Country, 2020 to 2035
  • Table 26: South Asia and Pacific Market Value (USD Million) Forecast by Product Type , 2020 to 2035
  • Table 27: South Asia and Pacific Market Value (USD Million) Forecast by Capacity, 2020 to 2035
  • Table 28: South Asia and Pacific Market Value (USD Million) Forecast by End-Use Industry, 2020 to 2035
  • Table 29: Middle East & Africa Market Value (USD Million) Forecast by Country, 2020 to 2035
  • Table 30: Middle East & Africa Market Value (USD Million) Forecast by Product Type , 2020 to 2035
  • Table 31: Middle East & Africa Market Value (USD Million) Forecast by Capacity, 2020 to 2035
  • Table 32: Middle East & Africa Market Value (USD Million) Forecast by End-Use Industry, 2020 to 2035

List of Figures

  • Figure 1: Global Market Pricing Analysis
  • Figure 2: Global Market Value (USD Million) Forecast 2020 to 2035
  • Figure 3: Global Market Value Share and BPS Analysis by Product Type , 2025 and 2035
  • Figure 4: Global Market Y-o-Y Growth Comparison by Product Type , 2025 to 2035
  • Figure 5: Global Market Attractiveness Analysis by Product Type
  • Figure 6: Global Market Value Share and BPS Analysis by Capacity, 2025 and 2035
  • Figure 7: Global Market Y-o-Y Growth Comparison by Capacity, 2025 to 2035
  • Figure 8: Global Market Attractiveness Analysis by Capacity
  • Figure 9: Global Market Value Share and BPS Analysis by End-Use Industry, 2025 and 2035
  • Figure 10: Global Market Y-o-Y Growth Comparison by End-Use Industry, 2025 to 2035
  • Figure 11: Global Market Attractiveness Analysis by End-Use Industry
  • Figure 12: Global Market Value (USD Million) Share and BPS Analysis by Region, 2025 and 2035
  • Figure 13: Global Market Y-o-Y Growth Comparison by Region, 2025 to 2035
  • Figure 14: Global Market Attractiveness Analysis by Region
  • Figure 15: North America Market Incremental Dollar Opportunity, 2025 to 2035
  • Figure 16: Latin America Market Incremental Dollar Opportunity, 2025 to 2035
  • Figure 17: Western Europe Market Incremental Dollar Opportunity, 2025 to 2035
  • Figure 18: Eastern Europe Market Incremental Dollar Opportunity, 2025 to 2035
  • Figure 19: East Asia Market Incremental Dollar Opportunity, 2025 to 2035
  • Figure 20: South Asia and Pacific Market Incremental Dollar Opportunity, 2025 to 2035
  • Figure 21: Middle East & Africa Market Incremental Dollar Opportunity, 2025 to 2035
  • Figure 22: North America Market Value Share and BPS Analysis by Country, 2025 and 2035
  • Figure 23: North America Market Value Share and BPS Analysis by Product Type , 2025 and 2035
  • Figure 24: North America Market Y-o-Y Growth Comparison by Product Type , 2025 to 2035
  • Figure 25: North America Market Attractiveness Analysis by Product Type
  • Figure 26: North America Market Value Share and BPS Analysis by Capacity, 2025 and 2035
  • Figure 27: North America Market Y-o-Y Growth Comparison by Capacity, 2025 to 2035
  • Figure 28: North America Market Attractiveness Analysis by Capacity
  • Figure 29: North America Market Value Share and BPS Analysis by End-Use Industry, 2025 and 2035
  • Figure 30: North America Market Y-o-Y Growth Comparison by End-Use Industry, 2025 to 2035
  • Figure 31: North America Market Attractiveness Analysis by End-Use Industry
  • Figure 32: Latin America Market Value Share and BPS Analysis by Country, 2025 and 2035
  • Figure 33: Latin America Market Value Share and BPS Analysis by Product Type , 2025 and 2035
  • Figure 34: Latin America Market Y-o-Y Growth Comparison by Product Type , 2025 to 2035
  • Figure 35: Latin America Market Attractiveness Analysis by Product Type
  • Figure 36: Latin America Market Value Share and BPS Analysis by Capacity, 2025 and 2035
  • Figure 37: Latin America Market Y-o-Y Growth Comparison by Capacity, 2025 to 2035
  • Figure 38: Latin America Market Attractiveness Analysis by Capacity
  • Figure 39: Latin America Market Value Share and BPS Analysis by End-Use Industry, 2025 and 2035
  • Figure 40: Latin America Market Y-o-Y Growth Comparison by End-Use Industry, 2025 to 2035
  • Figure 41: Latin America Market Attractiveness Analysis by End-Use Industry
  • Figure 42: Western Europe Market Value Share and BPS Analysis by Country, 2025 and 2035
  • Figure 43: Western Europe Market Value Share and BPS Analysis by Product Type , 2025 and 2035
  • Figure 44: Western Europe Market Y-o-Y Growth Comparison by Product Type , 2025 to 2035
  • Figure 45: Western Europe Market Attractiveness Analysis by Product Type
  • Figure 46: Western Europe Market Value Share and BPS Analysis by Capacity, 2025 and 2035
  • Figure 47: Western Europe Market Y-o-Y Growth Comparison by Capacity, 2025 to 2035
  • Figure 48: Western Europe Market Attractiveness Analysis by Capacity
  • Figure 49: Western Europe Market Value Share and BPS Analysis by End-Use Industry, 2025 and 2035
  • Figure 50: Western Europe Market Y-o-Y Growth Comparison by End-Use Industry, 2025 to 2035
  • Figure 51: Western Europe Market Attractiveness Analysis by End-Use Industry
  • Figure 52: Eastern Europe Market Value Share and BPS Analysis by Country, 2025 and 2035
  • Figure 53: Eastern Europe Market Value Share and BPS Analysis by Product Type , 2025 and 2035
  • Figure 54: Eastern Europe Market Y-o-Y Growth Comparison by Product Type , 2025 to 2035
  • Figure 55: Eastern Europe Market Attractiveness Analysis by Product Type
  • Figure 56: Eastern Europe Market Value Share and BPS Analysis by Capacity, 2025 and 2035
  • Figure 57: Eastern Europe Market Y-o-Y Growth Comparison by Capacity, 2025 to 2035
  • Figure 58: Eastern Europe Market Attractiveness Analysis by Capacity
  • Figure 59: Eastern Europe Market Value Share and BPS Analysis by End-Use Industry, 2025 and 2035
  • Figure 60: Eastern Europe Market Y-o-Y Growth Comparison by End-Use Industry, 2025 to 2035
  • Figure 61: Eastern Europe Market Attractiveness Analysis by End-Use Industry
  • Figure 62: East Asia Market Value Share and BPS Analysis by Country, 2025 and 2035
  • Figure 63: East Asia Market Value Share and BPS Analysis by Product Type , 2025 and 2035
  • Figure 64: East Asia Market Y-o-Y Growth Comparison by Product Type , 2025 to 2035
  • Figure 65: East Asia Market Attractiveness Analysis by Product Type
  • Figure 66: East Asia Market Value Share and BPS Analysis by Capacity, 2025 and 2035
  • Figure 67: East Asia Market Y-o-Y Growth Comparison by Capacity, 2025 to 2035
  • Figure 68: East Asia Market Attractiveness Analysis by Capacity
  • Figure 69: East Asia Market Value Share and BPS Analysis by End-Use Industry, 2025 and 2035
  • Figure 70: East Asia Market Y-o-Y Growth Comparison by End-Use Industry, 2025 to 2035
  • Figure 71: East Asia Market Attractiveness Analysis by End-Use Industry
  • Figure 72: South Asia and Pacific Market Value Share and BPS Analysis by Country, 2025 and 2035
  • Figure 73: South Asia and Pacific Market Value Share and BPS Analysis by Product Type , 2025 and 2035
  • Figure 74: South Asia and Pacific Market Y-o-Y Growth Comparison by Product Type , 2025 to 2035
  • Figure 75: South Asia and Pacific Market Attractiveness Analysis by Product Type
  • Figure 76: South Asia and Pacific Market Value Share and BPS Analysis by Capacity, 2025 and 2035
  • Figure 77: South Asia and Pacific Market Y-o-Y Growth Comparison by Capacity, 2025 to 2035
  • Figure 78: South Asia and Pacific Market Attractiveness Analysis by Capacity
  • Figure 79: South Asia and Pacific Market Value Share and BPS Analysis by End-Use Industry, 2025 and 2035
  • Figure 80: South Asia and Pacific Market Y-o-Y Growth Comparison by End-Use Industry, 2025 to 2035
  • Figure 81: South Asia and Pacific Market Attractiveness Analysis by End-Use Industry
  • Figure 82: Middle East & Africa Market Value Share and BPS Analysis by Country, 2025 and 2035
  • Figure 83: Middle East & Africa Market Value Share and BPS Analysis by Product Type , 2025 and 2035
  • Figure 84: Middle East & Africa Market Y-o-Y Growth Comparison by Product Type , 2025 to 2035
  • Figure 85: Middle East & Africa Market Attractiveness Analysis by Product Type
  • Figure 86: Middle East & Africa Market Value Share and BPS Analysis by Capacity, 2025 and 2035
  • Figure 87: Middle East & Africa Market Y-o-Y Growth Comparison by Capacity, 2025 to 2035
  • Figure 88: Middle East & Africa Market Attractiveness Analysis by Capacity
  • Figure 89: Middle East & Africa Market Value Share and BPS Analysis by End-Use Industry, 2025 and 2035
  • Figure 90: Middle East & Africa Market Y-o-Y Growth Comparison by End-Use Industry, 2025 to 2035
  • Figure 91: Middle East & Africa Market Attractiveness Analysis by End-Use Industry
  • Figure 92: Global Market – Tier Structure Analysis
  • Figure 93: Global Market – Company Share Analysis
Dashboard
Dashboard
Dashboard
Dashboard
Dashboard
Dashboard

Our Research Products

Full Research Suite

The "Full Research Suite" delivers actionable market intel, deep dives on markets or technologies, so clients act faster, cut risk, and unlock growth.

Competitor Leaderboard Report

The Leaderboard benchmarks and ranks top vendors, classifying them as Established Leaders, Leading Challengers, or Disruptors & Challengers.

Future Leaders Index

Locates where complements amplify value and substitutes erode it, forecasting net impact by horizon

Market Data & Forecasts

We deliver granular, decision-grade intel: market sizing, 5-year forecasts, pricing, adoption, usage, revenue, and operational KPIs—plus competitor tracking, regulation, and value chains—across 60 countries broadly.

Market Focus Report

Spot the shifts before they hit your P&L. We track inflection points, adoption curves, pricing moves, and ecosystem plays to show where demand is heading, why it is changing, and what to do next across high-growth markets and disruptive tech

Survey Report

Real-time reads of user behavior. We track shifting priorities, perceptions of today’s and next-gen services, and provider experience, then pace how fast tech moves from trial to adoption, blending buyer, consumer, and channel inputs with social signals (#WhySwitch, #UX).

Bespoke Reports

Partner with our analyst team to build a custom report designed around your business priorities. From analysing market trends to assessing competitors or crafting bespoke datasets, we tailor insights to your needs.

Supplier Intelligence

Discovery & Profiling

Capacity & Footprint

Performance & Risk

Compliance & Governance

Commercial Readiness

Who Supplies Whom

Scorecards & Shortlists

Playbooks & Docs

Category Intelligence

Definition & Scope

Demand & Use Cases

Cost Drivers

Market Structure

Supply Chain Map

Trade & Policy

Operating Norms

Deliverables

Buyer Intelligence

Account Basics

Spend & Scope

Procurement Model

Vendor Requirements

Terms & Policies

Entry Strategy

Pain Points & Triggers

Outputs

Pricing Analysis

Benchmarks

Trends

Should-Cost

Indexation

Landed Cost

Commercial Terms

Deliverables

Brand Analysis

Positioning & Value Prop

Share & Presence

Customer Evidence

Go-to-Market

Digital & Reputation

Compliance & Trust

KPIs & Gaps

Outputs

Full Research Suite comprises of:

Market outlook & trends analysis

Market outlook & trends analysis

Interviews & case studies

Interviews & case studies

Strategic recommendations

Strategic recommendations

Vendor profiles & capabilities analysis

Vendor profiles & capabilities analysis

5-year forecasts

5-year forecasts

8 regions and 60+ country-level data splits

8 regions and 60+ country-level data splits

Market segment data splits

Market segment data splits

12 months of continuous data updates

12 months of continuous data updates

DELIVERED AS:

PDF EXCEL ONLINE

Full Research Suite


$5000

$7500

$10000

Buy Report Now
Similar Industry Reports

Similar Industry Reports

Cable Line Fault Indicator Market

Cable Line Fault Indicator Market Size and Share Forecast Outlook 2025 to 2035

Cable Tray Market
Cable Tray Market

Cable Tray Market Size and Share Forecast Outlook 2025 to 2035

Cable Distribution Cabinets Market

Cable Distribution Cabinets Market Size and Share Forecast Outlook 2025 to 2035

Granulator Machines Market

Granulator Machines Market Size and Share Forecast Outlook 2025 to 2035

Cable Accessories Market

Cable Accessories Market Growth - Trends & Forecast 2025 to 2035

Cable Cleaning Solutions Market

Cable Cleaning Solutions Market Analysis - Size, Share, and Forecast Outlook 2025 to 2035

Cable Cleaning Equipment Market

Cable Cleaning Equipment Market Analysis - Size, Share, and Forecast Outlook 2025 to 2035

Cable Material Market

Cable Material Market Growth - Trends & Forecast 2025 to 2035

Cable Fault Locator Market

Cable Fault Locator Market Size, Share, and Forecast 2025 to 2035

Cable Connectors and Adapters Market

Cable Connectors and Adapters Market Analysis by Application, Product, Type and Region: Forecast from 2025 to 2035

Cable Cars and Ropeways Market

Cable Cars and Ropeways Market Growth - Trends & Forecast 2025 to 2035

Cable Wrapping Tape Market

Cable Wrapping Tape Market

Cable Racks Market
Cable Racks Market

Cable Racks Market

Cable Testing Market

Cable Testing Market

Cable Assemblies Market

Cable Assemblies Market

Cable Carrier Market

Cable Carrier Market

Cable Detector Market

Cable Detector Market

Cable Flange Market
Cable Flange Market

Cable Flange Market

LED Cable Market
LED Cable Market

LED Cable Market

HVDC Cables Market
HVDC Cables Market

HVDC Cables Market Size and Share Forecast Outlook 2025 to 2035

Future Market Insights

Cable Granulator Market

Chat With MaRIA

Chat With

MaRIA

Hi There, I am MaRIA, Your Market Research Intelligence Assistant. How may I help you?