Methodology

Cable Cleaning Solutions Market Size and Share Forecast Outlook 2025 to 2035

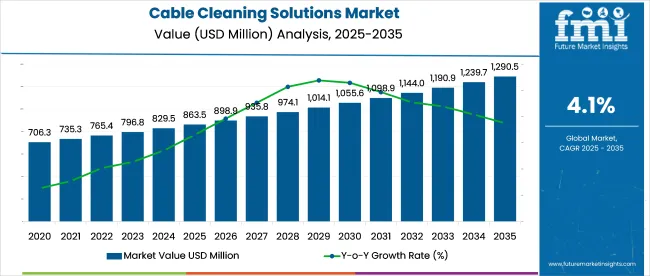
In 2025, the cable cleaning solutions market is valued at USD 863.5 million and begins a forecast period that will see a CAGR of 4.1%, reaching USD 1290.5 million by 2035.
Quick Stats of Cable Cleaning Solutions Market

  • Market Value (2025): USD 863.5 million
  • Forecast Value (2035): USD 1290.5 million
  • Forecast CAGR: 4.1%
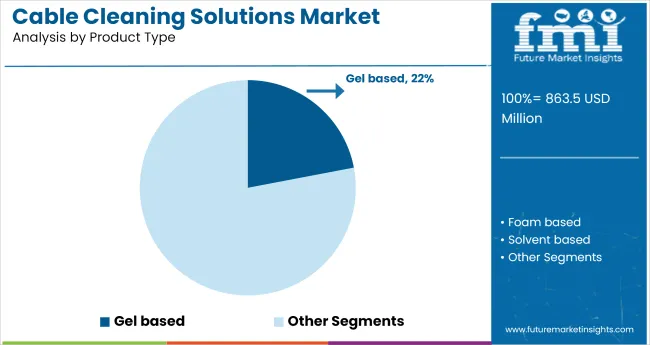
  • Product Leader in 2025: Gel-based Cleaning Solutions (22% share of product-type demand)
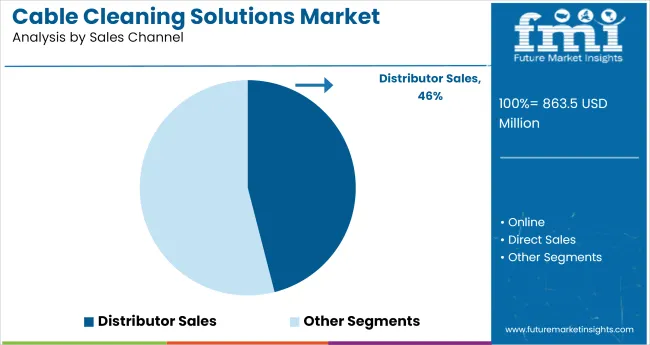
  • Top Distribution Channel: Distributor Sales (46% market share)
  • Key Growth Region: India (highest CAGR at 5.3%)
  • Leading Player: Chemtronics (23% market share)

Cable Cleaning Solutions Market

Attribute Detail
Industry Size (2025) USD 863.5 million
Industry Size (2035) USD 1290.5 million
CAGR (2025 to 2035) 4.1%

The growth is driven by increased installation of fiber optic and 5G infrastructure, offshore wind projects, and railway electrification-each requiring strict cable cleaning protocols. Regulatory changes across North America, Europe, and Asia-Pacific are accelerating demand for low-VOC, non-flammable, and biodegradable cleaning agents. Utility and telecom operators prefer pre-saturated wipes, aerosol sprays, and fast-drying fluids to maintain cable performance and minimize failures in high-voltage and automated systems.

The cable cleaning solutions market holds a niche share across its parent sectors, driven by specialized maintenance needs in power and telecom infrastructure. Within the industrial cleaning solutions market, it accounts for approximately 3-5%, given its role in electrical system maintenance. In the electrical maintenance market, its share is around 6-8%, supported by growing demand for reliability in transmission networks.

It represents about 4-6% of the wire and cable management market, where cleaning is integral to long-term cable performance. In the specialty chemicals industry, its presence is limited to 1-2%, as it competes with a wide range of industrial applications. Within the utility and power infrastructure maintenance market, it holds an estimated 2-3%, largely driven by periodic servicing requirements for medium- and high-voltage cables.

In a January 2024 interview with Utility Products, David Ancona, director of marketing at Polywater®, emphasized the operational importance of clean cables, stating that contamination compromises performance-particularly in high-voltage and fiber optic systems. He noted that, given the increasing load on energy and data infrastructure, effective cable cleaning has become a non-negotiable aspect of reliability planning. This viewpoint reflects a broader industry shift toward preventive maintenance as a strategic function

Analysis of Cable Cleaning Solutions Market by Top Investment Segments

The cable cleaning solutions industry is experiencing growth due to increased maintenance cycles across utility-grade cabling, expanded fiber-optic deployments, and MRO activities in industrial plants. In 2025, the market is shaped by evolving safety norms, dielectric compatibility, and precision-based cleaning tools.
Gel-Based Cleaners to Represent 22% of Product Type Demand in 2025

Cable Cleaning Solutions Market Analysis By Product Type

Gel-based cable cleaning products are estimated to hold 22% of total product-type demand in 2025. Their growth is tied to environments requiring precise application and minimal residue, particularly in sealed or overhead electrical systems.

  • Gel cleaners are increasingly preferred for fiber splice enclosures and medium-voltage joints, where capillary creep and solvent splashing must be avoided during cleaning.
  • Emerging markets in South Asia and Latin America are showing above-average growth due to widespread use in off-grid energy systems and solar-powered cable runs.
  • Vendors like Techspray and Polywater have introduced temperature-stable gel formulations for environments ranging from to 20°C to +50°C, used in outdoor telecom and energy infrastructure.

Electrical Cable Cleaning to Dominate Applications with 42% Market Share

Electrical cable cleaning accounts for 42% of the total application segment in 2025, driven by high-voltage asset life extension and dielectric surface decontamination in critical nodes.
  • Power-intensive industries (steel, cement, refining) are moving to semi-annual switchgear cleaning to reduce unplanned outages linked to tracking faults and surface arcing.
  • Increasing adoption of XLPE-insulated cables in metro projects and wind farms requires regular insulation cleaning using non-hygroscopic solvents and antistatic compounds.
  • Cleaning protocols have become standardized under utility-driven audits in the USA, Canada, and Germany-requiring full documentation of cleaning agents used during planned outages.

Utilities Segment Leads End-Use with 38% Market Share in 2025

Cable Cleaning Solutions Market Analysis By End Use

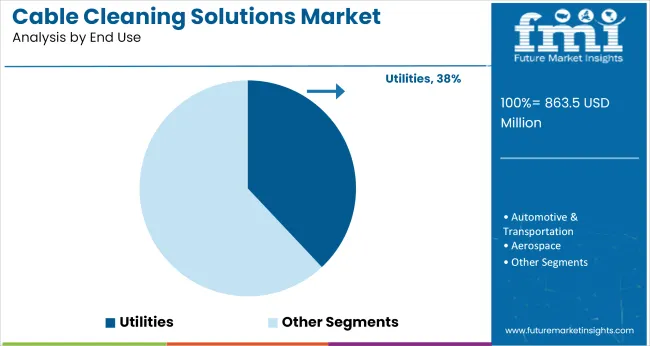
Utility companies are expected to represent 38% of total end-use demand in 2025. Their purchasing patterns are defined by asset density, inspection requirements, and regional grid expansion projects.
  • Large-scale rollout of underground distribution cabling in urban zones is increasing the use of environmentally safe cleaners that meet local discharge and waste handling norms.
  • Transmission system operators are shifting toward kit-based solutions with pre-saturated wipes and voltage-specific formulations to standardize field crew procedures.
  • Maintenance contractors working under performance-based asset contracts are emphasizing non-flammable and non-conductive formulations to meet insurance compliance.

Distributor Sales Channel to Hold 46% of Market Share in 2025

Cable Cleaning Solutions Market Analysis By Sales Channel

Distributor-based sales are projected to account for 46% of total cable cleaning solution sales in 2025, with growth driven by consolidated procurement and industrial partnerships.

  • Distributors now offer custom-labeled private brands to electrical contractors and OEMs, creating SKU differentiation while reducing cost per application.
  • The rise of digital MRO procurement platforms (e.g., Fastenal, Motion, and RS PRO) has enabled same-day shipping and compliance tagging, especially for OEM-specific formulations.
  • Tier 1 distributors are bundling cleaning agents with preventive maintenance kits for annual switchgear servicing, particularly in oil & gas and transport infrastructure.

Top Cable Cleaning Solutions Market Dynamics

The industry is driven by rising installation of high-voltage infrastructure, demand for uninterrupted power transmission, and maintenance of aging grid systems. Growth is influenced by stringent safety norms, increased utility investments, and deployment across telecom and data centers, with manufacturers focusing on efficiency, residue control, and dielectric integrity.

Adoption Rises Across Utilities and Data Infrastructure Projects

Cable cleaning solutions are being deployed to reduce failure rates in power and communication networks. Utilities are expanding usage of non-conductive solvents and lint-free wipes to minimize downtime during scheduled maintenance. In Q2 2025, procurement data from grid operators in Southeast Asia showed a 21% increase in bulk orders of gel-based degreasers for substation-level cleaning.

Fiber-optic deployments in Latin America are also driving demand for alcohol-based cleaning fluids, with regional telecom installers reporting a 14% drop in connector signal loss following regular cleaning protocol adoption. Portable cable-cleaning kits, packaged for field-service applications, are being rolled out through OEM maintenance contracts and EPC vendors.

Regulatory and Technical Standards Influence Product Selection

Compliance with fire safety, dielectric strength, and residue limits is determining solution choice. Cable manufacturers are specifying cleaning agents that meet IEC 61340 and ASTM D257 standards to ensure insulation performance. Since early 2025, demand for low-VOC formulations has risen among EU-based contractors, prompted by tightening indoor air quality rules under REACH compliance.

QR-coded safety data sheets and tamper-seal packaging have become default features across institutional supply contracts, reducing misuse and inventory misplacement. In response, vendors are investing in solvent blends with faster evaporation profiles and minimal residue-cutting post-cleaning downtime by 11% across heavy-duty installations in mining and metro rail networks.
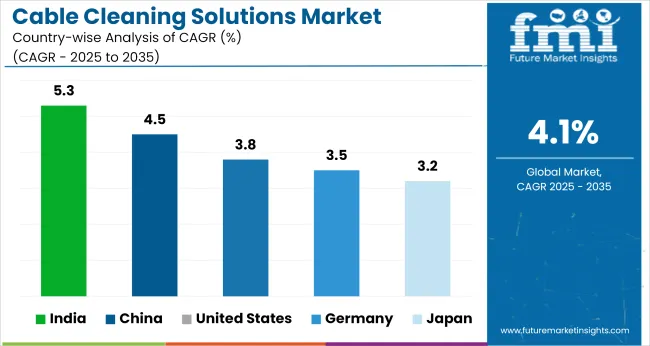
Top Countries Manufacturing, Applying, and Creating Demand for Cable Cleaning Solutions

Country Wise Analysis Of Cable Cleaning Solutions Market

Countries CAGR (2025 to 2035)
India 5.3%
China 4.5%
United States 3.8%
Germany 3.5%
Japan 3.2%

Global demand for cable cleaning solutions is projected to expand at a 4.1% CAGR from 2025 to 2035. India leads among the profiled countries at 5.3%, delivering a +29% premium over the global benchmark, driven by infrastructure investment and grid modernization. China follows at 4.5% (+10%), supported by rapid expansion in telecommunications and industrial electrification.

The United States lags slightly at 3.8% (-7%), while Germany and Japan trail further at 3.5% (-15%) and 3.2% (-22%), respectively, reflecting mature utility networks and slower replacement cycles. BRICS countries are exhibiting stronger growth than OECD peers due to ongoing electrification and industrial scale-ups.

The report covers detailed analysis of 40+ countries, with the top five countries shared as a reference.

Analysis of Cable Cleaning Solutions Market in China

The cable cleaning solutions market in China is projected to expand at a CAGR of 4.5% from 2025 to 2035. Growth is shaped by continuous expansion in industrial automation, high-voltage transmission, and electric vehicle production. Cleaning solutions have gained widespread application due to rising contamination risks in precision cable assemblies.

Domestic production of high-speed rail and smart grids reinforces cleaning protocols, especially in insulation-sensitive environments. Demand has been observed from state-owned enterprises managing large infrastructure corridors, where downtime prevention remains a top operational metric. Customized solvent-based formulations are being adopted in environments with varied humidity and dust levels.

  • Usage of non-flammable, low-VOC cleaning agents has increased in cable manufacturing zones.
  • Integration of cable cleaning into maintenance automation software is becoming common across major industrial hubs.
  • Regulations linked to preventive equipment maintenance in renewable energy installations support industry expansion.

Growth Outlook for Cable Cleaning Solutions Market in the United States

The USA cable cleaning solutions market is expected to grow at a CAGR of 3.8% during the forecast period, driven by sustained investment in fiber optic infrastructure and military-grade cabling systems. Increased focus on reducing signal degradation in long-range data and power cables has intensified the use of high-performance cleaning systems.

Manufacturers are prioritizing lint-free cleaning agents and static-neutralizing compounds for structured cabling environments. Utilities and defense agencies have transitioned to certified cable cleaning protocols as part of system durability benchmarks.

  • Cloud data centers and subsea cable systems have contributed to greater demand for precision cleaning.
  • Transition from manual cleaning to automated dispensers is being adopted by Tier 1 OEMs.
  • Cleaning standards aligned with ANSI/TIA-568 and MIL-SPEC guidelines are becoming a procurement criterion.

Analysis of Cable Cleaning Solutions Market in India

The cable cleaning solutions industry in India is projected to grow at the fastest CAGR of 5.3% between 2025 and 2035. Demand growth is centered around the expansion of telecom towers, metro rail electrification, and transmission corridor upgrades. A visible shift has occurred toward alcohol-free and residue-free cable cleaning compounds in industrial and utility settings.

Maintenance contractors are adopting scheduled cleaning as part of SLA compliance in sectors including power, mining, and infrastructure. As reliance on fiber networks grows across Tier 2 and Tier 3 cities, cable care kits and portable cleaning systems are being increasingly procured by field service teams.

  • A surge in demand for isopropyl-alternative cleaning sprays has been seen in outdoor applications.
  • Equipment rentals that include cable maintenance services now bundle solvent packs for on-site cleaning.
  • Power grid maintenance contracts increasingly specify anti-static cleaning wipes and UV-safe solutions.

Future Outlook for Cable Cleaning Solutions Market in Germany

The cable cleaning solutions industry in Germany is set to expand at a CAGR of 3.5% from 2025 to 2035, underpinned by adoption in automotive wire harnesses and robotics-heavy manufacturing. Cable management practices have evolved with tighter tolerances in EV charging setups and factory floor automation.

The focus has shifted toward anti-corrosion, dielectric-safe formulations that extend cable life in high-heat industrial environments. Standards enforced across industrial production zones have created steady demand for cleaning solutions compatible with copper, fiber, and hybrid wiring. Preventive maintenance cycles integrated into Industry 4.0 platforms have institutionalized regular cable care procedures.

  • Use of electrostatic-safe cloths and solvent pens has expanded in precision robotics.
  • Specialized brushless cleaning tools are being used in cable tunnels of high-output manufacturing units.
  • OEM specifications are now favoring pH-neutral formulations to prevent sheath hardening.

Cable Cleaning Solutions Market Growth Analysis in Japan

The cable cleaning solutions market in Japan is forecast to register a CAGR of 3.2% during the 2025 to 2035 period. Demand is driven by aging infrastructure in transport and power sectors, where cabling systems require preventive care. Cable cleaning agents designed for confined spaces and underground systems have gained prominence, particularly in densely packed substation and tunnel environments.

Compact cable systems in smart electronics and automation lines have furthered the shift toward residue-free, high-purity solvents. Cable integrity audits now include cleaning compliance to ensure insulation resistance and minimize downtime.
  • Growth in rail network electrification has pushed demand for solvent-free cable surface cleaners.
  • Multi-surface compatibility is increasingly being prioritized for varied insulation types in robotics lines.
  • Consumer electronics assembly facilities prefer low-odor, rapid-evaporation cleaning agents.

Leading Cable Cleaning Solutions Manufacturers, Suppliers, Distributors

Cable Cleaning Solutions Market Analysis By Company

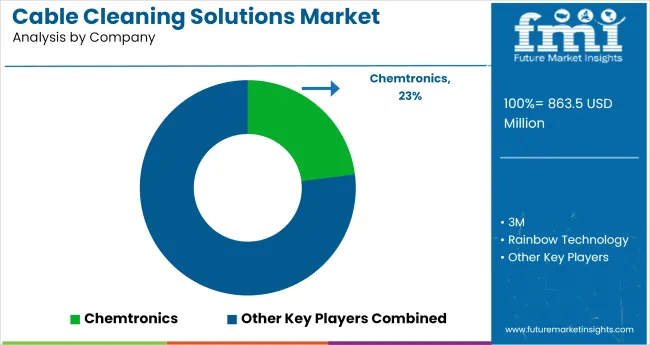
Leading player - Chemtronics holding 23% industry Share

The cable cleaning solutions market is shaped by key players with proprietary formulations and entrenched distribution networks. CRC Industries offers HF Precision Cleaner, widely used in substations, while 3M’s cable cleaning pads dominate fiber maintenance due to broad compatibility. Chemtronics has advanced its Electro-Wash range for residue-free field use, and Polywater’s Grime-Away wipes target utility installations. Rainbow Technology continues supplying region-specific kits for hybrid cable systems.

New entrants face barriers including patented chemical blends, regulatory delays, and long-standing procurement contracts. KleanGrip LLC has introduced single-use pouches to minimize job-site waste, while Carl Roth GmbH & Co. KG targets Western Europe via lab-grade imports.

Recent Industry News

  • March 2025 - Forward Consumer Partners acquired SerVaas Laboratories, including the Bar Keepers Friend (BKF) brand, to expand into industrial cable cleaning chemicals. BKF’s proprietary formulations are being repurposed for electrical contact cleaning, targeting applications in power distribution and telecom infrastructure.
  • January 2025 -At CES, Dreame launched its ProLeap System robotic arms, designed for cable handling and trench debris removal, while Ecovacs introduced hybrid stick/robot vacuums adapted for industrial cable trench cleaning, enhancing automation in utility-grade maintenance.

Leading Players

  • Chemtronic
  • CRC Industries
  • KleanGrip LLC
  • Polywater
  • Global Specialty Products USA, Inc. (GSP USA)
  • 3M
  • Rainbow Technology
  • Carl Roth GmbH & Co. KG

Report Scope

Report Attributes Details
Market Size (2025) USD 863.5 million
Projected Market Size (2035) USD 1290.5 million
CAGR (2025 to 2035) 4.1%
Base Year for Estimation 2024
Historical Period 2020 to 2024
Projections Period 2025 to 2035
Quantitative Units USD million for value
Product Types Analyzed (Segment 1) Gel-based, Foam-based, Solvent-based
Applications Analyzed (Segment 2) Electrical Cable Cleaning, Fiber Optic Cable Cleaning, Telecom Cable Cleaning, Control Cable Cleaning
End Uses Analyzed (Segment 3) Utilities, Automotive & Transportation, Aerospace, Construction and Infrastructure, Industrial Plants, Machine MRO Centres, Others
Sales Channels Analyzed (Segment 4) Distributor Sales, Online, Direct Sales
Regions Covered North America; Latin America; Eastern Europe; Western Europe; South Asia & Pacific; East Asia; Middle East & Africa
Countries Covered United States, Canada, Brazil, Mexico, Germany, United Kingdom, France, Italy, China, Japan, South Korea, India, Australia, UAE, South Africa
Key Players CRC Industries, KleanGrip LLC, Polywater, Global Specialty Products USA, Inc. (GSP USA), 3M, Chemtronics, Rainbow Technology, Carl Roth GmbH & Co. KG
Additional Attributes Dollar sales, share by product type and application, increasing demand from fiber optic and telecom segments, adoption in industrial plants and machine MRO centers, regional production patterns and cross-border distribution from East Asia and North America.

Cable Cleaning Solutions Market Analyzed by Key Investment Segments

By Product Type:

  • Gel based
  • Foam based
  • Solvent based

By Application:

  • Electrical Cable Cleaning
  • Fiber Optic Cable Cleaning
  • Telecom Cable Cleaning
  • Control Cable Cleaning

By End Use:

  • Utilities
  • Automotive & Transportation
  • Aerospace
  • Construction and Infrastructure
  • Industrial Plants
  • Machine MRO Centres
  • Others

By Sales Channel:

  • Distributor Sales
  • Online
  • Direct Sales

By Region:

  • North America
  • Latin America
  • Eastern Europe
  • Western Europe
  • South Asia & Pacific
  • East Asia
  • Middle East & Africa

Frequently Asked Questions

What is the projected CAGR of the cable cleaning solutions market from 2025 to 2035?

The industry is projected to grow at a CAGR of 4.1% during 2025 to 2035.

Which country is expected to register the highest CAGR in this market?

India leads with a forecast CAGR of 5.3% from 2025 to 2035.

What share will gel-based cleaners hold in the product segment in 2025?

Gel-based cleaners are estimated to account for 22% of product-type demand in 2025.

How much market share will electrical cable cleaning hold by application in 2025?

Electrical cable cleaning will represent 42% of the application segment in 2025.

What percentage of sales will distributor channels contribute in 2025?

Distributor-based sales are projected to hold 46% of the total industry in 2025.

Table of Content

  1. Executive Summary
    • Global Market Outlook
    • Demand-side Trends
    • Supply-side Trends
    • Technology Roadmap Analysis
    • Analysis and Recommendations
  2. Market Overview
    • Market Coverage / Taxonomy
    • Market Definition / Scope / Limitations
  3. Market Background
    • Market Dynamics
      • Drivers
      • Restraints
      • Opportunity
      • Trends
    • Scenario Forecast
      • Demand in Optimistic Scenario
      • Demand in Likely Scenario
      • Demand in Conservative Scenario
    • Opportunity Map Analysis
    • Product Life Cycle Analysis
    • Supply Chain Analysis
      • Supply Side Participants and their Roles
        • Producers
        • Mid-Level Participants (Traders/ Agents/ Brokers)
        • Wholesalers and Distributors
      • Value Added and Value Created at Node in the Supply Chain
      • List of Raw Material Suppliers
      • List of Existing and Potential Buyer’s
    • Investment Feasibility Matrix
    • Value Chain Analysis
      • Profit Margin Analysis
      • Wholesalers and Distributors
      • Retailers
    • PESTLE and Porter’s Analysis
    • Regulatory Landscape
      • By Key Regions
      • By Key Countries
    • Regional Parent Market Outlook
    • Production and Consumption Statistics
    • Import and Export Statistics
  4. Global Market Analysis 2020 to 2024 and Forecast, 2025 to 2035
    • Historical Market Size Value (USD Billion) & Volume (K Units) Analysis, 2020 to 2024
    • Current and Future Market Size Value (USD Billion) & Volume (K Units) Projections, 2025 to 2035
      • Y-o-Y Growth Trend Analysis
      • Absolute $ Opportunity Analysis
  5. Global Market Pricing Analysis 2020 to 2024 and Forecast 2025 to 2035
  6. Global Market Analysis 2020 to 2024 and Forecast 2025 to 2035, By Product Type
    • Introduction / Key Findings
    • Historical Market Size Value (USD Billion) & Volume (K Units) Analysis By Product Type, 2020 to 2024
    • Current and Future Market Size Value (USD Billion) & Volume (K Units) Analysis and Forecast By Product Type, 2025 to 2035
      • Gel based
      • Foam based
      • Solvent based
    • Y-o-Y Growth Trend Analysis By Product Type, 2020 to 2024
    • Absolute $ Opportunity Analysis By Product Type, 2025 to 2035
  7. Global Market Analysis 2020 to 2024 and Forecast 2025 to 2035, By Application
    • Introduction / Key Findings
    • Historical Market Size Value (USD Billion) & Volume (K Units) Analysis By Application, 2020 to 2024
    • Current and Future Market Size Value (USD Billion) & Volume (K Units) Analysis and Forecast By Application, 2025 to 2035
      • Electrical Cable Cleaning
      • Fiber Optic Cable Cleaning
      • Telecom Cable Cleaning
      • Control Cable Cleaning
    • Y-o-Y Growth Trend Analysis By Application, 2020 to 2024
    • Absolute $ Opportunity Analysis By Application, 2025 to 2035
  8. Global Market Analysis 2020 to 2024 and Forecast 2025 to 2035, By End Use
    • Introduction / Key Findings
    • Historical Market Size Value (USD Billion) & Volume (K Units) Analysis By End Use, 2020 to 2024
    • Current and Future Market Size Value (USD Billion) & Volume (K Units) Analysis and Forecast By End Use, 2025 to 2035
      • Utilities
      • Automotive & Transportation
      • Aerospace
      • Construction and Infrastructure
      • Industrial Plants
      • Machine MRO Centres
      • Others
    • Y-o-Y Growth Trend Analysis By End Use, 2020 to 2024
    • Absolute $ Opportunity Analysis By End Use, 2025 to 2035
  9. Global Market Analysis 2020 to 2024 and Forecast 2025 to 2035, By Sales Channel
    • Introduction / Key Findings
    • Historical Market Size Value (USD Billion) & Volume (K Units) Analysis By Sales Channel, 2020 to 2024
    • Current and Future Market Size Value (USD Billion) & Volume (K Units) Analysis and Forecast By Sales Channel, 2025 to 2035
      • Distributor Sales
      • Online
      • Direct Sales
    • Y-o-Y Growth Trend Analysis By Sales Channel, 2020 to 2024
    • Absolute $ Opportunity Analysis By Sales Channel, 2025 to 2035
  10. Global Market Analysis 2020 to 2024 and Forecast 2025 to 2035, By Region
    • Introduction
    • Historical Market Size Value (USD Billion) & Volume (K Units) Analysis By Region, 2020 to 2024
    • Current Market Size Value (USD Billion) & Volume (K Units) Analysis and Forecast By Region, 2025 to 2035
      • North America
      • Latin America
      • Western Europe
      • Eastern Europe
      • East Asia
      • South Asia & Pacific
      • Middle East and Africa
    • Market Attractiveness Analysis By Region
  11. North America Market Analysis 2020 to 2024 and Forecast 2025 to 2035, By Country
    • Historical Market Size Value (USD Billion) & Volume (K Units) Trend Analysis By Market Taxonomy, 2020 to 2024
    • Market Size Value (USD Billion) & Volume (K Units) Forecast By Market Taxonomy, 2025 to 2035
      • By Country
        • USA
        • Canada
        • Mexico
      • By Product Type
      • By Application
      • By End Use
      • By Sales Channel
    • Market Attractiveness Analysis
      • By Country
      • By Product Type
      • By Application
      • By End Use
      • By Sales Channel
    • Key Takeaways
  12. Latin America Market Analysis 2020 to 2024 and Forecast 2025 to 2035, By Country
    • Historical Market Size Value (USD Billion) & Volume (K Units) Trend Analysis By Market Taxonomy, 2020 to 2024
    • Market Size Value (USD Billion) & Volume (K Units) Forecast By Market Taxonomy, 2025 to 2035
      • By Country
        • Brazil
        • Argentina
        • Rest of LATAM
      • By Product Type
      • By Application
      • By End Use
      • By Sales Channel
    • Market Attractiveness Analysis
      • By Country
      • By Product Type
      • By Application
      • By End Use
      • By Sales Channel
    • Key Takeaways
  13. Western Europe Market Analysis 2020 to 2024 and Forecast 2025 to 2035, By Country
    • Historical Market Size Value (USD Billion) & Volume (K Units) Trend Analysis By Market Taxonomy, 2020 to 2024
    • Market Size Value (USD Billion) & Volume (K Units) Forecast By Market Taxonomy, 2025 to 2035
      • By Country
        • Germany
        • Italy
        • France
        • UK
        • Spain
        • BENELUX
        • Nordic
        • Rest of W.Europe
      • By Product Type
      • By Application
      • By End Use
      • By Sales Channel
    • Market Attractiveness Analysis
      • By Country
      • By Product Type
      • By Application
      • By End Use
      • By Sales Channel
    • Key Takeaways
  14. Eastern Europe Market Analysis 2020 to 2024 and Forecast 2025 to 2035, By Country
    • Historical Market Size Value (USD Billion) & Volume (K Units) Trend Analysis By Market Taxonomy, 2020 to 2024
    • Market Size Value (USD Billion) & Volume (K Units) Forecast By Market Taxonomy, 2025 to 2035
      • By Country
        • Russia
        • Hungary
        • Poland
        • Balkan & Baltics
        • Rest of E. Europe
      • By Product Type
      • By Application
      • By End Use
      • By Sales Channel
    • Market Attractiveness Analysis
      • By Country
      • By Product Type
      • By Application
      • By End Use
      • By Sales Channel
    • Key Takeaways
  15. East Asia Market Analysis 2020 to 2024 and Forecast 2025 to 2035, By Country
    • Historical Market Size Value (USD Billion) & Volume (K Units) Trend Analysis By Market Taxonomy, 2020 to 2024
    • Market Size Value (USD Billion) & Volume (K Units) Forecast By Market Taxonomy, 2025 to 2035
      • By Country
        • China
        • Japan
        • South Korea
      • By Product Type
      • By Application
      • By End Use
      • By Sales Channel
    • Market Attractiveness Analysis
      • By Country
      • By Product Type
      • By Application
      • By End Use
      • By Sales Channel
    • Key Takeaways
  16. South Asia & Pacific Market Analysis 2020 to 2024 and Forecast 2025 to 2035, By Country
    • Historical Market Size Value (USD Billion) & Volume (K Units) Trend Analysis By Market Taxonomy, 2020 to 2024
    • Market Size Value (USD Billion) & Volume (K Units) Forecast By Market Taxonomy, 2025 to 2035
      • By Country
        • India
        • Australia & New Zealand
        • ASEAN
        • Rest of SAP
      • By Product Type
      • By Application
      • By End Use
      • By Sales Channel
    • Market Attractiveness Analysis
      • By Country
      • By Product Type
      • By Application
      • By End Use
      • By Sales Channel
    • Key Takeaways
  17. Middle East and Africa Market Analysis 2020 to 2024 and Forecast 2025 to 2035, By Country
    • Historical Market Size Value (USD Billion) & Volume (K Units) Trend Analysis By Market Taxonomy, 2020 to 2024
    • Market Size Value (USD Billion) & Volume (K Units) Forecast By Market Taxonomy, 2025 to 2035
      • By Country
        • GCC Countries
        • Northern Africa
        • South Africa
        • Turkiye
        • Rest of MEA
      • By Product Type
      • By Application
      • By End Use
      • By Sales Channel
    • Market Attractiveness Analysis
      • By Country
      • By Product Type
      • By Application
      • By End Use
      • By Sales Channel
    • Key Takeaways
  18. Key Countries Market Analysis
    • USA
      • Pricing Analysis
      • Market Share Analysis, 2024
        • By Product Type
        • By Application
        • By End Use
        • By Sales Channel
    • Canada
      • Pricing Analysis
      • Market Share Analysis, 2024
        • By Product Type
        • By Application
        • By End Use
        • By Sales Channel
    • Brazil
      • Pricing Analysis
      • Market Share Analysis, 2024
        • By Product Type
        • By Application
        • By End Use
        • By Sales Channel
    • Mexico
      • Pricing Analysis
      • Market Share Analysis, 2024
        • By Product Type
        • By Application
        • By End Use
        • By Sales Channel
    • Argentina
      • Pricing Analysis
      • Market Share Analysis, 2024
        • By Product Type
        • By Application
        • By End Use
        • By Sales Channel
  19. Market Structure Analysis
    • Competition Dashboard
    • Competition Benchmarking
    • Market Share Analysis of Top Players
      • By Regional
      • By Product Type
      • By Application
      • By End Use
      • By Sales Channel
  20. Competition Analysis
    • Competition Deep Dive
      • CRC Industries
        • Overview
        • Product Portfolio
        • Profitability by Market Segments (Product/Age /Sales Channel/Region)
        • Sales Footprint
        • Strategy Overview
          • Marketing Strategy
          • Product Strategy
          • Channel Strategy
      • KleanGrip LLC
        • Overview
        • Product Portfolio
        • Profitability by Market Segments (Product/Age /Sales Channel/Region)
        • Sales Footprint
        • Strategy Overview
          • Marketing Strategy
          • Product Strategy
          • Channel Strategy
      • Polywater
        • Overview
        • Product Portfolio
        • Profitability by Market Segments (Product/Age /Sales Channel/Region)
        • Sales Footprint
        • Strategy Overview
          • Marketing Strategy
          • Product Strategy
          • Channel Strategy
      • Global Specialty Products USA, Inc. (GSP USA)
        • Overview
        • Product Portfolio
        • Profitability by Market Segments (Product/Age /Sales Channel/Region)
        • Sales Footprint
        • Strategy Overview
          • Marketing Strategy
          • Product Strategy
          • Channel Strategy
      • 3M
        • Overview
        • Product Portfolio
        • Profitability by Market Segments (Product/Age /Sales Channel/Region)
        • Sales Footprint
        • Strategy Overview
          • Marketing Strategy
          • Product Strategy
          • Channel Strategy
      • Chemtronics
        • Overview
        • Product Portfolio
        • Profitability by Market Segments (Product/Age /Sales Channel/Region)
        • Sales Footprint
        • Strategy Overview
          • Marketing Strategy
          • Product Strategy
          • Channel Strategy
      • Rainbow Technology
        • Overview
        • Product Portfolio
        • Profitability by Market Segments (Product/Age /Sales Channel/Region)
        • Sales Footprint
        • Strategy Overview
          • Marketing Strategy
          • Product Strategy
          • Channel Strategy
      • Carl Roth GmbH & Co. KG
        • Overview
        • Product Portfolio
        • Profitability by Market Segments (Product/Age /Sales Channel/Region)
        • Sales Footprint
        • Strategy Overview
          • Marketing Strategy
          • Product Strategy
          • Channel Strategy
  21. Assumptions & Acronyms Used
  22. Research Methodology

List of Tables

  • Table 1: Global Market Value (USD Billion) Forecast by Region, 2020 to 2035
  • Table 2: Global Market Volume (K Units) Forecast by Region, 2020 to 2035
  • Table 3: Global Market Value (USD Billion) Forecast by Product Type, 2020 to 2035
  • Table 4: Global Market Volume (K Units) Forecast by Product Type, 2020 to 2035
  • Table 5: Global Market Value (USD Billion) Forecast by Application, 2020 to 2035
  • Table 6: Global Market Volume (K Units) Forecast by Application, 2020 to 2035
  • Table 7: Global Market Value (USD Billion) Forecast by End Use, 2020 to 2035
  • Table 8: Global Market Volume (K Units) Forecast by End Use, 2020 to 2035
  • Table 9: Global Market Value (USD Billion) Forecast by Sales Channel, 2020 to 2035
  • Table 10: Global Market Volume (K Units) Forecast by Sales Channel, 2020 to 2035
  • Table 11: North America Market Value (USD Billion) Forecast by Country, 2020 to 2035
  • Table 12: North America Market Volume (K Units) Forecast by Country, 2020 to 2035
  • Table 13: North America Market Value (USD Billion) Forecast by Product Type, 2020 to 2035
  • Table 14: North America Market Volume (K Units) Forecast by Product Type, 2020 to 2035
  • Table 15: North America Market Value (USD Billion) Forecast by Application, 2020 to 2035
  • Table 16: North America Market Volume (K Units) Forecast by Application, 2020 to 2035
  • Table 17: North America Market Value (USD Billion) Forecast by End Use, 2020 to 2035
  • Table 18: North America Market Volume (K Units) Forecast by End Use, 2020 to 2035
  • Table 19: North America Market Value (USD Billion) Forecast by Sales Channel, 2020 to 2035
  • Table 20: North America Market Volume (K Units) Forecast by Sales Channel, 2020 to 2035
  • Table 21: Latin America Market Value (USD Billion) Forecast by Country, 2020 to 2035
  • Table 22: Latin America Market Volume (K Units) Forecast by Country, 2020 to 2035
  • Table 23: Latin America Market Value (USD Billion) Forecast by Product Type, 2020 to 2035
  • Table 24: Latin America Market Volume (K Units) Forecast by Product Type, 2020 to 2035
  • Table 25: Latin America Market Value (USD Billion) Forecast by Application, 2020 to 2035
  • Table 26: Latin America Market Volume (K Units) Forecast by Application, 2020 to 2035
  • Table 27: Latin America Market Value (USD Billion) Forecast by End Use, 2020 to 2035
  • Table 28: Latin America Market Volume (K Units) Forecast by End Use, 2020 to 2035
  • Table 29: Latin America Market Value (USD Billion) Forecast by Sales Channel, 2020 to 2035
  • Table 30: Latin America Market Volume (K Units) Forecast by Sales Channel, 2020 to 2035
  • Table 31: Western Europe Market Value (USD Billion) Forecast by Country, 2020 to 2035
  • Table 32: Western Europe Market Volume (K Units) Forecast by Country, 2020 to 2035
  • Table 33: Western Europe Market Value (USD Billion) Forecast by Product Type, 2020 to 2035
  • Table 34: Western Europe Market Volume (K Units) Forecast by Product Type, 2020 to 2035
  • Table 35: Western Europe Market Value (USD Billion) Forecast by Application, 2020 to 2035
  • Table 36: Western Europe Market Volume (K Units) Forecast by Application, 2020 to 2035
  • Table 37: Western Europe Market Value (USD Billion) Forecast by End Use, 2020 to 2035
  • Table 38: Western Europe Market Volume (K Units) Forecast by End Use, 2020 to 2035
  • Table 39: Western Europe Market Value (USD Billion) Forecast by Sales Channel, 2020 to 2035
  • Table 40: Western Europe Market Volume (K Units) Forecast by Sales Channel, 2020 to 2035
  • Table 41: Eastern Europe Market Value (USD Billion) Forecast by Country, 2020 to 2035
  • Table 42: Eastern Europe Market Volume (K Units) Forecast by Country, 2020 to 2035
  • Table 43: Eastern Europe Market Value (USD Billion) Forecast by Product Type, 2020 to 2035
  • Table 44: Eastern Europe Market Volume (K Units) Forecast by Product Type, 2020 to 2035
  • Table 45: Eastern Europe Market Value (USD Billion) Forecast by Application, 2020 to 2035
  • Table 46: Eastern Europe Market Volume (K Units) Forecast by Application, 2020 to 2035
  • Table 47: Eastern Europe Market Value (USD Billion) Forecast by End Use, 2020 to 2035
  • Table 48: Eastern Europe Market Volume (K Units) Forecast by End Use, 2020 to 2035
  • Table 49: Eastern Europe Market Value (USD Billion) Forecast by Sales Channel, 2020 to 2035
  • Table 50: Eastern Europe Market Volume (K Units) Forecast by Sales Channel, 2020 to 2035
  • Table 51: East Asia Market Value (USD Billion) Forecast by Country, 2020 to 2035
  • Table 52: East Asia Market Volume (K Units) Forecast by Country, 2020 to 2035
  • Table 53: East Asia Market Value (USD Billion) Forecast by Product Type, 2020 to 2035
  • Table 54: East Asia Market Volume (K Units) Forecast by Product Type, 2020 to 2035
  • Table 55: East Asia Market Value (USD Billion) Forecast by Application, 2020 to 2035
  • Table 56: East Asia Market Volume (K Units) Forecast by Application, 2020 to 2035
  • Table 57: East Asia Market Value (USD Billion) Forecast by End Use, 2020 to 2035
  • Table 58: East Asia Market Volume (K Units) Forecast by End Use, 2020 to 2035
  • Table 59: East Asia Market Value (USD Billion) Forecast by Sales Channel, 2020 to 2035
  • Table 60: East Asia Market Volume (K Units) Forecast by Sales Channel, 2020 to 2035
  • Table 61: South Asia & Pacific Market Value (USD Billion) Forecast by Country, 2020 to 2035
  • Table 62: South Asia & Pacific Market Volume (K Units) Forecast by Country, 2020 to 2035
  • Table 63: South Asia & Pacific Market Value (USD Billion) Forecast by Product Type, 2020 to 2035
  • Table 64: South Asia & Pacific Market Volume (K Units) Forecast by Product Type, 2020 to 2035
  • Table 65: South Asia & Pacific Market Value (USD Billion) Forecast by Application, 2020 to 2035
  • Table 66: South Asia & Pacific Market Volume (K Units) Forecast by Application, 2020 to 2035
  • Table 67: South Asia & Pacific Market Value (USD Billion) Forecast by End Use, 2020 to 2035
  • Table 68: South Asia & Pacific Market Volume (K Units) Forecast by End Use, 2020 to 2035
  • Table 69: South Asia & Pacific Market Value (USD Billion) Forecast by Sales Channel, 2020 to 2035
  • Table 70: South Asia & Pacific Market Volume (K Units) Forecast by Sales Channel, 2020 to 2035
  • Table 71: Middle East and Africa Market Value (USD Billion) Forecast by Country, 2020 to 2035
  • Table 72: Middle East and Africa Market Volume (K Units) Forecast by Country, 2020 to 2035
  • Table 73: Middle East and Africa Market Value (USD Billion) Forecast by Product Type, 2020 to 2035
  • Table 74: Middle East and Africa Market Volume (K Units) Forecast by Product Type, 2020 to 2035
  • Table 75: Middle East and Africa Market Value (USD Billion) Forecast by Application, 2020 to 2035
  • Table 76: Middle East and Africa Market Volume (K Units) Forecast by Application, 2020 to 2035
  • Table 77: Middle East and Africa Market Value (USD Billion) Forecast by End Use, 2020 to 2035
  • Table 78: Middle East and Africa Market Volume (K Units) Forecast by End Use, 2020 to 2035
  • Table 79: Middle East and Africa Market Value (USD Billion) Forecast by Sales Channel, 2020 to 2035
  • Table 80: Middle East and Africa Market Volume (K Units) Forecast by Sales Channel, 2020 to 2035

List of Figures

  • Figure 1: Global Market Volume (K Units) Forecast 2020 to 2035
  • Figure 2: Global Market Pricing Analysis
  • Figure 3: Global Market Value (USD Billion) Forecast 2020 to 2035
  • Figure 4: Global Market Value Share and BPS Analysis by Product Type, 2025 and 2035
  • Figure 5: Global Market Y-o-Y Growth Comparison by Product Type, 2025 to 2035
  • Figure 6: Global Market Attractiveness Analysis by Product Type
  • Figure 7: Global Market Value Share and BPS Analysis by Application, 2025 and 2035
  • Figure 8: Global Market Y-o-Y Growth Comparison by Application, 2025 to 2035
  • Figure 9: Global Market Attractiveness Analysis by Application
  • Figure 10: Global Market Value Share and BPS Analysis by End Use, 2025 and 2035
  • Figure 11: Global Market Y-o-Y Growth Comparison by End Use, 2025 to 2035
  • Figure 12: Global Market Attractiveness Analysis by End Use
  • Figure 13: Global Market Value Share and BPS Analysis by Sales Channel, 2025 and 2035
  • Figure 14: Global Market Y-o-Y Growth Comparison by Sales Channel, 2025 to 2035
  • Figure 15: Global Market Attractiveness Analysis by Sales Channel
  • Figure 16: Global Market Value (USD Billion) Share and BPS Analysis by Region, 2025 and 2035
  • Figure 17: Global Market Y-o-Y Growth Comparison by Region, 2025 to 2035
  • Figure 18: Global Market Attractiveness Analysis by Region
  • Figure 19: North America Market Incremental $ Opportunity, 2025 to 2035
  • Figure 20: Latin America Market Incremental $ Opportunity, 2025 to 2035
  • Figure 21: Western Europe Market Incremental $ Opportunity, 2025 to 2035
  • Figure 22: Eastern Europe Market Incremental $ Opportunity, 2025 to 2035
  • Figure 23: East Asia Market Incremental $ Opportunity, 2025 to 2035
  • Figure 24: South Asia & Pacific Market Incremental $ Opportunity, 2025 to 2035
  • Figure 25: Middle East and Africa Market Incremental $ Opportunity, 2025 to 2035
  • Figure 26: North America Market Value Share and BPS Analysis by Country, 2025 and 2035
  • Figure 27: North America Market Value Share and BPS Analysis by Product Type, 2025 and 2035
  • Figure 28: North America Market Y-o-Y Growth Comparison by Product Type, 2025 to 2035
  • Figure 29: North America Market Attractiveness Analysis by Product Type
  • Figure 30: North America Market Value Share and BPS Analysis by Application, 2025 and 2035
  • Figure 31: North America Market Y-o-Y Growth Comparison by Application, 2025 to 2035
  • Figure 32: North America Market Attractiveness Analysis by Application
  • Figure 33: North America Market Value Share and BPS Analysis by End Use, 2025 and 2035
  • Figure 34: North America Market Y-o-Y Growth Comparison by End Use, 2025 to 2035
  • Figure 35: North America Market Attractiveness Analysis by End Use
  • Figure 36: North America Market Value Share and BPS Analysis by Sales Channel, 2025 and 2035
  • Figure 37: North America Market Y-o-Y Growth Comparison by Sales Channel, 2025 to 2035
  • Figure 38: North America Market Attractiveness Analysis by Sales Channel
  • Figure 39: Latin America Market Value Share and BPS Analysis by Country, 2025 and 2035
  • Figure 40: Latin America Market Value Share and BPS Analysis by Product Type, 2025 and 2035
  • Figure 41: Latin America Market Y-o-Y Growth Comparison by Product Type, 2025 to 2035
  • Figure 42: Latin America Market Attractiveness Analysis by Product Type
  • Figure 43: Latin America Market Value Share and BPS Analysis by Application, 2025 and 2035
  • Figure 44: Latin America Market Y-o-Y Growth Comparison by Application, 2025 to 2035
  • Figure 45: Latin America Market Attractiveness Analysis by Application
  • Figure 46: Latin America Market Value Share and BPS Analysis by End Use, 2025 and 2035
  • Figure 47: Latin America Market Y-o-Y Growth Comparison by End Use, 2025 to 2035
  • Figure 48: Latin America Market Attractiveness Analysis by End Use
  • Figure 49: Latin America Market Value Share and BPS Analysis by Sales Channel, 2025 and 2035
  • Figure 50: Latin America Market Y-o-Y Growth Comparison by Sales Channel, 2025 to 2035
  • Figure 51: Latin America Market Attractiveness Analysis by Sales Channel
  • Figure 52: Western Europe Market Value Share and BPS Analysis by Country, 2025 and 2035
  • Figure 53: Western Europe Market Value Share and BPS Analysis by Product Type, 2025 and 2035
  • Figure 54: Western Europe Market Y-o-Y Growth Comparison by Product Type, 2025 to 2035
  • Figure 55: Western Europe Market Attractiveness Analysis by Product Type
  • Figure 56: Western Europe Market Value Share and BPS Analysis by Application, 2025 and 2035
  • Figure 57: Western Europe Market Y-o-Y Growth Comparison by Application, 2025 to 2035
  • Figure 58: Western Europe Market Attractiveness Analysis by Application
  • Figure 59: Western Europe Market Value Share and BPS Analysis by End Use, 2025 and 2035
  • Figure 60: Western Europe Market Y-o-Y Growth Comparison by End Use, 2025 to 2035
  • Figure 61: Western Europe Market Attractiveness Analysis by End Use
  • Figure 62: Western Europe Market Value Share and BPS Analysis by Sales Channel, 2025 and 2035
  • Figure 63: Western Europe Market Y-o-Y Growth Comparison by Sales Channel, 2025 to 2035
  • Figure 64: Western Europe Market Attractiveness Analysis by Sales Channel
  • Figure 65: Eastern Europe Market Value Share and BPS Analysis by Country, 2025 and 2035
  • Figure 66: Eastern Europe Market Value Share and BPS Analysis by Product Type, 2025 and 2035
  • Figure 67: Eastern Europe Market Y-o-Y Growth Comparison by Product Type, 2025 to 2035
  • Figure 68: Eastern Europe Market Attractiveness Analysis by Product Type
  • Figure 69: Eastern Europe Market Value Share and BPS Analysis by Application, 2025 and 2035
  • Figure 70: Eastern Europe Market Y-o-Y Growth Comparison by Application, 2025 to 2035
  • Figure 71: Eastern Europe Market Attractiveness Analysis by Application
  • Figure 72: Eastern Europe Market Value Share and BPS Analysis by End Use, 2025 and 2035
  • Figure 73: Eastern Europe Market Y-o-Y Growth Comparison by End Use, 2025 to 2035
  • Figure 74: Eastern Europe Market Attractiveness Analysis by End Use
  • Figure 75: Eastern Europe Market Value Share and BPS Analysis by Sales Channel, 2025 and 2035
  • Figure 76: Eastern Europe Market Y-o-Y Growth Comparison by Sales Channel, 2025 to 2035
  • Figure 77: Eastern Europe Market Attractiveness Analysis by Sales Channel
  • Figure 78: East Asia Market Value Share and BPS Analysis by Country, 2025 and 2035
  • Figure 79: East Asia Market Value Share and BPS Analysis by Product Type, 2025 and 2035
  • Figure 80: East Asia Market Y-o-Y Growth Comparison by Product Type, 2025 to 2035
  • Figure 81: East Asia Market Attractiveness Analysis by Product Type
  • Figure 82: East Asia Market Value Share and BPS Analysis by Application, 2025 and 2035
  • Figure 83: East Asia Market Y-o-Y Growth Comparison by Application, 2025 to 2035
  • Figure 84: East Asia Market Attractiveness Analysis by Application
  • Figure 85: East Asia Market Value Share and BPS Analysis by End Use, 2025 and 2035
  • Figure 86: East Asia Market Y-o-Y Growth Comparison by End Use, 2025 to 2035
  • Figure 87: East Asia Market Attractiveness Analysis by End Use
  • Figure 88: East Asia Market Value Share and BPS Analysis by Sales Channel, 2025 and 2035
  • Figure 89: East Asia Market Y-o-Y Growth Comparison by Sales Channel, 2025 to 2035
  • Figure 90: East Asia Market Attractiveness Analysis by Sales Channel
  • Figure 91: South Asia & Pacific Market Value Share and BPS Analysis by Country, 2025 and 2035
  • Figure 92: South Asia & Pacific Market Value Share and BPS Analysis by Product Type, 2025 and 2035
  • Figure 93: South Asia & Pacific Market Y-o-Y Growth Comparison by Product Type, 2025 to 2035
  • Figure 94: South Asia & Pacific Market Attractiveness Analysis by Product Type
  • Figure 95: South Asia & Pacific Market Value Share and BPS Analysis by Application, 2025 and 2035
  • Figure 96: South Asia & Pacific Market Y-o-Y Growth Comparison by Application, 2025 to 2035
  • Figure 97: South Asia & Pacific Market Attractiveness Analysis by Application
  • Figure 98: South Asia & Pacific Market Value Share and BPS Analysis by End Use, 2025 and 2035
  • Figure 99: South Asia & Pacific Market Y-o-Y Growth Comparison by End Use, 2025 to 2035
  • Figure 100: South Asia & Pacific Market Attractiveness Analysis by End Use
  • Figure 101: South Asia & Pacific Market Value Share and BPS Analysis by Sales Channel, 2025 and 2035
  • Figure 102: South Asia & Pacific Market Y-o-Y Growth Comparison by Sales Channel, 2025 to 2035
  • Figure 103: South Asia & Pacific Market Attractiveness Analysis by Sales Channel
  • Figure 104: Middle East and Africa Market Value Share and BPS Analysis by Country, 2025 and 2035
  • Figure 105: Middle East and Africa Market Value Share and BPS Analysis by Product Type, 2025 and 2035
  • Figure 106: Middle East and Africa Market Y-o-Y Growth Comparison by Product Type, 2025 to 2035
  • Figure 107: Middle East and Africa Market Attractiveness Analysis by Product Type
  • Figure 108: Middle East and Africa Market Value Share and BPS Analysis by Application, 2025 and 2035
  • Figure 109: Middle East and Africa Market Y-o-Y Growth Comparison by Application, 2025 to 2035
  • Figure 110: Middle East and Africa Market Attractiveness Analysis by Application
  • Figure 111: Middle East and Africa Market Value Share and BPS Analysis by End Use, 2025 and 2035
  • Figure 112: Middle East and Africa Market Y-o-Y Growth Comparison by End Use, 2025 to 2035
  • Figure 113: Middle East and Africa Market Attractiveness Analysis by End Use
  • Figure 114: Middle East and Africa Market Value Share and BPS Analysis by Sales Channel, 2025 and 2035
  • Figure 115: Middle East and Africa Market Y-o-Y Growth Comparison by Sales Channel, 2025 to 2035
  • Figure 116: Middle East and Africa Market Attractiveness Analysis by Sales Channel
  • Figure 117: Global Market - Tier Structure Analysis
  • Figure 118: Global Market - Company Share Analysis
Dashboard
Dashboard
Dashboard
Dashboard
Dashboard
Dashboard

Our Research Products

Full Research Suite

The "Full Research Suite" delivers actionable market intel, deep dives on markets or technologies, so clients act faster, cut risk, and unlock growth.

Competitor Leaderboard Report

The Leaderboard benchmarks and ranks top vendors, classifying them as Established Leaders, Leading Challengers, or Disruptors & Challengers.

Future Leaders Index

Locates where complements amplify value and substitutes erode it, forecasting net impact by horizon

Market Data & Forecasts

We deliver granular, decision-grade intel: market sizing, 5-year forecasts, pricing, adoption, usage, revenue, and operational KPIs—plus competitor tracking, regulation, and value chains—across 60 countries broadly.

Market Focus Report

Spot the shifts before they hit your P&L. We track inflection points, adoption curves, pricing moves, and ecosystem plays to show where demand is heading, why it is changing, and what to do next across high-growth markets and disruptive tech

Survey Report

Real-time reads of user behavior. We track shifting priorities, perceptions of today’s and next-gen services, and provider experience, then pace how fast tech moves from trial to adoption, blending buyer, consumer, and channel inputs with social signals (#WhySwitch, #UX).

Bespoke Reports

Partner with our analyst team to build a custom report designed around your business priorities. From analysing market trends to assessing competitors or crafting bespoke datasets, we tailor insights to your needs.

Supplier Intelligence

Discovery & Profiling

Capacity & Footprint

Performance & Risk

Compliance & Governance

Commercial Readiness

Who Supplies Whom

Scorecards & Shortlists

Playbooks & Docs

Category Intelligence

Definition & Scope

Demand & Use Cases

Cost Drivers

Market Structure

Supply Chain Map

Trade & Policy

Operating Norms

Deliverables

Buyer Intelligence

Account Basics

Spend & Scope

Procurement Model

Vendor Requirements

Terms & Policies

Entry Strategy

Pain Points & Triggers

Outputs

Pricing Analysis

Benchmarks

Trends

Should-Cost

Indexation

Landed Cost

Commercial Terms

Deliverables

Brand Analysis

Positioning & Value Prop

Share & Presence

Customer Evidence

Go-to-Market

Digital & Reputation

Compliance & Trust

KPIs & Gaps

Outputs

Full Research Suite comprises of:

Market outlook & trends analysis

Market outlook & trends analysis

Interviews & case studies

Interviews & case studies

Strategic recommendations

Strategic recommendations

Vendor profiles & capabilities analysis

Vendor profiles & capabilities analysis

5-year forecasts

5-year forecasts

8 regions and 60+ country-level data splits

8 regions and 60+ country-level data splits

Market segment data splits

Market segment data splits

12 months of continuous data updates

12 months of continuous data updates

DELIVERED AS:

PDF EXCEL ONLINE

Full Research Suite


$5000

$7500

$10000

Buy Report Now
Similar Industry Reports

Similar Industry Reports

Cable Cleaning Equipment Market

Cable Cleaning Equipment Market Analysis - Size, Share, and Forecast Outlook 2025 to 2035

Cleaning Robot Market

Cleaning Robot Market Size and Share Forecast Outlook 2025 to 2035

Cable Line Fault Indicator Market

Cable Line Fault Indicator Market Size and Share Forecast Outlook 2025 to 2035

Cable Tray Market
Cable Tray Market

Cable Tray Market Size and Share Forecast Outlook 2025 to 2035

Cable Granulator Market

Cable Granulator Market Size and Share Forecast Outlook 2025 to 2035

Cable Distribution Cabinets Market

Cable Distribution Cabinets Market Size and Share Forecast Outlook 2025 to 2035

Cable Accessories Market

Cable Accessories Market Growth - Trends & Forecast 2025 to 2035

Cable Material Market

Cable Material Market Growth - Trends & Forecast 2025 to 2035

Cleaning In Place Market

Cleaning In Place Market Growth - Trends & Forecast 2025 to 2035

Cable Fault Locator Market

Cable Fault Locator Market Size, Share, and Forecast 2025 to 2035

Cable Connectors and Adapters Market

Cable Connectors and Adapters Market Analysis by Application, Product, Type and Region: Forecast from 2025 to 2035

Cable Cars and Ropeways Market

Cable Cars and Ropeways Market Growth - Trends & Forecast 2025 to 2035

Cleaning and Hygiene Product Market

Cleaning and Hygiene Product Market Report – Demand & Trends 2024-2034

Cable Wrapping Tape Market

Cable Wrapping Tape Market

Cable Racks Market
Cable Racks Market

Cable Racks Market

Cable Testing Market

Cable Testing Market

Cable Assemblies Market

Cable Assemblies Market

Cable Carrier Market

Cable Carrier Market

Cable Detector Market

Cable Detector Market

Cable Flange Market
Cable Flange Market

Cable Flange Market

Future Market Insights

Cable Cleaning Solutions Market

Chat With MaRIA

Chat With

MaRIA

Hi There, I am MaRIA, Your Market Research Intelligence Assistant. How may I help you?