Cable Trays Market
Cable Trays Market by Material, Product Type, End-user & Region | Forecast 2022 to 2032
Market Insights on Cable Trays covering sales outlook, demand forecast and up-to-date key trends
Cable Trays Market Outlook (2022 to 2032)
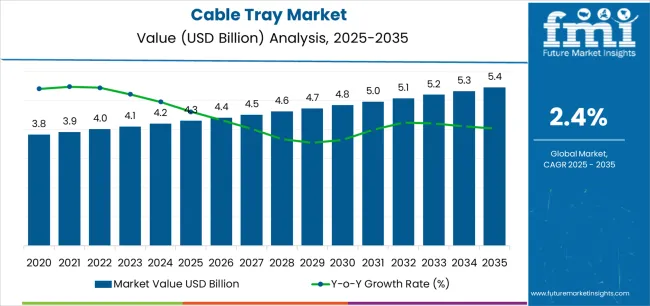
The global cable trays market is set to enjoy a valuation of US$ 4.7 Billion in 2022, and further expand at a CAGR of 4.4% to reach US$ 7.2 Billion by the year 2032. The sales of the cable trays are estimated to fuel the top 3 countries projected to hold approximately 30-35% of the market by the end of 2022.
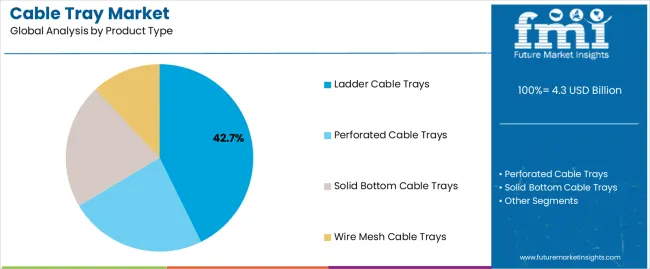
In the cable trays market, the perforated cable trays segment by product type is estimated to hold the major portion of the global cable trays due to its excellent support feature. The same segment is anticipated to hold around 45% of the market value share by the end of 2032.
Market Size 2022 |
US$ 4.7 Billion |
Market Size 2032 |
US$ 7.2 Billion |
Value CAGR (2022 to 2032) |
4.4% |
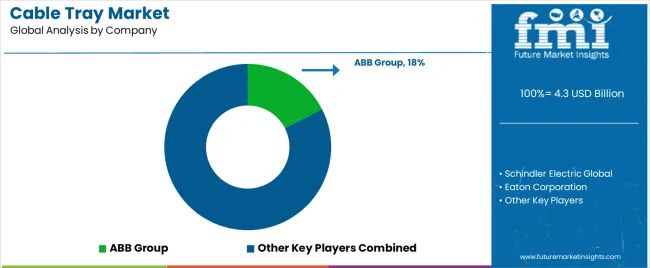
Collective Value Share: Top 5 Companies (2022E) |
15-20% |
According to the FMI analysis, the cable trays market revenue reached US$ 4.5 Billion in 2021. The global 1.5 market is anticipated to reach US$ 7.2 Billion by the end of 2032, accelerating at a CAGR of 4.4% during the forecast period. The demand for metal cable trays is projected to boost with the top 5 key players holding 15-20% of the global cable trays market by the end of 2022.
The cable trays market is estimated to experience a positive growth outlook with the increasing need for cable bundling solutions. A new forecast by FMI analysis anticipates that cable trays sales will propel during 2022 to 2032 and is projected to create an absolute incremental opportunity of US$ 2.7 Billion.
The surge in demand for cable management in various end-use industries is anticipated to augment the sales of cable trays. The strapping devices market is projected to grow 1.6x the current market value during the forecast period.
Don't pay for what you don't need
Customize your report by selecting specific countries or regions and save 30%!
Historic Market Outlook for Cable Trays Market’s
The global cable trays market witnessed a growth rate of 3.7% from 2015 to 2021 and reached US$ 4.5 Billion in 2021 from US$ 3.6 Billion in 2012.
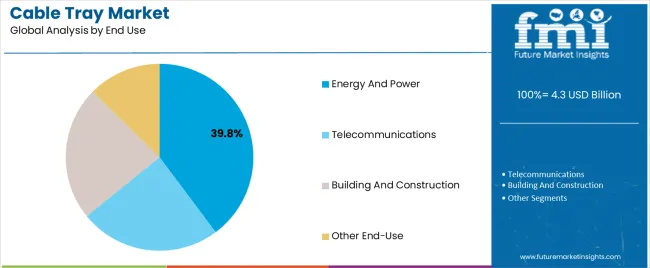
The cable trays are efficient cable management and cable bundling tools made from metal or plastic material. The cable trays are made available in different product types based on the end-user requirement such as ladder cable trays, perforated cable trays, solid bottom cable trays, and wire mesh cable trays. The cable trays are used by various end-user such as telecommunication, energy and power, building and construction, and others. The surge in demand for proper wire bundling solutions augments the sales of cable trays across the globe. The stringent laws and policies to ensure the safety of employees at the workplace add to the growth of the cable trays market. The cable trays offer more support to the cables than the traditional method. The cable trays are capable of supporting various types of cables which gains traction among the end-user.
The expanding telecommunication industry is projected to supplement the sales of the cable trays market. Also, the innovation by the key players attracts more end-users which creates a growth opportunity for the market. Overall, the global cable trays market is anticipated to grow at a rapid pace during the foreseeable period.
How does the Developing Industrial Infrastructure Fuel the Demand for Cable Trays?
The rise in the number of set-ups in various end-use industries such as energy and power, building & construction, and others fuel the demand for wire management systems including cable trays. The development of infrastructure results in increased demand for cable trays to provide proper cable management systems as well as to ensure safety.
The surge in the need for suitable and safe cable bundling solution for various end-user boost the demand for cable trays. Moreover, the increasing expenditure on the construction of new facilities augments the sales of cable trays. The industrial establishment with refurbishing and upgradation activities in old structures to meet the energy efficiency objectives is anticipated to drive the demand for cable trays.
Category-wise Insights
Which Material Holds the Major Portion of the Global Cable Trays Market?
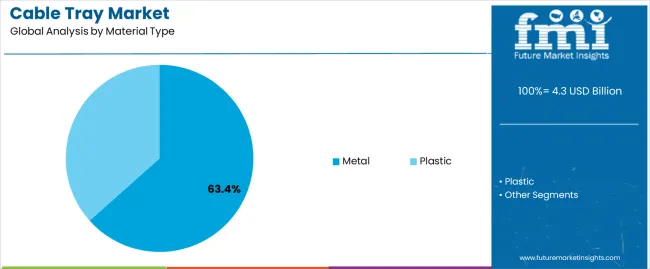
By material, the metal cable trays segment holds the major portion of the global cable trays market. The metal cable trays market segment is projected to expand 1.5x the current market value. The benefits offered by metal cable trays gain traction among the end-users such as low maintenance, highly durable, supreme quality, and others.
Which End-user Segment Generates Sturdy Demand for the Cable Trays?
The telecommunication segment is projected to generate hefty demand for cable trays during the forecast period. The telecommunication segment is projected to generate a growth opportunity of US$ 1.2 Billion from 2022 to 2032. The increasing demand for cable management solutions in the telecommunication sector directly affects the sales of cable trays.
The above image represents the market share analysis for the material segment with respect to various regions across the globe. It is projected that the metal segment holds a prominent share in various regions due to its benefits.
United States of America Cable Trays Market Flourishing by Rising Power Distribution
North America is likely to hold 81% of the share in the cable trays market during the forecast period. The USA cable trays market is leading the maximum share in the region due to rising power distribution in the country during the forecast period. The workplace safety law in the USA is the major factor propelling the demand for cable trays.
The general requirement regarding the employee safety and usage of cable trays in the USA is provided under the title 'Occupational Safety and Health Standards' by the United States Department of Labor. In September 2022, ABB Group announced the expansion of its production capacity for cable trays in North America by investing US$ 13 Million in its Installation Products Division Iberville manufacturing facility in Quebec. This is likely to increase the cable trays market trends during the forecast period.
Get the data you need at a Fraction of the cost
Personalize your report by choosing insights you need
and save 40%!
United Kingdom Cable Trays Market Accelerate Due to Rising Demand for Electric Cable
Europe is securing a relevant share in the global cable trays market during the forecast period. The rising construction sector is likely to increase the demand for cable trays electrical in the UK market in recent years. Moreover, the development of infrastructure and rising demand for suitable cable trays for suitable and safe solutions are growing the UK cable trays market share during the forecast period. In addition, several end-use industries such as power and energy, construction, and building are flourishing the market size in the UK in recent years.
Asia Pacific Cable Trays Market is Surging by Growing Telecommunication Sector
The Asia Pacific region is one of the fastest-growing regions in the cable trays market during the forecast period. With the rising of the telecommunication sector, the Asia Pacific cable trays market share is likely to capture a significant share during the forecast period.
Korean cable trays market is one of the leading markets in the region that contribute a relevant share of the market. Growing several end-use industries, such as construction and telecommunication, among others, are likely to uplift the Korean cable trays market size during the forecast period. However, the rising of cable trays manufacturers, the growing industrial sector, and upgrading old structure activities are flourishing the cable trays' market share during the forecast period. Moreover, the increasing expenditure on the construction of new facilities increases the sales of cable trays in Korea.
Heightened Budget Allocation in Europe for Passive Optical Networks to Propel the Regional Market Development
The Europe passive optical network (PON) market is rising due to the heightened budget allocated by the European Union (E.U.) to extend the coverage of passive optical networks in the region. The current requirements for access networks are not limited to transferring data streams from/to the internet. The popularity of Netflix, Amazon T.V., and other OTT platforms has increased the demand for bandwidth. Additionally, the advent of interactive gaming and video-on-demand has surged the deployment of broadband infrastructures. The passive optical network (PON), owing to its large bandwidth, is currently being perceived as the proper technology to enable this. PON technology is being adopted extensively and employed in various areas across the globe, thus enhancing the passive optical network market size in Europe.
In 2022, Europe held a revenue share of 23.2%, making it a potential market share for passive optical technology. Governmental support and involvement as a financial partner contribute to the expansion of the global market. Global market share increases due to the development of strong ecosystems of industry players, goods, and services, as well as interesting knowledge of PON advantages in this area.
In May 2021, Proximus, a leading Belgian operator, partnered with Nokia, a comms tech provider, to launch the first-ever PON live network, which connects the Havenhuis building in Antwerp and Proximus central office. The new deployment is in line with the inspiring 2022 vision of Proximus to boost its position as the leading fixed broadband network provider in Belgium.
The United States Passive Optical Network Market Outlook
With a revenue share of 34.5%, the USA is rapidly catching up to become the market leader for passive optical networks. The region's expanding need for higher bandwidth applications fuels the market's expansion. The demand for passive optical networks is being further supported by growing awareness of environmentally friendly network solutions. The growth of fiber city initiatives in this area fuels the demand for passive optical networks. The need for effective bandwidth from an increasing number of social media influencers further suggests that the worldwide industry is likely to expand.
Further, the USA passive optical network market is expected to be driven by the leading advancements of optical network services by the key players present in the country. In addition to this, federal I.T. managers have begun gravitating towards a passive optical network (PON) as an effective substitute for copper-based Ethernet, thus boosting the demand for PON services. The market is further being propelled by strong optical network setups and growing demand for energy conservation. Additionally, factors such as USA telecom deployment plans, the increasing number of cable operators, and Google Fibre's expansion are also predicted to bolster the passive optical network market demand over the forecast period.
The various passive optical network disadvantages, such as difficulty detecting a failure, data transfer rate slow down due to increased distance between splitters and end-users, and bandwidth issues with individual users, may hinder the market growth in the coming years.
Growing Demand for Future-Centric Services to Boost the Demand for Passive Optical Network in Japan
The Japan passive optical network (PON) market size is anticipated to witness healthy growth over the forecast period owing to rising government initiatives in the region. The demand for a passive optical network (PON) is further expected to strengthen over the stipulated time period owing to robustly rising online traffic and extensive futuristic services, such as 5G and beyond mobile communication applications and services, such as high-definition video, Internet of things, artificial intelligence, and big-data analysis.
Further, the flexibility and capability afforded by passive optical network (PON) technology to carry higher bandwidths is predicted to enhance the market growth of passive optical networks (PON) in the coming years. The development of a passive optical network (PON) for a high split ratio, 50G and 100G data rate, and extended reach is also anticipated to maneuver the market growth.
- In October 2022, DZS unveiled the launch of the DZS Saber-4400 modular, compact, and coherent edge transport and optical metro platform designed for cost-effective and convenient delivery of fiber-based services.
South Korea is Witnessing Rising Demand to Upgrade Pre-Existing Networks to Passive Optical Network
The South Korean passive optical network (PON) market is expected to flourish over the predicted time frame due to the commercialization of WDM-PON aimed at providing 100 Mbits to each home for future video-centric services. Additionally, the ongoing research and development to enhance the PON services are also predicted to invigorate the passive optical network (PON) market in the region.
The demand for PON is further being propelled by the growing requirement to upgrade pre-existing networks to PON/ passive optical networks for greater broadband width and the rising number of connected devices both in and out of residential homes, thus supporting the South Korean passive optical network (PON) market growth.
Country-wise insights
How does the USA Increase the Demand for Cable Trays?
The USA is estimated to remain the lucrative segment of the North American cable trays market. The same is projected to hold around 81% of the market value share of the North American cable trays market by the end of 2032. The workplace safety law in the USA is the major factor propelling the demand for cable trays. The general requirement regarding the employee safety and usage of cable trays in the USA is provided under the title ‘ Occupational Safety and Health Standards’ by the United States Department of Labor.
How does India Create a Growth Opportunity for Cable Trays Market?
India’s cable trays market is projected to grow 1.7 times the current market value during the forecast period. The reason behind the same is the growing telecommunication sector in India which propel the demand for cable trays. According to the Ministry of Commerce and Industry, India is considered to be the second-largest market for telecommunication. The teledensity in India stood around 85% as of April 2022. Also, the development and investment in the Indian telecommunication sector create a growth opportunity for the cable trays market.
Competitive Landscape
The key players operating in the global cable trays market are trying to expand their production capacity and resources to meet the growing demand for cable management solutions through acquisitions and investment. Some of the latest key developments by the key players are as follows-
- In September 2022, ABB Group announced the expansion of its production capacity for cable trays in North America by investing US$ 13 Million in its Installation Products Division Iberville manufacturing facility in Quebec.
- In May 2022, Atkore Inc. announced the acquisition of Talon Products, LLC, a company engaged in providing moulded cable cleats which will help the company to provide a robust solution for cable management needs.
Scope of the Report
Attribute |
Details |
Growth Rate |
CAGR of 4.4% from 2022 to 2032 |
Base Year for Estimation |
2021 |
Historical Data |
2015 to 2020 |
Forecast Period |
2022 to 2032 |
Quantitative Units |
Revenue in USD Million, Volume in Units, and CAGR from 2022 to 2032 |
Report Coverage |
Revenue Forecast, Volume Forecast, Company Ranking, Competitive Landscape, Growth Factors, Trends, and Pricing Analysis |
Segments Covered |
|
Regions Covered |
|
Key Countries Covered |
|
Key Companies Profiled |
|
Cable Trays by Category
By Material, Cable Trays are Segmented as:
- Metal
- Plastic
By Product Type, Cable Trays Market is Segmented as:
- Ladder Cable Trays
- Perforated Cable Trays
- Solid Bottom Cable Trays
- Wire Mesh Cable Trays
By End-user, Cable Trays are Segmented as:
- Telecommunications
- Energy and Power
- Building and Construction
- Other End-user
By Region, Cable Trays Market is Segmented as:
- North America
- Latin America
- Europe
- South Asia
- East Asia
- Middle East & Africa
- Oceania
Frequently Asked Questions
What was the value of the cable trays market in 2021?
The global cable trays market reached US$ 4.5 Billion in 2021.
What was the historic growth rate for the global cable trays market?
The cable trays market expanded at a CAGR of 3.7% during 2015 to 2021.
What will the value of the global cable trays market by the end of 2032?
By 2032, the global cable trays market is projected to reach US$ 7.2 Billion.
At what rate is the global cable trays market anticipated to grow?
During 2022 to 2032, the global cable trays market is anticipated to register a CAGR of 4.4%.
What is the future growth outlook for the global cable trays market?
The cable trays market is estimated to grow 1.6 times the current market value during the forecast period.
Which material segment is expected to lead the global cable trays market during the forecast period?
The metal segment by the material is expected to lead the global cable trays market during the forecast period.
What drives the demand for the cable trays?
The increasing demand for proper and flexible cable bundling solution boost the demand for cable trays.
Who are the key players operating in the global cable trays market?
ABB Group, Schindler Electric Global, Eaton Corporation, Hubbell Incorporated, MP Husky USA, and Atkore Inc. are the key players operating in the global cable trays market.
At what rate is the China cable trays market projected to grow?
As per the FMI analysis, the China cable trays market is projected to expand at a CAGR of 5.2% during 2022 to 2032.
Table of Content
1. Executive Summary | Cable Trays Market 1.1. Global Market Outlook 1.2. Demand-side Trends 1.3. Supply-side Trends 1.4. Technology Roadmap Analysis 1.5. Analysis and Recommendations 2. Market Overview 2.1. Market Coverage / Taxonomy 2.2. Market Definition / Scope / Limitations 3. Market Background 3.1. Market Dynamics 3.1.1. Drivers 3.1.2. Restraints 3.1.3. Opportunity 3.1.4. Trends 3.2. Impact of Covid-19 3.2.1. Demand in Optimistic Scenario 3.2.2. Demand in Likely Scenario 3.2.3. Demand in Conservative Scenario 3.3. Macro Factors and Forecast Factors 3.4. Value Chain Analysis 3.4.1. Profit Margin Analysis 3.4.2. Raw Material Suppliers 3.4.3. Manufacturers, Wholesalers, and Distributors 3.4.4. End-users / Customers 3.5. Regional Parent Market Outlook 3.6. Production and Consumption Statistics 3.7. Global Average Pricing Analysis Benchmark 4. Global Cable Market Analysis 2015 to 2021 and Forecast, 2022 to 2032 4.1. Historical Market Size Value (US$ Million) & Volume (Units) Analysis, 2015 to 2021 4.2. Current and Future Market Size Value (US$ Million) & Volume (Units) Projections, 2022 to 2032 4.2.1. Y-o-Y Growth Trend Analysis 4.2.2. Absolute $ Opportunity Analysis 5. Global Market Analysis 2015 to 2021 and Forecast 2015 to 2021, By Material 5.1. Introduction / Key Findings 5.2. Historical Market Size Value (US$ Million) & Volume (Units) Analysis By Material, 2015 to 2021 5.3. Current and Future Market Size Value (US$ Million) & Volume (Units) Analysis and Forecast By Material, 2022 to 2032 5.3.1. Metal 5.3.2. Plastic 5.4. Y-o-Y Growth Trend Analysis By Material, 2015 to 2021 5.5. Absolute $ Opportunity Analysis By Material, 2022 to 2032 6. Global Market Analysis 2015 to 2021 and Forecast 2015 to 2021, By Product Type 6.1. Introduction / Key Findings 6.2. Historical Market Size Value (US$ Million) & Volume (Units) Analysis By Product Type, 2015 to 2021 6.3. Current and Future Market Size Value (US$ Million) & Volume (Units) Analysis and Forecast By Product Type, 2022 to 2032 6.3.1. Ladder Cable Trays 6.3.2. Perforated Cable Trays 6.3.3. Solid Bottom Cable Trays 6.3.4. Wire Mesh Cable Trays 6.4. Y-o-Y Growth Trend Analysis By Product Type, 2015 to 2021 6.5. Absolute $ Opportunity Analysis By Product Type, 2022 to 2032 7. Global Market Analysis 2015 to 2021 and Forecast 2015 to 2021, By End-user 7.1. Introduction / Key Findings 7.2. Historical Market Size Value (US$ Million) & Volume (Units) Analysis By End-user, 2015 to 2021 7.3. Current and Future Market Size Value (US$ Million) & Volume (Units) Analysis and Forecast By End-user, 2022 to 2032 7.3.1. Telecommunications 7.3.2. Energy and Power 7.3.3. Building and Construction 7.3.4. Other End-users 7.4. Y-o-Y Growth Trend Analysis By End-user, 2015 to 2021 7.5. Absolute $ Opportunity Analysis By End-user, 2022 to 2032 8. Global Market Analysis 2015 to 2021 and Forecast 2015 to 2021, by Region 8.1. Introduction / Key Findings 8.2. Historical Market Size Value (US$ Million) & Volume (Units) Analysis By Region, 2015 to 2021 8.3. Current and Future Market Size Value (US$ Million) & Volume (Units) Analysis and Forecast By Region, 2022 to 2032 8.3.1. North America 8.3.2. Latin America 8.3.3. Europe 8.3.4. East Asia 8.3.5. South Asia 8.3.6. Oceania 8.3.7. Middle East and Africa 8.4. Market Attractiveness Analysis, by Region 9. North America Market Analysis 2015 to 2021 and Forecast 2015 to 2021, By Country 9.1. Historical Market Size Value (US$ Million) & Volume (Units) Trend Analysis By Market Taxonomy, 2015 to 2021 9.2. Market Size Value (US$ Million) & Volume (Units) Forecast By Market Taxonomy, 2022 to 2032 9.2.1. By Country 9.2.1.1. United States of America 9.2.1.2. Canada 9.2.2. By Material 9.2.3. By Product Type 9.2.4. By End-user 9.3. Market Attractiveness Analysis 9.3.1. By Country 9.3.2. By Material 9.3.3. By Product Type 9.3.4. By End-user 9.4. Key Takeaways 10. Latin America Market Analysis 2015 to 2021 and Forecast 2015 to 2021, By Country 10.1. Historical Market Size Value (US$ Million) & Volume (Units) Trend Analysis By Market Taxonomy, 2015 to 2021 10.2. Market Size Value (US$ Million) & Volume (Units) Forecast By Market Taxonomy, 2022 to 2032 10.2.1. By Country 10.2.1.1. Brazil 10.2.1.2. Mexico 10.2.1.3. Argentina 10.2.1.4. Chile 10.2.1.5. Peru 10.2.1.6. Rest of Latin America 10.2.2. By Material 10.2.3. By Product Type 10.2.4. By End-user 10.3. Market Attractiveness Analysis 10.3.1. By Country 10.3.2. By Material 10.3.3. By Product Type 10.3.4. By End-user 10.4. Key Takeaways 11. Europe Market Analysis 2015 to 2021 and Forecast 2015 to 2021, By Country 11.1. Historical Market Size Value (US$ Million) & Volume (Units) Trend Analysis By Market Taxonomy, 2015 to 2021 11.2. Market Size Value (US$ Million) & Volume (Units) Forecast By Market Taxonomy, 2022 to 2032 11.2.1. By Country 11.2.1.1. Germany 11.2.1.2. Italy 11.2.1.3. France 11.2.1.4. United Kingdom 11.2.1.5. Spain 11.2.1.6. BENELUX 11.2.1.7. Nordic 11.2.1.8. Russia 11.2.1.9. Poland 11.2.1.10. Rest of Europe 11.2.2. By Material 11.2.3. By Product Type 11.2.4. By End-user 11.3. Market Attractiveness Analysis 11.3.1. By Country 11.3.2. By Material 11.3.3. By Product Type 11.3.4. By End-user 11.4. Key Takeaways 12. East Asia Market Analysis 2015 to 2021 and Forecast 2015 to 2021, By Country 12.1. Historical Market Size Value (US$ Million) & Volume (Units) Trend Analysis By Market Taxonomy, 2015 to 2021 12.2. Market Size Value (US$ Million) & Volume (Units) Forecast By Market Taxonomy, 2022 to 2032 12.2.1. By Country 12.2.1.1. China 12.2.1.2. Japan 12.2.1.3. South Korea 12.2.2. By Material 12.2.3. By Product Type 12.2.4. By End-user 12.3. Market Attractiveness Analysis 12.3.1. By Country 12.3.2. By Material 12.3.3. By Product Type 12.3.4. By End-user 12.4. Key Takeaways 13. South Asia Market Analysis 2015 to 2021 and Forecast 2015 to 2021, By Country 13.1. Historical Market Size Value (US$ Million) & Volume (Units) Trend Analysis By Market Taxonomy, 2015 to 2021 13.2. Market Size Value (US$ Million) & Volume (Units) Forecast By Market Taxonomy, 2022 to 2032 13.2.1. By Country 13.2.1.1. India 13.2.1.2. Thailand 13.2.1.3. Malaysia 13.2.1.4. Indonesia 13.2.1.5. Rest of South Asia 13.2.2. By Material 13.2.3. By Product Type 13.2.4. By End-user 13.3. Market Attractiveness Analysis 13.3.1. By Country 13.3.2. By Material 13.3.3. By Product Type 13.3.4. By End-user 13.4. Key Takeaways 14. Oceania Market Analysis 2015 to 2021 and Forecast 2015 to 2021, By Country 14.1. Historical Market Size Value (US$ Million) & Volume (Units) Trend Analysis By Market Taxonomy, 2015 to 2021 14.2. Market Size Value (US$ Million) & Volume (Units) Forecast By Market Taxonomy, 2022 to 2032 14.2.1. By Country 14.2.1.1. Australia 14.2.1.2. New Zealand 14.2.2. By Material 14.2.3. By Product Type 14.2.4. By End-user 14.3. Market Attractiveness Analysis 14.3.1. By Country 14.3.2. By Material 14.3.3. By Product Type 14.3.4. By End-user 14.4. Key Takeaways 15. Middle East & Africa Market Analysis 2015 to 2021 and Forecast 2015 to 2021, By Country 15.1. Historical Market Size Value (US$ Million) & Volume (Units) Trend Analysis By Market Taxonomy, 2015 to 2021 15.2. Market Size Value (US$ Million) & Volume (Units) Forecast By Market Taxonomy, 2022 to 2032 15.2.1. By Country 15.2.1.1. GCC Countries 15.2.1.2. Turkey 15.2.1.3. Northern Africa 15.2.1.4. South Africa 15.2.1.5. Rest of Middle East and Africa 15.2.2. By Material 15.2.3. By Product Type 15.2.4. By End-user 15.3. Market Attractiveness Analysis 15.3.1. By Country 15.3.2. By Material 15.3.3. By Product Type 15.3.4. By End-user 15.4. Key Takeaways 16. Country-wise Market Analysis 16.1. United States of America 16.1.1. Market Share Analysis, 2022 16.1.2. By Material 16.1.3. By Product Type 16.1.4. By End-user 16.2. Canada 16.2.1. Market Share Analysis, 2022 16.2.2. By Material 16.2.3. By Product Type 16.2.4. By End-user 16.3. Brazil 16.3.1. Market Share Analysis, 2022 16.3.2. By Material 16.3.3. By Product Type 16.3.4. By End-user 16.4. Mexico 16.4.1. Market Share Analysis, 2022 16.4.2. By Material 16.4.3. By Product Type 16.4.4. By End-user 16.5. Germany 16.5.1. Market Share Analysis, 2022 16.5.2. By Material 16.5.3. By Product Type 16.5.4. By End-user 16.6. Italy 16.6.1. Market Share Analysis, 2022 16.6.2. By Material 16.6.3. By Product Type 16.6.4. By End-user 16.7. France 16.7.1. Market Share Analysis, 2022 16.7.2. By Material 16.7.3. By Product Type 16.7.4. By End-user 16.8. Spain 16.8.1. Market Share Analysis, 2022 16.8.2. By Material 16.8.3. By Product Type 16.8.4. By End-user 16.9. United Kingdom 16.9.1. Market Share Analysis, 2022 16.9.2. By Material 16.9.3. By Product Type 16.9.4. By End-user 16.10. Russia 16.10.1. Market Share Analysis, 2022 16.10.2. By Material 16.10.3. By Product Type 16.10.4. By End-user 16.11. China 16.11.1. Market Share Analysis, 2022 16.11.2. By Material 16.11.3. By Product Type 16.11.4. By End-user 16.12. Japan 16.12.1. Market Share Analysis, 2022 16.12.2. By Material 16.12.3. By Product Type 16.12.4. By End-user 16.13. India 16.13.1. Market Share Analysis, 2022 16.13.2. By Material 16.13.3. By Product Type 16.13.4. By End-user 16.14. GCC Countries 16.14.1. Market Share Analysis, 2022 16.14.2. By Material 16.14.3. By Product Type 16.14.4. By End-user 16.15. Australia 16.15.1. Market Share Analysis, 2022 16.15.2. By Material 16.15.3. By Product Type 16.15.4. By End-user 17. Market Structure Analysis 17.1. Competition Dashboard 17.2. Competition Benchmarking 17.3. Market Share Analysis of Top Players 17.3.1. By Region 17.3.2. By Product Portfolio 18. Competition Analysis 18.1. Competition Deep Dive 18.1.1. ABB Group 18.1.1.1. Overview 18.1.1.2. Product Portfolio 18.1.1.3. Profitability by Market Segments (Product/Channel/Region) 18.1.1.4. Sales Footprint 18.1.1.5. Strategy Overview 18.1.1.5.1. Marketing Strategy 18.1.1.5.2. Product Strategy 18.1.1.5.3. Channel Strategy 18.1.2. Schindler Electric Global 18.1.2.1. Overview 18.1.2.2. Product Portfolio 18.1.2.3. Profitability by Market Segments (Product/Channel/Region) 18.1.2.4. Sales Footprint 18.1.2.5. Strategy Overview 18.1.2.5.1. Marketing Strategy 18.1.2.5.2. Product Strategy 18.1.2.5.3. Channel Strategy 18.1.3. Eaton Corporation 18.1.3.1. Overview 18.1.3.2. Product Portfolio 18.1.3.3. Profitability by Market Segments (Product/Channel/Region) 18.1.3.4. Sales Footprint 18.1.3.5. Strategy Overview 18.1.3.5.1. Marketing Strategy 18.1.3.5.2. Product Strategy 18.1.3.5.3. Channel Strategy 18.1.4. Hubbell Incorporated 18.1.4.1. Overview 18.1.4.2. Product Portfolio 18.1.4.3. Profitability by Market Segments (Product/Channel/Region) 18.1.4.4. Sales Footprint 18.1.4.5. Strategy Overview 18.1.4.5.1. Marketing Strategy 18.1.4.5.2. Product Strategy 18.1.4.5.3. Channel Strategy 18.1.5. MP Husky USA 18.1.5.1. Overview 18.1.5.2. Product Portfolio 18.1.5.3. Profitability by Market Segments (Product/Channel/Region) 18.1.5.4. Sales Footprint 18.1.5.5. Strategy Overview 18.1.5.5.1. Marketing Strategy 18.1.5.5.2. Product Strategy 18.1.5.5.3. Channel Strategy 18.1.6. Atkore Inc. 18.1.6.1. Overview 18.1.6.2. Product Portfolio 18.1.6.3. Profitability by Market Segments (Product/Channel/Region) 18.1.6.4. Sales Footprint 18.1.6.5. Strategy Overview 18.1.6.5.1. Marketing Strategy 18.1.6.5.2. Product Strategy 18.1.6.5.3. Channel Strategy 18.1.7. Chalfont Manufacturing Company 18.1.7.1. Overview 18.1.7.2. Product Portfolio 18.1.7.3. Profitability by Market Segments (Product/Channel/Region) 18.1.7.4. Sales Footprint 18.1.7.5. Strategy Overview 18.1.7.5.1. Marketing Strategy 18.1.7.5.2. Product Strategy 18.1.7.5.3. Channel Strategy 18.1.8. Basor Electric SA 18.1.8.1. Overview 18.1.8.2. Product Portfolio 18.1.8.3. Profitability by Market Segments (Product/Channel/Region) 18.1.8.4. Sales Footprint 18.1.8.5. Strategy Overview 18.1.8.5.1. Marketing Strategy 18.1.8.5.2. Product Strategy 18.1.8.5.3. Channel Strategy 18.1.9. Niedax Group 18.1.9.1. Overview 18.1.9.2. Product Portfolio 18.1.9.3. Profitability by Market Segments (Product/Channel/Region) 18.1.9.4. Sales Footprint 18.1.9.5. Strategy Overview 18.1.9.5.1. Marketing Strategy 18.1.9.5.2. Product Strategy 18.1.9.5.3. Channel Strategy 18.1.10. Snake Tray 18.1.10.1. Overview 18.1.10.2. Product Portfolio 18.1.10.3. Profitability by Market Segments (Product/Channel/Region) 18.1.10.4. Sales Footprint 18.1.10.5. Strategy Overview 18.1.10.5.1. Marketing Strategy 18.1.10.5.2. Product Strategy 18.1.10.5.3. Channel Strategy 18.1.11. Wiremaid Products Corp. 18.1.11.1. Overview 18.1.11.2. Product Portfolio 18.1.11.3. Profitability by Market Segments (Product/Channel/Region) 18.1.11.4. Sales Footprint 18.1.11.5. Strategy Overview 18.1.11.5.1. Marketing Strategy 18.1.11.5.2. Product Strategy 18.1.11.5.3. Channel Strategy 18.1.12. Panduit Corporation 18.1.12.1. Overview 18.1.12.2. Product Portfolio 18.1.12.3. Profitability by Market Segments (Product/Channel/Region) 18.1.12.4. Sales Footprint 18.1.12.5. Strategy Overview 18.1.12.5.1. Marketing Strategy 18.1.12.5.2. Product Strategy 18.1.12.5.3. Channel Strategy 18.1.13. TechLine Mfg. 18.1.13.1. Overview 18.1.13.2. Product Portfolio 18.1.13.3. Profitability by Market Segments (Product/Channel/Region) 18.1.13.4. Sales Footprint 18.1.13.5. Strategy Overview 18.1.13.5.1. Marketing Strategy 18.1.13.5.2. Product Strategy 18.1.13.5.3. Channel Strategy 18.1.14. Chatsworth Products (CPI) 18.1.14.1. Overview 18.1.14.2. Product Portfolio 18.1.14.3. Profitability by Market Segments (Product/Channel/Region) 18.1.14.4. Sales Footprint 18.1.14.5. Strategy Overview 18.1.14.5.1. Marketing Strategy 18.1.14.5.2. Product Strategy 18.1.14.5.3. Channel Strategy 18.1.15. Lumens India 18.1.15.1. Overview 18.1.15.2. Product Portfolio 18.1.15.3. Profitability by Market Segments (Product/Channel/Region) 18.1.15.4. Sales Footprint 18.1.15.5. Strategy Overview 18.1.15.5.1. Marketing Strategy 18.1.15.5.2. Product Strategy 18.1.15.5.3. Channel Strategy 19. Assumptions and Acronyms Used 20. Research Methodology
Don't pay for what you don't need
Customize your report by selecting specific countries or regions and save 30%!
List of Tables
Table 01: Global Market Value (US$ Million) Forecast by Region, 2015 to 2032 Table 02: Global Market Volume (Units) Forecast by Region, 2015 to 2032 Table 03: Global Market Value (US$ Million) Forecast by Material, 2015 to 2032 Table 04: Global Market Volume (Units) Forecast by Material, 2015 to 2032 Table 05: Global Market Value (US$ Million) Forecast by Product Type, 2015 to 2032 Table 06: Global Market Volume (Units) Forecast by Product Type, 2015 to 2032 Table 07: Global Market Value (US$ Million) Forecast by End-user, 2015 to 2032 Table 08: Global Market Volume (Units) Forecast by End-user, 2015 to 2032 Table 09: North America Market Value (US$ Million) Forecast by Country, 2015 to 2032 Table 10: North America Market Volume (Units) Forecast by Country, 2015 to 2032 Table 11: North America Market Value (US$ Million) Forecast by Material, 2015 to 2032 Table 12: North America Market Volume (Units) Forecast by Material, 2015 to 2032 Table 13: North America Market Value (US$ Million) Forecast by Product Type, 2015 to 2032 Table 14: North America Market Volume (Units) Forecast by Product Type, 2015 to 2032 Table 15: North America Market Value (US$ Million) Forecast by End-user, 2015 to 2032 Table 16: North America Market Volume (Units) Forecast by End-user, 2015 to 2032 Table 17: Latin America Market Value (US$ Million) Forecast by Country, 2015 to 2032 Table 18: Latin America Market Volume (Units) Forecast by Country, 2015 to 2032 Table 19: Latin America Market Value (US$ Million) Forecast by Material, 2015 to 2032 Table 20: Latin America Market Volume (Units) Forecast by Material, 2015 to 2032 Table 21: Latin America Market Value (US$ Million) Forecast by Product Type, 2015 to 2032 Table 22: Latin America Market Volume (Units) Forecast by Product Type, 2015 to 2032 Table 23: Latin America Market Value (US$ Million) Forecast by End-user, 2015 to 2032 Table 24: Latin America Market Volume (Units) Forecast by End-user, 2015 to 2032 Table 25: Europe Market Value (US$ Million) Forecast by Country, 2015 to 2032 Table 26: Europe Market Volume (Units) Forecast by Country, 2015 to 2032 Table 27: Europe Market Value (US$ Million) Forecast by Material, 2015 to 2032 Table 28: Europe Market Volume (Units) Forecast by Material, 2015 to 2032 Table 29: Europe Market Value (US$ Million) Forecast by Product Type, 2015 to 2032 Table 30: Europe Market Volume (Units) Forecast by Product Type, 2015 to 2032 Table 31: Europe Market Value (US$ Million) Forecast by End-user, 2015 to 2032 Table 32: Europe Market Volume (Units) Forecast by End-user, 2015 to 2032 Table 33: East Asia Market Value (US$ Million) Forecast by Country, 2015 to 2032 Table 34: East Asia Market Volume (Units) Forecast by Country, 2015 to 2032 Table 35: East Asia Market Value (US$ Million) Forecast by Material, 2015 to 2032 Table 36: East Asia Market Volume (Units) Forecast by Material, 2015 to 2032 Table 37: East Asia Market Value (US$ Million) Forecast by Product Type, 2015 to 2032 Table 38: East Asia Market Volume (Units) Forecast by Product Type, 2015 to 2032 Table 39: East Asia Market Value (US$ Million) Forecast by End-user, 2015 to 2032 Table 40: East Asia Market Volume (Units) Forecast by End-user, 2015 to 2032 Table 41: South Asia Market Value (US$ Million) Forecast by Country, 2015 to 2032 Table 42: South Asia Market Volume (Units) Forecast by Country, 2015 to 2032 Table 43: South Asia Market Value (US$ Million) Forecast by Material, 2015 to 2032 Table 44: South Asia Market Volume (Units) Forecast by Material, 2015 to 2032 Table 45: South Asia Market Value (US$ Million) Forecast by Product Type, 2015 to 2032 Table 46: South Asia Market Volume (Units) Forecast by Product Type, 2015 to 2032 Table 47: South Asia Market Value (US$ Million) Forecast by End-user, 2015 to 2032 Table 48: South Asia Market Volume (Units) Forecast by End-user, 2015 to 2032 Table 49: Oceania Market Value (US$ Million) Forecast by Country, 2015 to 2032 Table 50: Oceania Market Volume (Units) Forecast by Country, 2015 to 2032 Table 51: Oceania Market Value (US$ Million) Forecast by Material, 2015 to 2032 Table 52: Oceania Market Volume (Units) Forecast by Material, 2015 to 2032 Table 53: Oceania Market Value (US$ Million) Forecast by Product Type, 2015 to 2032 Table 54: Oceania Market Volume (Units) Forecast by Product Type, 2015 to 2032 Table 55: Oceania Market Value (US$ Million) Forecast by End-user, 2015 to 2032 Table 56: Oceania Market Volume (Units) Forecast by End-user, 2015 to 2032 Table 57: Middle East and Africa Market Value (US$ Million) Forecast by Country, 2015 to 2032 Table 58: Middle East and Africa Market Volume (Units) Forecast by Country, 2015 to 2032 Table 59: Middle East and Africa Market Value (US$ Million) Forecast by Material, 2015 to 2032 Table 60: Middle East and Africa Market Volume (Units) Forecast by Material, 2015 to 2032 Table 61: Middle East and Africa Market Value (US$ Million) Forecast by Product Type, 2015 to 2032 Table 62: Middle East and Africa Market Volume (Units) Forecast by Product Type, 2015 to 2032 Table 63: Middle East and Africa Market Value (US Million) Forecast by End-user, 2015 to 2032 Table 64: Middle East and Africa Market Volume (Units) Forecast by End-user, 2015 to 2032 Table 65: United States of America Market Value (US$ Million) Forecast by Material, Product Type, and End-user (2022(E) & 2032(F)) Table 66: Canada Market Value (US$ Million) Forecast by Material, Product Type, and End-user (2022(E) & 2032(F)) Table 67: Brazil Market Value (US$ Million) Forecast by Material, Product Type, and End-user (2022(E) & 2032(F)) Table 68: Mexico Market Value (US$ Million) Forecast by Material, Product Type, and End-user (2022(E) & 2032(F)) Table 69: Germany Market Value (US$ Million) Forecast by Material, Product Type, and End-user (2022(E) & 2032(F)) Table 70: Italy Market Value (US$ Million) Forecast by Material, Product Type, and End-user (2022(E) & 2032(F)) Table 71: France Market Value (US$ Million) Forecast by Material, Product Type, and End-user (2022(E) & 2032(F)) Table 72: Spain Market Value (US$ Million) Forecast by Material, Product Type, and End-user (2022(E) & 2032(F)) Table 73: United Kingdom Market Value (US$ Million) Forecast by Material, Product Type, and End-user (2022(E) & 2032(F)) Table 74: Russia Market Value (US$ Million) Forecast by Material, Product Type, and End-user (2022(E) & 2032(F)) Table 75: China Market Value (US$ Million) Forecast by Material, Product Type, and End-user (2022(E) & 2032(F)) Table 76: Japan Market Value (US$ Million) Forecast by Material, Product Type, and End-user (2022(E) & 2032(F)) Table 77: India Market Value (US$ Million) Forecast by Material, Product Type, and End-user (2022(E) & 2032(F)) Table 78: GCC Countries Market Value (US$ Million) Forecast by Material, Product Type, and End-user (2022(E) & 2032(F)) Table 79: Australia Market Value (US$ Million) Forecast by Material, Product Type, and End-user (2022(E) & 2032(F))
List of Charts
Figure 01: Global Market Value (US$ Million) by Material, 2022 to 2032 Figure 02: Global Market Value (US$ Million) by Product Type, 2022 to 2032 Figure 03: Global Market Value (US$ Million) by End-user, 2022 to 2032 Figure 04: Global Market Value (US$ Million) by Region, 2022 to 2032 Figure 05: Global Market Value (US$ Million) Analysis by Region, 2015 to 2021 Figure 06: Global Market Volume (Units) Analysis by Region, 2015 to 2032 Figure 07: Global Market Value Share (%) and BPS Analysis by Region, 2022 to 2032 Figure 08: Global Market Y-o-Y Growth (%) Projections by Region, 2022 to 2032 Figure 09: Global Market Value (US$ Million) Analysis by Material, 2015 to 2021 Figure 10: Global Market Volume (Units) Analysis by Material, 2015 to 2032 Figure 11: Global Market Value Share (%) and BPS Analysis by Material, 2022 to 2032 Figure 12: Global Market Y-o-Y Growth (%) Projections by Material, 2022 to 2032 Figure 13: Global Market Value (US$ Million) Analysis by Product Type, 2015 to 2021 Figure 14: Global Market Volume (Units) Analysis by Product Type, 2015 to 2032 Figure 15: Global Market Value Share (%) and BPS Analysis by Product Type, 2022 to 2032 Figure 16: Global Market Y-o-Y Growth (%) Projections by Product Type, 2022 to 2032 Figure 17: Global Market Value (US$ Million) Analysis by End-user, 2015 to 2021 Figure 18: Global Market Volume (Units) Analysis by End-user, 2015 to 2032 Figure 19: Global Market Value Share (%) and BPS Analysis by End-user, 2022 to 2032 Figure 20: Global Market Y-o-Y Growth (%) Projections by End-user, 2022 to 2032 Figure 21: Global Market Attractiveness by Material, 2022 to 2032 Figure 22: Global Market Attractiveness by Product Type, 2022 to 2032 Figure 23: Global Market Attractiveness by End-user, 2022 to 2032 Figure 24: Global Market Attractiveness by End-user, 2022 to 2032 Figure 25: Global Market Attractiveness by Region, 2022 to 2032 Figure 26: North America Market Value (US$ Million) by Material, 2022 to 2032 Figure 27: North America Market Value (US$ Million) by Product Type, 2022 to 2032 Figure 28: North America Market Value (US$ Million) by End-user, 2022 to 2032 Figure 29: North America Market Value (US$ Million) by Country, 2022 to 2032 Figure 30: North America Market Value (US$ Million) Analysis by Country, 2015 to 2021 Figure 31: North America Market Volume (Units) Analysis by Country, 2015 to 2032 Figure 32: North America Market Value Share (%) and BPS Analysis by Country, 2022 to 2032 Figure 33: North America Market Y-o-Y Growth (%) Projections by Country, 2022 to 2032 Figure 34: North America Market Value (US$ Million) Analysis by Material, 2015 to 2021 Figure 35: North America Market Volume (Units) Analysis by Material, 2015 to 2032 Figure 36: North America Market Value Share (%) and BPS Analysis by Material, 2022 to 2032 Figure 37: North America Market Y-o-Y Growth (%) Projections by Material, 2022 to 2032 Figure 38: North America Market Value (US$ Million) Analysis by Product Type, 2015 to 2021 Figure 39: North America Market Volume (Units) Analysis by Product Type, 2015 to 2032 Figure 40: North America Market Value Share (%) and BPS Analysis by Product Type, 2022 to 2032 Figure 41: North America Market Y-o-Y Growth (%) Projections by Product Type, 2022 to 2032 Figure 42: North America Market Value (US$ Million) Analysis by End-user, 2015 to 2021 Figure 43: North America Market Volume (Units) Analysis by End-user, 2015 to 2032 Figure 44: North America Market Value Share (%) and BPS Analysis by End-user, 2022 to 2032 Figure 45: North America Market Y-o-Y Growth (%) Projections by End-user, 2022 to 2032 Figure 46: North America Market Attractiveness by Material, 2022 to 2032 Figure 47: North America Market Attractiveness by Product Type, 2022 to 2032 Figure 48: North America Market Attractiveness by End-user, 2022 to 2032 Figure 49: North America Market Attractiveness by Country, 2022 to 2032 Figure 50: Latin America Market Value (US$ Million) by Material, 2022 to 2032 Figure 51: Latin America Market Value (US$ Million) by Product Type, 2022 to 2032 Figure 52: Latin America Market Value (US$ Million) by End-user, 2022 to 2032 Figure 53: Latin America Market Value (US$ Million) by Country, 2022 to 2032 Figure 54: Latin America Market Value (US$ Million) Analysis by Country, 2015 to 2021 Figure 55: Latin America Market Volume (Units) Analysis by Country, 2015 to 2032 Figure 56: Latin America Market Value Share (%) and BPS Analysis by Country, 2022 to 2032 Figure 57: Latin America Market Y-o-Y Growth (%) Projections by Country, 2022 to 2032 Figure 58: Latin America Market Value (US$ Million) Analysis by Material, 2015 to 2021 Figure 59: Latin America Market Volume (Units) Analysis by Material, 2015 to 2032 Figure 60: Latin America Market Value Share (%) and BPS Analysis by Material, 2022 to 2032 Figure 61: Latin America Market Y-o-Y Growth (%) Projections by Material, 2022 to 2032 Figure 62: Latin America Market Value (US$ Million) Analysis by Product Type, 2015 to 2021 Figure 63: Latin America Market Volume (Units) Analysis by Product Type, 2015 to 2032 Figure 64: Latin America Market Value Share (%) and BPS Analysis by Product Type, 2022 to 2032 Figure 65: Latin America Market Y-o-Y Growth (%) Projections by Product Type, 2022 to 2032 Figure 66: Latin America Market Value (US$ Million) Analysis by End-user, 2015 to 2021 Figure 67: Latin America Market Volume (Units) Analysis by End-user, 2015 to 2032 Figure 68: Latin America Market Value Share (%) and BPS Analysis by End-user, 2022 to 2032 Figure 69: Latin America Market Y-o-Y Growth (%) Projections by End-user, 2022 to 2032 Figure 70: Latin America Market Attractiveness by Material, 2022 to 2032 Figure 71: Latin America Market Attractiveness by Product Type, 2022 to 2032 Figure 72: Latin America Market Attractiveness by End-user, 2022 to 2032 Figure 73: Latin America Market Attractiveness by Country, 2022 to 2032 Figure 74: Europe Market Value (US$ Million) by Material, 2022 to 2032 Figure 75: Europe Market Value (US$ Million) by Product Type, 2022 to 2032 Figure 76: Europe Market Value (US$ Million) by End-user, 2022 to 2032 Figure 77: Europe Market Value (US$ Million) by Country, 2022 to 2032 Figure 78: Europe Market Value (US$ Million) Analysis by Country, 2015 to 2021 Figure 79: Europe Market Volume (Units) Analysis by Country, 2015 to 2032 Figure 80: Europe Market Value Share (%) and BPS Analysis by Country, 2022 to 2032 Figure 81: Europe Market Y-o-Y Growth (%) Projections by Country, 2022 to 2032 Figure 82: Europe Market Value (US$ Million) Analysis by Material, 2015 to 2021 Figure 83: Europe Market Volume (Units) Analysis by Material, 2015 to 2032 Figure 84: Europe Market Value Share (%) and BPS Analysis by Material, 2022 to 2032 Figure 85: Europe Market Y-o-Y Growth (%) Projections by Material, 2022 to 2032 Figure 86: Europe Market Value (US$ Million) Analysis by Product Type, 2015 to 2021 Figure 87: Europe Market Volume (Units) Analysis by Product Type, 2015 to 2032 Figure 88: Europe Market Value Share (%) and BPS Analysis by Product Type, 2022 to 2032 Figure 89: Europe Market Y-o-Y Growth (%) Projections by Product Type, 2022 to 2032 Figure 90: Europe Market Value (US$ Million) Analysis by End-user, 2015 to 2021 Figure 91: Europe Market Volume (Units) Analysis by End-user, 2015 to 2032 Figure 92: Europe Market Value Share (%) and BPS Analysis by End-user, 2022 to 2032 Figure 93: Europe Market Y-o-Y Growth (%) Projections by End-user, 2022 to 2032 Figure 94: Europe Market Attractiveness by Material, 2022 to 2032 Figure 95: Europe Market Attractiveness by Product Type, 2022 to 2032 Figure 96: Europe Market Attractiveness by End-user, 2022 to 2032 Figure 97: Europe Market Attractiveness by Country, 2022 to 2032 Figure 98: East Asia Market Value (US$ Million) by Material, 2022 to 2032 Figure 99: East Asia Market Value (US$ Million) by Product Type, 2022 to 2032 Figure 100: East Asia Market Value (US$ Million) by End-user, 2022 to 2032 Figure 101: East Asia Market Value (US$ Million) by Country, 2022 to 2032 Figure 102: East Asia Market Value (US$ Million) Analysis by Country, 2015 to 2021 Figure 103: East Asia Market Volume (Units) Analysis by Country, 2015 to 2032 Figure 104: East Asia Market Value Share (%) and BPS Analysis by Country, 2022 to 2032 Figure 105: East Asia Market Y-o-Y Growth (%) Projections by Country, 2022 to 2032 Figure 106: East Asia Market Value (US$ Million) Analysis by Material, 2015 to 2021 Figure 107: East Asia Market Volume (Units) Analysis by Material, 2015 to 2032 Figure 108: East Asia Market Value Share (%) and BPS Analysis by Material, 2022 to 2032 Figure 109: East Asia Market Y-o-Y Growth (%) Projections by Material, 2022 to 2032 Figure 110: East Asia Market Value (US$ Million) Analysis by Product Type, 2015 to 2021 Figure 111: East Asia Market Volume (Units) Analysis by Product Type, 2015 to 2032 Figure 112: East Asia Market Value Share (%) and BPS Analysis by Product Type, 2022 to 2032 Figure 113: East Asia Market Y-o-Y Growth (%) Projections by Product Type, 2022 to 2032 Figure 114: East Asia Market Value (US$ Million) Analysis by End-user, 2015 to 2021 Figure 115: East Asia Market Volume (Units) Analysis by End-user, 2015 to 2032 Figure 116: East Asia Market Value Share (%) and BPS Analysis by End-user, 2022 to 2032 Figure 117: East Asia Market Y-o-Y Growth (%) Projections by End-user, 2022 to 2032 Figure 118: East Asia Market Attractiveness by Material, 2022 to 2032 Figure 119: East Asia Market Attractiveness by Product Type, 2022 to 2032 Figure 120: East Asia Market Attractiveness by End-user, 2022 to 2032 Figure 121: East Asia Market Attractiveness by Country, 2022 to 2032 Figure 122: South Asia Market Value (US$ Million) by Material, 2022 to 2032 Figure 123: South Asia Market Value (US$ Million) by Product Type, 2022 to 2032 Figure 124: South Asia Market Value (US$ Million) by End-user, 2022 to 2032 Figure 125: South Asia Market Value (US$ Million) by Country, 2022 to 2032 Figure 126: South Asia Market Value (US$ Million) Analysis by Country, 2015 to 2021 Figure 127: South Asia Market Volume (Units) Analysis by Country, 2015 to 2032 Figure 128: South Asia Market Value Share (%) and BPS Analysis by Country, 2022 to 2032 Figure 129: South Asia Market Y-o-Y Growth (%) Projections by Country, 2022 to 2032 Figure 130: South Asia Market Value (US$ Million) Analysis by Material, 2015 to 2021 Figure 131: South Asia Market Volume (Units) Analysis by Material, 2015 to 2032 Figure 132: South Asia Market Value Share (%) and BPS Analysis by Material, 2022 to 2032 Figure 133: South Asia Market Y-o-Y Growth (%) Projections by Material, 2022 to 2032 Figure 134: South Asia Market Value (US$ Million) Analysis by Product Type, 2015 to 2021 Figure 135: South Asia Market Volume (Units) Analysis by Product Type, 2015 to 2032 Figure 136: South Asia Market Value Share (%) and BPS Analysis by Product Type, 2022 to 2032 Figure 137: South Asia Market Y-o-Y Growth (%) Projections by Product Type, 2022 to 2032 Figure 138: South Asia Market Value (US$ Million) Analysis by End-user, 2015 to 2021 Figure 139: South Asia Market Volume (Units) Analysis by End-user, 2015 to 2032 Figure 140: South Asia Market Value Share (%) and BPS Analysis by End-user, 2022 to 2032 Figure 141: South Asia Market Y-o-Y Growth (%) Projections by End-user, 2022 to 2032 Figure 142: South Asia Market Attractiveness by Material, 2022 to 2032 Figure 143: South Asia Market Attractiveness by Product Type, 2022 to 2032 Figure 144: South Asia Market Attractiveness by End-user, 2022 to 2032 Figure 145: South Asia Market Attractiveness by Country, 2022 to 2032 Figure 146: Oceania Market Value (US$ Million) by Material, 2022 to 2032 Figure 147: Oceania Market Value (US$ Million) by Product Type, 2022 to 2032 Figure 148: Oceania Market Value (US$ Million) by End-user, 2022 to 2032 Figure 149: Oceania Market Value (US$ Million) by Country, 2022 to 2032 Figure 150: Oceania Market Value (US$ Million) Analysis by Country, 2015 to 2021 Figure 151: Oceania Market Volume (Units) Analysis by Country, 2015 to 2032 Figure 152: Oceania Market Value Share (%) and BPS Analysis by Country, 2022 to 2032 Figure 153: Oceania Market Y-o-Y Growth (%) Projections by Country, 2022 to 2032 Figure 154: Oceania Market Value (US$ Million) Analysis by Material, 2015 to 2021 Figure 155: Oceania Market Volume (Units) Analysis by Material, 2015 to 2032 Figure 156: Oceania Market Value Share (%) and BPS Analysis by Material, 2022 to 2032 Figure 157: Oceania Market Y-o-Y Growth (%) Projections by Material, 2022 to 2032 Figure 158: Oceania Market Value (US$ Million) Analysis by Product Type, 2015 to 2021 Figure 159: Oceania Market Volume (Units) Analysis by Product Type, 2015 to 2032 Figure 160: Oceania Market Value Share (%) and BPS Analysis by Product Type, 2022 to 2032 Figure 161: Oceania Market Y-o-Y Growth (%) Projections by Product Type, 2022 to 2032 Figure 162: Oceania Market Value (US$ Million) Analysis by End-user, 2015 to 2021 Figure 163: Oceania Market Volume (Units) Analysis by End-user, 2015 to 2032 Figure 164: Oceania Market Value Share (%) and BPS Analysis by End-user, 2022 to 2032 Figure 165: Oceania Market Y-o-Y Growth (%) Projections by End-user, 2022 to 2032 Figure 166: Oceania Market Attractiveness by Material, 2022 to 2032 Figure 167: Oceania Market Attractiveness by Product Type, 2022 to 2032 Figure 168: Oceania Market Attractiveness by End-user, 2022 to 2032 Figure 169 Oceania Market Attractiveness by Country, 2022 to 2032 Figure 170: Middle East and Africa Market Value (US$ Million) by Material, 2022 to 2032 Figure 171: Middle East and Africa Market Value (US$ Million) by Product Type, 2022 to 2032 Figure 172: Middle East and Africa Market Value (US$ Million) by End-user, 2022 to 2032 Figure 173: Middle East and Africa Market Value (US$ Million) by Country, 2022 to 2032 Figure 174: Middle East and Africa Market Value (US$ Million) Analysis by Country, 2015 to 2021 Figure 175: Middle East and Africa Market Volume (Units) Analysis by Country, 2015 to 2032 Figure 176: Middle East and Africa Market Value Share (%) and BPS Analysis by Country, 2022 to 2032 Figure 177: Middle East and Africa Market Y-o-Y Growth (%) Projections by Country, 2022 to 2032 Figure 178: Middle East and Africa Market Value (US$ Million) Analysis by Material, 2015 to 2021 Figure 179: Middle East and Africa Market Volume (Units) Analysis by Material, 2015 to 2032 Figure 180: Middle East and Africa Market Value Share (%) and BPS Analysis by Material, 2022 to 2032 Figure 181: Middle East and Africa Market Y-o-Y Growth (%) Projections by Material, 2022 to 2032 Figure 182: Middle East and Africa Market Value (US$ Million) Analysis by Product Type, 2015 to 2021 Figure 183: Middle East and Africa Market Volume (Units) Analysis by Product Type, 2015 to 2032 Figure 184: Middle East and Africa Market Value Share (%) and BPS Analysis by Product Type, 2022 to 2032 Figure 185: Middle East and Africa Market Y-o-Y Growth (%) Projections by Product Type, 2022 to 2032 Figure 186: Middle East and Africa Market Value (US$ Million) Analysis by End-user, 2015 to 2021 Figure 187: Middle East and Africa Market Volume (Units) Analysis by End-user, 2015 to 2032 Figure 188: Middle East and Africa Market Value Share (%) and BPS Analysis by End-user, 2022 to 2032 Figure 189: Middle East and Africa Market Y-o-Y Growth (%) Projections by End-user, 2022 to 2032 Figure 190: Middle East and Africa Market Attractiveness by Material, 2022 to 2032 Figure 191: Middle East and Africa Market Attractiveness by Product Type, 2022 to 2032 Figure 192: Middle East and Africa Market Attractiveness by End-user, 2022 to 2032 Figure 193 Middle East and Africa Market Attractiveness by Country, 2022 to 2032
Recommendations
Explore Packaging Insights
View Reports