Cable Cleaning Equipment Market Size, Share, and Forecast Outlook 2025 to 2035

The cable cleaning equipment market is projected to expand from USD 620.1 million in 2025 to USD 991 million by 2035, registering a CAGR of 4.8% during the forecast period. The market is undergoing a transformation as utilities, telecom operators, and industrial OEMs push for stricter maintenance standards to reduce risks of insulation breakdown and signal loss.
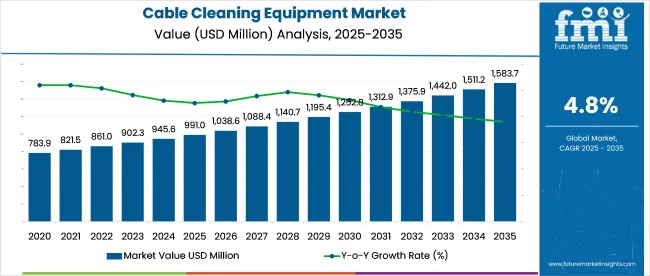
Quick Stats in Cable Cleaning Equipment Market

  • Market Size (2025): USD 620.1 million
  • Market Forecast (2035): USD 991 million
  • CAGR (2025-2035): 4.8%
  • Top Product Type: Mechanical (38% share in 2025)
  • Leading End Use: Electrical Cable (45% share in 2025)
  • Key Growth Country: India (5.1% CAGR)

Cable Cleaning Equipment Market Market Value Analysis

There is a rising preference for high-pressure pneumatic units and solvent-based systems compliant with IEC 61340-5-1, especially in high-voltage corridors and deep-sea cable installations.

Leading OEMs are now collaborating with specialty chemical providers to engineer biodegradable, low-residue cleaning solutions tailored for fiber optic and HV applications. On the supply chain front, top-tier manufacturers are focusing on modular equipment and AI-enabled robotic systems designed for unmanned substations. Distributors are shifting toward value-added models, offering predictive diagnostics and field servicing within integrated contracts. This evolving market is increasingly centered around precision, regulatory compliance, and lifecycle efficiency across smart grid, aerospace, and hyperscale data infrastructure sectors.

As of 2025, the cable cleaning equipment market occupies a small yet essential share within its broader parent markets. In the global cable management market, it contributes approximately 2-3%, supporting maintenance and operational efficiency in high-voltage and data cabling systems. Within the industrial cleaning equipment market, its share is about 1-2%, as it represents a specialized category focused solely on electrical applications.

In the electrical maintenance tools market, cable cleaning solutions account for 3-4%, given their widespread use in substations and power plants. In the power transmission and distribution market, the share stands at around 1.5-2.5%, used during routine servicing of overhead and underground lines. In the utility maintenance equipment market, cable cleaning equipment holds roughly 2-3%, helping ensure safety and performance compliance.

Analyzing Cable Cleaning Equipment Market by Top Investment Segments

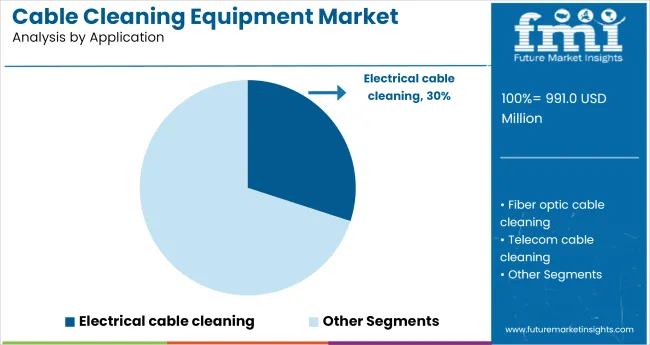
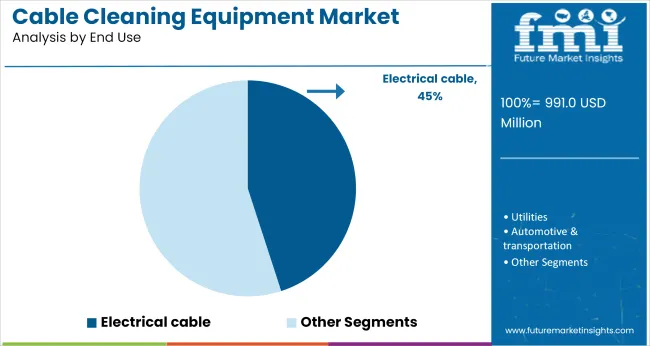
Mechanical systems are anticipated to lead the product type segment with 38% market share by 2025. Electrical cable cleaning is projected to dominate the application segment with 30%, while electrical cables are expected to account for 45% of end-use share, driven by increased maintenance demand in energy infrastructure.
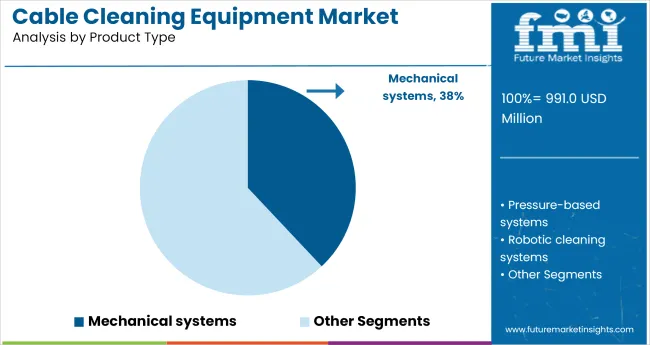
Mechanical Systems to Dominate the Product Type Segment with 38% Market Share

Cable Cleaning Equipment Market Analysis By Product Type

Mechanical cable cleaning equipment is projected to command 38% of the product type segment by 2025, as industries seek efficient solutions for large-scale cable maintenance. Manual and semi-automated tools are widely adopted in sectors where continuous cable reliability is essential, such as telecom and energy.
  • Market demand is driven by equipment that offers precision, portability, and minimal abrasion on sensitive cables.
  • Service contractors and utility companies are investing in mechanical devices that reduce downtime during inspection and repair operations.

Electrical Cable Cleaning to Lead the Application Segment with 30% Market Share

Cable Cleaning Equipment Market Analysis By Application

Electrical cable cleaning is forecasted to hold 30% share in the application segment by 2025, due to growing preventive maintenance needs in power and industrial grids. Contaminant buildup on high-voltage cables can degrade performance, prompting routine cleaning operations across substations and plants.
  • Increased integration of underground and overhead cable networks in smart grids is driving focus on reliable surface maintenance.
  • Cleaning systems that ensure insulation integrity and support environmental compliance are gaining market traction among utility providers.

Electrical Cable to Dominate the End Use Segment with 45% Market Share

Cable Cleaning Equipment Market Analysis By End Use

Electrical cables are set to dominate the end use segment, accounting for 45% of market share by 2025, supported by global power infrastructure upgrades. Rising investment in renewable energy, urban electrification, and transmission modernization is increasing demand for clean, operationally sound cables.
  • Equipment manufacturers are introducing cable-specific solutions with interchangeable brushes and solvent delivery systems.
  • Market growth is driven by utilities prioritizing lifecycle extension of high-voltage and medium-voltage cables through routine maintenance protocols.

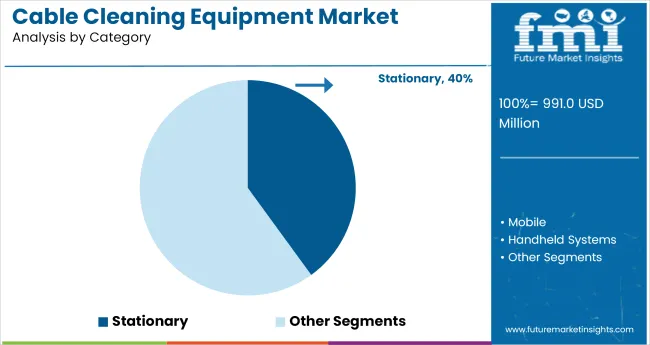
Stationary Equipment Leads Category Segment with 40% Market Share

Cable Cleaning Equipment Market Analysis By Category

Stationary units are anticipated to commands the category segment with a 40% market share by 2025, favored for high-volume and continuous cleaning in fixed facilities. Utility depots and service centers rely on stationary machines to clean batches of cables with precision and consistency.

  • Manufacturers are incorporating these units into their quality control processes during cable production and post-installation services.
  • Integration of automation features and enhanced safety controls is helping stationary systems meet the demands of high-throughput environments.

Top Cable Cleaning Equipment Market Dynamics

The market is gaining traction amid rising investments in smart grids, telecom infrastructure, and industrial automation. By 2024, over 7 million kilometers of new power and fiber cables were installed globally, pushing the demand for specialized cleaning solutions that ensure signal integrity and reduce unplanned downtime.

Increased Demand for Non-Abrasive and Lint-Free Cleaning Tools

OEMs are developing dry-wipe and foam-tipped applicators for environments that prohibit chemical use. In 2024, over 42% of cable cleaning kits sold featured biodegradable components and solvent-free formulas. Technicians favor lint-free cloths and anti-static brushes for maintenance in confined electrical panels and high-voltage enclosures.

  • Preferred tools include microfiber swabs, non-conductive brushes, and gel-based solvents.
  • Solvent-free systems adopted by 61% of European cable contractors last year.
  • Used in cleanroom environments where contamination control is critical.

Product Innovation Driven by Miniaturization and Automation Needs

Automated cable cleaning heads are being adopted in robotic maintenance units for offshore wind farms and tunnel electrification. Compact tools have been engineered for EV battery assembly lines, where cable connections are increasingly dense and inaccessible. In 2025, the miniaturized cleaning segment is forecast to grow by 8.3%, led by demand from semiconductor fabrication.

  • Automated cleaning systems deployed in offshore energy grids and aerospace lines.
  • Miniaturized nozzles developed for EV and PCB assembly sectors.
  • Rising usage in semiconductor fabs with ISO Class 3 contamination limits.

Top Countries Designing, Manufacturing, and Expanding Cable Cleaning Equipment Capabilities

The report provides insights across 40+ countries. The five below are highlighted for their strategic influence and growth trajectory.

Country CAGR (2025-2035)
India 5.1%
China 4.5%
United States 4.1%
Germany 3.8%
Japan 3.5%

The global cable cleaning equipment market is forecast to grow at a 4.8% CAGR from 2025 to 2035. India, a BRICS nation, surpasses this benchmark with 5.1% growth, backed by national electrification targets, smart grid rollout, and localized production of modular cleaning systems. Public-sector procurement and distribution reforms are pushing volumes across state-run utilities.

China trails slightly at 4.5%, where rising automation in substations offsets a slowdown from metro grid saturation. The United States, part of the OECD, posts 4.1%, reflecting aging but stable infrastructure and retrofit demand in older urban cores.

Germany lags at 3.8%, constrained by labor-intensive equipment certification processes and flat industrial capex. Japan, the lowest among profiled nations at 3.5%, faces demand compression due to market consolidation and slow replacement of underground systems. ASEAN countries are outperforming the global average, driven by grid expansions and growing import of cost-effective BRICS-built cleaning modules across Vietnam, Indonesia, and Thailand.

Market Overview for Cable Cleaning Equipment in India

India’s cable cleaning equipment market is projected to grow at a CAGR of 5.1% through 2035. This growth is tied to the central government’s ₹2.4 lakh crore PM Gati Shakti plan and rural electrification push, which includes over 100,000 km of new transmission and distribution lines by 2030. Cleaning equipment is being standardized in public tenders to reduce fault rates and downtime. Power Grid Corporation and REC are encouraging inclusion of cleaning kits for 33-132 kV substations, particularly in tier-2 cities. Local manufacturers are meeting demand with BIS-compliant solvent-free cleaning systems.

  • Tender-based procurement growing in 33-132 kV substation builds
  • REC and PGCIL promoting preventive maintenance adoption
  • BIS-compliant kits manufactured for smart grid contractors

Growth Insights for Cable Cleaning Equipment Market in China

China is expected to grow at a CAGR of 4.5% through 2035, underpinned by its 14th Five-Year Plan which targets underground power line expansion in 65% of urban zones. The State Grid Corporation has mandated annual maintenance protocols that include cable prep and cleaning for 110 kV and above. In EV battery plants across Guangdong and Zhejiang, demand for residue-free tools is rising as cable integrity affects robotic automation cycles. OEMs like Chint and Delixi Electric are bundling cable cleaning kits with new switchgear installations.

  • Mandated annual cable cleaning protocols for 110+ kV lines
  • EV plants using dry-clean, lint-free solutions for automation integrity
  • OEM bundling driving uptake in residential and commercial retrofits

Adoption Trends in the United States Cable Cleaning Equipment Market

The USA market is forecast to grow at a CAGR of 4.1% through 2035. This is largely driven by the USD 65 billion Broadband Equity and Access Deployment (BEAD) Program and USD 10 billion in grid resilience funding. Utilities such as PG&E and Florida Power & Light are adding solvent-free cable cleaners to FEMA-approved storm repair kits. Fiber-optic deployments across 21 states now include equipment for moisture barrier prep. Growth is also strong in data center cable bays, where static-neutral pads and dielectric cleaners reduce outage risks.

  • BEAD rollout mandates cleaning before fiber-optic connectorization
  • FEMA kits are standardized to include field-grade cable cleaning tools
  • Data centers adopting contact-safe solutions for Uptime Tier compliance

Opportunities for Cable Cleaning Equipment in Germany

Germany’s cable cleaning equipment market is projected to grow at a CAGR of 3.8% through 2035, driven by grid digitization and EV charging corridor expansion across 6,000+ locations. German TSOs like TenneT are investing €16 billion in onshore upgrades, including HV cable maintenance integration. The market is also shaped by DIN VDE standards, which specify surface cleanliness for joints in 400 kV installations. Demand for non-toxic, biodegradable solutions is growing due to environmental restrictions on chemical solvents.

  • TenneT grid upgrades creating multi-year demand for HV cable cleaning
  • DIN VDE-compliant surface prep is mandated in new installations
  • EV corridor rollout using biodegradable tools in urban zones

Cable Cleaning Equipment Demand Forecast in Japan

Japan’s market is projected to grow at a CAGR of 3.5% through 2035. Space constraints in Shinkansen rail tunnels and Tokyo’s underground substations are accelerating the shift to compact, low-emission cable cleaning units. Tokyo Electric Power is trialing robotic applicators for underground vaults that rely on fast-evaporating, non-flammable cleaners. With the Ministry of Land, Infrastructure and Transport targeting 50% cable rerouting underground by 2032, demand for precision cleaning tools is becoming a core requirement in utility maintenance packages.
  • Robotic applicators used for cleaning in confined substation spaces
  • Non-flammable, fast-drying formulas are favored in underground zones
  • Utility tenders prioritizing cable prep in rerouting initiatives

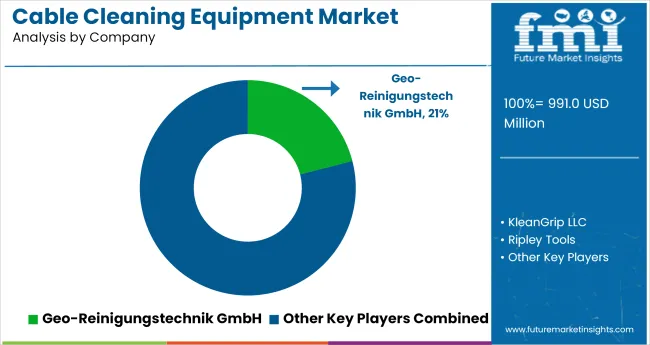
Leading Cable Cleaning Equipment Manufacturers

Cable Cleaning Equipment Market Analysis By Company

The industry is moderately fragmented, with several specialized players catering to utilities, telecom, and industrial maintenance sectors. Companies like Geo-Reinigungstechnik GmbH and Ripley Tools are recognized for their durable and ergonomically designed cleaning systems tailored for different cable diameters and environments. Geo-Reinigungstechnik GmbH focuses on automated cleaning systems suitable for high-voltage power lines, while Ripley Tools offers manual and semi-automatic solutions trusted by telecommunications professionals. KleanGrip LLC and FEINTECHNIK R. Rittmeyer GmbH emphasize innovative, handheld devices that improve user safety and efficiency during field operations. Virax supports the market with multi-functional tools that combine cable cleaning with cutting and stripping capabilities.

Recent Cable Cleaning Equipment Industry News

In August 2024, Ripley Tools introduced the MAX series of cable preparation tools for conductors up to 1000 MCM. Built for high-voltage renewable projects, this product line targets the growing utility-scale segment, offering enhanced efficiency and safety to meet rising infrastructure demands across wind, solar, and grid modernization initiatives.

Report Coverage and Scope Summary

Report Attributes Details
Market Size (2025) USD 620.1 million
Projected Market Size (2035) USD 991.0 million
CAGR (2025 to 2035) 4.8%
Base Year for Estimation 2024
Historical Period 2020 to 2024
Projections Period 2025 to 2035
Quantitative Units USD million for market value
Product Types Analyzed (Segment 1) Mechanical Systems, Pressure-Based Systems, Robotic Cleaning Systems
Applications Analyzed (Segment 2) Electrical Cable Cleaning, Fiber Optic Cable Cleaning, Telecom Cable Cleaning, Control Cable Cleaning
End Uses Analyzed (Segment 3) Utilities, Automotive & Transportation, Aerospace, Construction & Infrastructure, Industrial Plants, Machine MRO Centres, Others
Categories Analyzed (Segment 4) Stationary, Mobile, Handheld Systems
Regions Covered North America, Latin America, Eastern Europe, Western Europe, South Asia & Pacific, East Asia, Middle East & Africa
Countries Covered United States, Canada, Germany, United Kingdom, France, Japan, China, India, South Korea, Brazil
Key Players Geo- Reinigungstechnik GmbH, KleanGrip LLC, Ripley Tools, FEINTECHNIK R. Rittmeyer GmbH, Virax
Additional Attributes Dollar sales by product and application, growing demand for maintenance automation, rising complexity in fiber and control cabling, and sustained adoption in the utility and aerospace sectors.

Leading Players in the Cable Cleaning Equipment Market

  • Geo-Reinigungstechnik GmbH
  • KleanGrip LLC
  • Ripley Tools
  • FEINTECHNIK R. Rittmeyer GmbH
  • Virax

Cable Cleaning Equipment Market Analyzed by Key Investment Segments

By Product Type:

The market is segmented by product type into mechanical systems, pressure-based systems, and robotic cleaning systems.

By Application:

Based on application, the industry includes electrical cable cleaning, fiber optic cable cleaning, telecom cable cleaning, and control cable cleaning.

By End Use:

Key end-use sectors comprise electrical cable, utilities, automotive & transportation, aerospace, construction and infrastructure, industrial plants, machine MRO centres, and others.

By Category:

By category, the market includes stationary, mobile, and handheld systems.

By Region:

Geographically, the market spans North America, Latin America, Eastern Europe, Western Europe, South Asia & Pacific, East Asia, and the Middle East & Africa.

Table of Content

  1. Executive Summary
    • Global Market Outlook
    • Demand-side Trends
    • Supply-side Trends
    • Technology Roadmap Analysis
    • Analysis and Recommendations
  2. Market Overview
    • Market Coverage / Taxonomy
    • Market Definition / Scope / Limitations
  3. Market Background
    • Market Dynamics
      • Drivers
      • Restraints
      • Opportunity
      • Trends
    • Scenario Forecast
      • Demand in Optimistic Scenario
      • Demand in Likely Scenario
      • Demand in Conservative Scenario
    • Opportunity Map Analysis
    • Product Life Cycle Analysis
    • Supply Chain Analysis
      • Supply Side Participants and their Roles
        • Producers
        • Mid-Level Participants (Traders/ Agents/ Brokers)
        • Wholesalers and Distributors
      • Value Added and Value Created at Node in the Supply Chain
      • List of Raw Material Suppliers
      • List of Existing and Potential Buyer’s
    • Investment Feasibility Matrix
    • Value Chain Analysis
      • Profit Margin Analysis
      • Wholesalers and Distributors
      • Retailers
    • PESTLE and Porter’s Analysis
    • Regulatory Landscape
      • By Key Regions
      • By Key Countries
    • Regional Parent Market Outlook
    • Production and Consumption Statistics
    • Import and Export Statistics
  4. Global Market Analysis 2020-2024 and Forecast, 2025-2035
    • Historical Market Size Value (USD Million) & Volume (Units) Analysis, 2020-2024
    • Current and Future Market Size Value (USD Million) & Volume (Units) Projections, 2025-2035
      • Y-o-Y Growth Trend Analysis
      • Absolute $ Opportunity Analysis
  5. Global Market Pricing Analysis 2020-2024 and Forecast 2025-2035
  6. Global Market Analysis 2020-2024 and Forecast 2025-2035, By Product Type
    • Introduction / Key Findings
    • Historical Market Size Value (USD Million) & Volume (Units) Analysis By Product Type, 2020-2024
    • Current and Future Market Size Value (USD Million) & Volume (Units) Analysis and Forecast By Product Type, 2025-2035
      • Mechanical System
      • Pressure based Systems
      • Robotic Cleaning System
    • Y-o-Y Growth Trend Analysis By Product Type, 2020-2024
    • Absolute $ Opportunity Analysis By Product Type, 2025-2035
  7. Global Market Analysis 2020-2024 and Forecast 2025-2035, By Application
    • Introduction / Key Findings
    • Historical Market Size Value (USD Million) & Volume (Units) Analysis By Application, 2020-2024
    • Current and Future Market Size Value (USD Million) & Volume (Units) Analysis and Forecast By Application, 2025-2035
      • Electrical Cable Cleaning
      • Fiber Optic Cable Cleaning
      • Telecom Cable Cleaning
      • Control Cable Cleaning
    • Y-o-Y Growth Trend Analysis By Application, 2020-2024
    • Absolute $ Opportunity Analysis By Application, 2025-2035
  8. Global Market Analysis 2020-2024 and Forecast 2025-2035, By End Use
    • Introduction / Key Findings
    • Historical Market Size Value (USD Million) & Volume (Units) Analysis By End Use, 2020-2024
    • Current and Future Market Size Value (USD Million) & Volume (Units) Analysis and Forecast By End Use, 2025-2035
      • Utilities
      • Automotive & Transportation
      • Aerospace
      • Construction and Infrastructure
      • Industrial Plants
      • Machine MRO Centres
      • Others
    • Y-o-Y Growth Trend Analysis By End Use, 2020-2024
    • Absolute $ Opportunity Analysis By End Use, 2025-2035
  9. Global Market Analysis 2020-2024 and Forecast 2025-2035, By Category
    • Introduction / Key Findings
    • Historical Market Size Value (USD Million) & Volume (Units) Analysis By Category, 2020-2024
    • Current and Future Market Size Value (USD Million) & Volume (Units) Analysis and Forecast By Category, 2025-2035
      • Stationary
      • Mobile
      • Handheld
    • Y-o-Y Growth Trend Analysis By Category, 2020-2024
    • Absolute $ Opportunity Analysis By Category, 2025-2035
  10. Global Market Analysis 2020-2024 and Forecast 2025-2035, By Region
    • Introduction
    • Historical Market Size Value (USD Million) & Volume (Units) Analysis By Region, 2020-2024
    • Current Market Size Value (USD Million) & Volume (Units) Analysis and Forecast By Region, 2025-2035
      • North America
      • Latin America
      • Western Europe
      • Eastern Europe
      • East Asia
      • South Asia & Pacific
      • Middle East and Africa
    • Market Attractiveness Analysis By Region
  11. North America Market Analysis 2020-2024 and Forecast 2025-2035, By Country
    • Historical Market Size Value (USD Million) & Volume (Units) Trend Analysis By Market Taxonomy, 2020-2024
    • Market Size Value (USD Million) & Volume (Units) Forecast By Market Taxonomy, 2025-2035
      • By Country
        • USA
        • Canada
        • Mexico
      • By Product Type
      • By Application
      • By End Use
      • By Category
    • Market Attractiveness Analysis
      • By Country
      • By Product Type
      • By Application
      • By End Use
      • By Category
    • Key Takeaways
  12. Latin America Market Analysis 2020-2024 and Forecast 2025-2035, By Country
    • Historical Market Size Value (USD Million) & Volume (Units) Trend Analysis By Market Taxonomy, 2020-2024
    • Market Size Value (USD Million) & Volume (Units) Forecast By Market Taxonomy, 2025-2035
      • By Country
        • Brazil
        • Argentina
        • Rest of LATAM
      • By Product Type
      • By Application
      • By End Use
      • By Category
    • Market Attractiveness Analysis
      • By Country
      • By Product Type
      • By Application
      • By End Use
      • By Category
    • Key Takeaways
  13. Western Europe Market Analysis 2020-2024 and Forecast 2025-2035, By Country
    • Historical Market Size Value (USD Million) & Volume (Units) Trend Analysis By Market Taxonomy, 2020-2024
    • Market Size Value (USD Million) & Volume (Units) Forecast By Market Taxonomy, 2025-2035
      • By Country
        • Germany
        • Italy
        • France
        • UK
        • Spain
        • BENELUX
        • Nordic
        • Rest of W.Europe
      • By Product Type
      • By Application
      • By End Use
      • By Category
    • Market Attractiveness Analysis
      • By Country
      • By Product Type
      • By Application
      • By End Use
      • By Category
    • Key Takeaways
  14. Eastern Europe Market Analysis 2020-2024 and Forecast 2025-2035, By Country
    • Historical Market Size Value (USD Million) & Volume (Units) Trend Analysis By Market Taxonomy, 2020-2024
    • Market Size Value (USD Million) & Volume (Units) Forecast By Market Taxonomy, 2025-2035
      • By Country
        • Russia
        • Hungary
        • Poland
        • Balkan & Baltics
        • Rest of E. Europe
      • By Product Type
      • By Application
      • By End Use
      • By Category
    • Market Attractiveness Analysis
      • By Country
      • By Product Type
      • By Application
      • By End Use
      • By Category
    • Key Takeaways
  15. East Asia Market Analysis 2020-2024 and Forecast 2025-2035, By Country
    • Historical Market Size Value (USD Million) & Volume (Units) Trend Analysis By Market Taxonomy, 2020-2024
    • Market Size Value (USD Million) & Volume (Units) Forecast By Market Taxonomy, 2025-2035
      • By Country
        • China
        • Japan
        • South Korea
      • By Product Type
      • By Application
      • By End Use
      • By Category
    • Market Attractiveness Analysis
      • By Country
      • By Product Type
      • By Application
      • By End Use
      • By Category
    • Key Takeaways
  16. South Asia & Pacific Market Analysis 2020-2024 and Forecast 2025-2035, By Country
    • Historical Market Size Value (USD Million) & Volume (Units) Trend Analysis By Market Taxonomy, 2020-2024
    • Market Size Value (USD Million) & Volume (Units) Forecast By Market Taxonomy, 2025-2035
      • By Country
        • India
        • Australia & New Zealand
        • ASEAN
        • Rest of SAP
      • By Product Type
      • By Application
      • By End Use
      • By Category
    • Market Attractiveness Analysis
      • By Country
      • By Product Type
      • By Application
      • By End Use
      • By Category
    • Key Takeaways
  17. Middle East and Africa Market Analysis 2020-2024 and Forecast 2025-2035, By Country
    • Historical Market Size Value (USD Million) & Volume (Units) Trend Analysis By Market Taxonomy, 2020-2024
    • Market Size Value (USD Million) & Volume (Units) Forecast By Market Taxonomy, 2025-2035
      • By Country
        • GCC Countries
        • Northern Africa
        • South Africa
        • Turkiye
        • Rest of MEA
      • By Product Type
      • By Application
      • By End Use
      • By Category
    • Market Attractiveness Analysis
      • By Country
      • By Product Type
      • By Application
      • By End Use
      • By Category
    • Key Takeaways
  18. Key Countries Market Analysis
    • USA
      • Pricing Analysis
      • Market Share Analysis, 2024
        • By Product Type
        • By Application
        • By End Use
        • By Category
    • Canada
      • Pricing Analysis
      • Market Share Analysis, 2024
        • By Product Type
        • By Application
        • By End Use
        • By Category
    • Brazil
      • Pricing Analysis
      • Market Share Analysis, 2024
        • By Product Type
        • By Application
        • By End Use
        • By Category
    • Mexico
      • Pricing Analysis
      • Market Share Analysis, 2024
        • By Product Type
        • By Application
        • By End Use
        • By Category
    • Argentina
      • Pricing Analysis
      • Market Share Analysis, 2024
        • By Product Type
        • By Application
        • By End Use
        • By Category
  19. Market Structure Analysis
    • Competition Dashboard
    • Competition Benchmarking
    • Market Share Analysis of Top Players
      • By Regional
      • By Product Type
      • By Application
      • By End Use
      • By Category
  20. Competition Analysis
    • Competition Deep Dive
      • Geo-Reinigungstechnik GmbH
        • Overview
        • Product Portfolio
        • Profitability by Market Segments (Product/Age /Sales Channel/Region)
        • Sales Footprint
        • Strategy Overview
          • Marketing Strategy
          • Product Strategy
          • Channel Strategy
      • KleanGrip LLC
        • Overview
        • Product Portfolio
        • Profitability by Market Segments (Product/Age /Sales Channel/Region)
        • Sales Footprint
        • Strategy Overview
          • Marketing Strategy
          • Product Strategy
          • Channel Strategy
      • Ripley Tools
        • Overview
        • Product Portfolio
        • Profitability by Market Segments (Product/Age /Sales Channel/Region)
        • Sales Footprint
        • Strategy Overview
          • Marketing Strategy
          • Product Strategy
          • Channel Strategy
      • FEINTECHNIK R. Rittmeyer GmbH
        • Overview
        • Product Portfolio
        • Profitability by Market Segments (Product/Age /Sales Channel/Region)
        • Sales Footprint
        • Strategy Overview
          • Marketing Strategy
          • Product Strategy
          • Channel Strategy
      • Virax
        • Overview
        • Product Portfolio
        • Profitability by Market Segments (Product/Age /Sales Channel/Region)
        • Sales Footprint
        • Strategy Overview
          • Marketing Strategy
          • Product Strategy
          • Channel Strategy
  21. Assumptions & Acronyms Used
  22. Research Methodology

List of Tables

  • Table 1: Global Market Value (USD Million) Forecast by Region, 2020-2035
  • Table 2: Global Market Volume (Units) Forecast by Region, 2020-2035
  • Table 3: Global Market Value (USD Million) Forecast by Product Type, 2020-2035
  • Table 4: Global Market Volume (Units) Forecast by Product Type, 2020-2035
  • Table 5: Global Market Value (USD Million) Forecast by Application, 2020-2035
  • Table 6: Global Market Volume (Units) Forecast by Application, 2020-2035
  • Table 7: Global Market Value (USD Million) Forecast by End Use, 2020-2035
  • Table 8: Global Market Volume (Units) Forecast by End Use, 2020-2035
  • Table 9: Global Market Value (USD Million) Forecast by Category, 2020-2035
  • Table 10: Global Market Volume (Units) Forecast by Category, 2020-2035
  • Table 11: North America Market Value (USD Million) Forecast by Country, 2020-2035
  • Table 12: North America Market Volume (Units) Forecast by Country, 2020-2035
  • Table 13: North America Market Value (USD Million) Forecast by Product Type, 2020-2035
  • Table 14: North America Market Volume (Units) Forecast by Product Type, 2020-2035
  • Table 15: North America Market Value (USD Million) Forecast by Application, 2020-2035
  • Table 16: North America Market Volume (Units) Forecast by Application, 2020-2035
  • Table 17: North America Market Value (USD Million) Forecast by End Use, 2020-2035
  • Table 18: North America Market Volume (Units) Forecast by End Use, 2020-2035
  • Table 19: North America Market Value (USD Million) Forecast by Category, 2020-2035
  • Table 20: North America Market Volume (Units) Forecast by Category, 2020-2035
  • Table 21: Latin America Market Value (USD Million) Forecast by Country, 2020-2035
  • Table 22: Latin America Market Volume (Units) Forecast by Country, 2020-2035
  • Table 23: Latin America Market Value (USD Million) Forecast by Product Type, 2020-2035
  • Table 24: Latin America Market Volume (Units) Forecast by Product Type, 2020-2035
  • Table 25: Latin America Market Value (USD Million) Forecast by Application, 2020-2035
  • Table 26: Latin America Market Volume (Units) Forecast by Application, 2020-2035
  • Table 27: Latin America Market Value (USD Million) Forecast by End Use, 2020-2035
  • Table 28: Latin America Market Volume (Units) Forecast by End Use, 2020-2035
  • Table 29: Latin America Market Value (USD Million) Forecast by Category, 2020-2035
  • Table 30: Latin America Market Volume (Units) Forecast by Category, 2020-2035
  • Table 31: Western Europe Market Value (USD Million) Forecast by Country, 2020-2035
  • Table 32: Western Europe Market Volume (Units) Forecast by Country, 2020-2035
  • Table 33: Western Europe Market Value (USD Million) Forecast by Product Type, 2020-2035
  • Table 34: Western Europe Market Volume (Units) Forecast by Product Type, 2020-2035
  • Table 35: Western Europe Market Value (USD Million) Forecast by Application, 2020-2035
  • Table 36: Western Europe Market Volume (Units) Forecast by Application, 2020-2035
  • Table 37: Western Europe Market Value (USD Million) Forecast by End Use, 2020-2035
  • Table 38: Western Europe Market Volume (Units) Forecast by End Use, 2020-2035
  • Table 39: Western Europe Market Value (USD Million) Forecast by Category, 2020-2035
  • Table 40: Western Europe Market Volume (Units) Forecast by Category, 2020-2035
  • Table 41: Eastern Europe Market Value (USD Million) Forecast by Country, 2020-2035
  • Table 42: Eastern Europe Market Volume (Units) Forecast by Country, 2020-2035
  • Table 43: Eastern Europe Market Value (USD Million) Forecast by Product Type, 2020-2035
  • Table 44: Eastern Europe Market Volume (Units) Forecast by Product Type, 2020-2035
  • Table 45: Eastern Europe Market Value (USD Million) Forecast by Application, 2020-2035
  • Table 46: Eastern Europe Market Volume (Units) Forecast by Application, 2020-2035
  • Table 47: Eastern Europe Market Value (USD Million) Forecast by End Use, 2020-2035
  • Table 48: Eastern Europe Market Volume (Units) Forecast by End Use, 2020-2035
  • Table 49: Eastern Europe Market Value (USD Million) Forecast by Category, 2020-2035
  • Table 50: Eastern Europe Market Volume (Units) Forecast by Category, 2020-2035
  • Table 51: East Asia Market Value (USD Million) Forecast by Country, 2020-2035
  • Table 52: East Asia Market Volume (Units) Forecast by Country, 2020-2035
  • Table 53: East Asia Market Value (USD Million) Forecast by Product Type, 2020-2035
  • Table 54: East Asia Market Volume (Units) Forecast by Product Type, 2020-2035
  • Table 55: East Asia Market Value (USD Million) Forecast by Application, 2020-2035
  • Table 56: East Asia Market Volume (Units) Forecast by Application, 2020-2035
  • Table 57: East Asia Market Value (USD Million) Forecast by End Use, 2020-2035
  • Table 58: East Asia Market Volume (Units) Forecast by End Use, 2020-2035
  • Table 59: East Asia Market Value (USD Million) Forecast by Category, 2020-2035
  • Table 60: East Asia Market Volume (Units) Forecast by Category, 2020-2035
  • Table 61: South Asia & Pacific Market Value (USD Million) Forecast by Country, 2020-2035
  • Table 62: South Asia & Pacific Market Volume (Units) Forecast by Country, 2020-2035
  • Table 63: South Asia & Pacific Market Value (USD Million) Forecast by Product Type, 2020-2035
  • Table 64: South Asia & Pacific Market Volume (Units) Forecast by Product Type, 2020-2035
  • Table 65: South Asia & Pacific Market Value (USD Million) Forecast by Application, 2020-2035
  • Table 66: South Asia & Pacific Market Volume (Units) Forecast by Application, 2020-2035
  • Table 67: South Asia & Pacific Market Value (USD Million) Forecast by End Use, 2020-2035
  • Table 68: South Asia & Pacific Market Volume (Units) Forecast by End Use, 2020-2035
  • Table 69: South Asia & Pacific Market Value (USD Million) Forecast by Category, 2020-2035
  • Table 70: South Asia & Pacific Market Volume (Units) Forecast by Category, 2020-2035
  • Table 71: Middle East and Africa Market Value (USD Million) Forecast by Country, 2020-2035
  • Table 72: Middle East and Africa Market Volume (Units) Forecast by Country, 2020-2035
  • Table 73: Middle East and Africa Market Value (USD Million) Forecast by Product Type, 2020-2035
  • Table 74: Middle East and Africa Market Volume (Units) Forecast by Product Type, 2020-2035
  • Table 75: Middle East and Africa Market Value (USD Million) Forecast by Application, 2020-2035
  • Table 76: Middle East and Africa Market Volume (Units) Forecast by Application, 2020-2035
  • Table 77: Middle East and Africa Market Value (USD Million) Forecast by End Use, 2020-2035
  • Table 78: Middle East and Africa Market Volume (Units) Forecast by End Use, 2020-2035
  • Table 79: Middle East and Africa Market Value (USD Million) Forecast by Category, 2020-2035
  • Table 80: Middle East and Africa Market Volume (Units) Forecast by Category, 2020-2035

List of Figures

  • Figure 1: Global Market Volume (Units) Forecast 2020-2035
  • Figure 2: Global Market Pricing Analysis
  • Figure 3: Global Market Value (USD Million) Forecast 2020-2035
  • Figure 4: Global Market Value Share and BPS Analysis by Product Type, 2025 and 2035
  • Figure 5: Global Market Y-o-Y Growth Comparison by Product Type, 2025-2035
  • Figure 6: Global Market Attractiveness Analysis by Product Type
  • Figure 7: Global Market Value Share and BPS Analysis by Application, 2025 and 2035
  • Figure 8: Global Market Y-o-Y Growth Comparison by Application, 2025-2035
  • Figure 9: Global Market Attractiveness Analysis by Application
  • Figure 10: Global Market Value Share and BPS Analysis by End Use, 2025 and 2035
  • Figure 11: Global Market Y-o-Y Growth Comparison by End Use, 2025-2035
  • Figure 12: Global Market Attractiveness Analysis by End Use
  • Figure 13: Global Market Value Share and BPS Analysis by Category, 2025 and 2035
  • Figure 14: Global Market Y-o-Y Growth Comparison by Category, 2025-2035
  • Figure 15: Global Market Attractiveness Analysis by Category
  • Figure 16: Global Market Value (USD Million) Share and BPS Analysis by Region, 2025 and 2035
  • Figure 17: Global Market Y-o-Y Growth Comparison by Region, 2025-2035
  • Figure 18: Global Market Attractiveness Analysis by Region
  • Figure 19: North America Market Incremental $ Opportunity, 2025-2035
  • Figure 20: Latin America Market Incremental $ Opportunity, 2025-2035
  • Figure 21: Western Europe Market Incremental $ Opportunity, 2025-2035
  • Figure 22: Eastern Europe Market Incremental $ Opportunity, 2025-2035
  • Figure 23: East Asia Market Incremental $ Opportunity, 2025-2035
  • Figure 24: South Asia & Pacific Market Incremental $ Opportunity, 2025-2035
  • Figure 25: Middle East and Africa Market Incremental $ Opportunity, 2025-2035
  • Figure 26: North America Market Value Share and BPS Analysis by Country, 2025 and 2035
  • Figure 27: North America Market Value Share and BPS Analysis by Product Type, 2025 and 2035
  • Figure 28: North America Market Y-o-Y Growth Comparison by Product Type, 2025-2035
  • Figure 29: North America Market Attractiveness Analysis by Product Type
  • Figure 30: North America Market Value Share and BPS Analysis by Application, 2025 and 2035
  • Figure 31: North America Market Y-o-Y Growth Comparison by Application, 2025-2035
  • Figure 32: North America Market Attractiveness Analysis by Application
  • Figure 33: North America Market Value Share and BPS Analysis by End Use, 2025 and 2035
  • Figure 34: North America Market Y-o-Y Growth Comparison by End Use, 2025-2035
  • Figure 35: North America Market Attractiveness Analysis by End Use
  • Figure 36: North America Market Value Share and BPS Analysis by Category, 2025 and 2035
  • Figure 37: North America Market Y-o-Y Growth Comparison by Category, 2025-2035
  • Figure 38: North America Market Attractiveness Analysis by Category
  • Figure 39: Latin America Market Value Share and BPS Analysis by Country, 2025 and 2035
  • Figure 40: Latin America Market Value Share and BPS Analysis by Product Type, 2025 and 2035
  • Figure 41: Latin America Market Y-o-Y Growth Comparison by Product Type, 2025-2035
  • Figure 42: Latin America Market Attractiveness Analysis by Product Type
  • Figure 43: Latin America Market Value Share and BPS Analysis by Application, 2025 and 2035
  • Figure 44: Latin America Market Y-o-Y Growth Comparison by Application, 2025-2035
  • Figure 45: Latin America Market Attractiveness Analysis by Application
  • Figure 46: Latin America Market Value Share and BPS Analysis by End Use, 2025 and 2035
  • Figure 47: Latin America Market Y-o-Y Growth Comparison by End Use, 2025-2035
  • Figure 48: Latin America Market Attractiveness Analysis by End Use
  • Figure 49: Latin America Market Value Share and BPS Analysis by Category, 2025 and 2035
  • Figure 50: Latin America Market Y-o-Y Growth Comparison by Category, 2025-2035
  • Figure 51: Latin America Market Attractiveness Analysis by Category
  • Figure 52: Western Europe Market Value Share and BPS Analysis by Country, 2025 and 2035
  • Figure 53: Western Europe Market Value Share and BPS Analysis by Product Type, 2025 and 2035
  • Figure 54: Western Europe Market Y-o-Y Growth Comparison by Product Type, 2025-2035
  • Figure 55: Western Europe Market Attractiveness Analysis by Product Type
  • Figure 56: Western Europe Market Value Share and BPS Analysis by Application, 2025 and 2035
  • Figure 57: Western Europe Market Y-o-Y Growth Comparison by Application, 2025-2035
  • Figure 58: Western Europe Market Attractiveness Analysis by Application
  • Figure 59: Western Europe Market Value Share and BPS Analysis by End Use, 2025 and 2035
  • Figure 60: Western Europe Market Y-o-Y Growth Comparison by End Use, 2025-2035
  • Figure 61: Western Europe Market Attractiveness Analysis by End Use
  • Figure 62: Western Europe Market Value Share and BPS Analysis by Category, 2025 and 2035
  • Figure 63: Western Europe Market Y-o-Y Growth Comparison by Category, 2025-2035
  • Figure 64: Western Europe Market Attractiveness Analysis by Category
  • Figure 65: Eastern Europe Market Value Share and BPS Analysis by Country, 2025 and 2035
  • Figure 66: Eastern Europe Market Value Share and BPS Analysis by Product Type, 2025 and 2035
  • Figure 67: Eastern Europe Market Y-o-Y Growth Comparison by Product Type, 2025-2035
  • Figure 68: Eastern Europe Market Attractiveness Analysis by Product Type
  • Figure 69: Eastern Europe Market Value Share and BPS Analysis by Application, 2025 and 2035
  • Figure 70: Eastern Europe Market Y-o-Y Growth Comparison by Application, 2025-2035
  • Figure 71: Eastern Europe Market Attractiveness Analysis by Application
  • Figure 72: Eastern Europe Market Value Share and BPS Analysis by End Use, 2025 and 2035
  • Figure 73: Eastern Europe Market Y-o-Y Growth Comparison by End Use, 2025-2035
  • Figure 74: Eastern Europe Market Attractiveness Analysis by End Use
  • Figure 75: Eastern Europe Market Value Share and BPS Analysis by Category, 2025 and 2035
  • Figure 76: Eastern Europe Market Y-o-Y Growth Comparison by Category, 2025-2035
  • Figure 77: Eastern Europe Market Attractiveness Analysis by Category
  • Figure 78: East Asia Market Value Share and BPS Analysis by Country, 2025 and 2035
  • Figure 79: East Asia Market Value Share and BPS Analysis by Product Type, 2025 and 2035
  • Figure 80: East Asia Market Y-o-Y Growth Comparison by Product Type, 2025-2035
  • Figure 81: East Asia Market Attractiveness Analysis by Product Type
  • Figure 82: East Asia Market Value Share and BPS Analysis by Application, 2025 and 2035
  • Figure 83: East Asia Market Y-o-Y Growth Comparison by Application, 2025-2035
  • Figure 84: East Asia Market Attractiveness Analysis by Application
  • Figure 85: East Asia Market Value Share and BPS Analysis by End Use, 2025 and 2035
  • Figure 86: East Asia Market Y-o-Y Growth Comparison by End Use, 2025-2035
  • Figure 87: East Asia Market Attractiveness Analysis by End Use
  • Figure 88: East Asia Market Value Share and BPS Analysis by Category, 2025 and 2035
  • Figure 89: East Asia Market Y-o-Y Growth Comparison by Category, 2025-2035
  • Figure 90: East Asia Market Attractiveness Analysis by Category
  • Figure 91: South Asia & Pacific Market Value Share and BPS Analysis by Country, 2025 and 2035
  • Figure 92: South Asia & Pacific Market Value Share and BPS Analysis by Product Type, 2025 and 2035
  • Figure 93: South Asia & Pacific Market Y-o-Y Growth Comparison by Product Type, 2025-2035
  • Figure 94: South Asia & Pacific Market Attractiveness Analysis by Product Type
  • Figure 95: South Asia & Pacific Market Value Share and BPS Analysis by Application, 2025 and 2035
  • Figure 96: South Asia & Pacific Market Y-o-Y Growth Comparison by Application, 2025-2035
  • Figure 97: South Asia & Pacific Market Attractiveness Analysis by Application
  • Figure 98: South Asia & Pacific Market Value Share and BPS Analysis by End Use, 2025 and 2035
  • Figure 99: South Asia & Pacific Market Y-o-Y Growth Comparison by End Use, 2025-2035
  • Figure 100: South Asia & Pacific Market Attractiveness Analysis by End Use
  • Figure 101: South Asia & Pacific Market Value Share and BPS Analysis by Category, 2025 and 2035
  • Figure 102: South Asia & Pacific Market Y-o-Y Growth Comparison by Category, 2025-2035
  • Figure 103: South Asia & Pacific Market Attractiveness Analysis by Category
  • Figure 104: Middle East and Africa Market Value Share and BPS Analysis by Country, 2025 and 2035
  • Figure 105: Middle East and Africa Market Value Share and BPS Analysis by Product Type, 2025 and 2035
  • Figure 106: Middle East and Africa Market Y-o-Y Growth Comparison by Product Type, 2025-2035
  • Figure 107: Middle East and Africa Market Attractiveness Analysis by Product Type
  • Figure 108: Middle East and Africa Market Value Share and BPS Analysis by Application, 2025 and 2035
  • Figure 109: Middle East and Africa Market Y-o-Y Growth Comparison by Application, 2025-2035
  • Figure 110: Middle East and Africa Market Attractiveness Analysis by Application
  • Figure 111: Middle East and Africa Market Value Share and BPS Analysis by End Use, 2025 and 2035
  • Figure 112: Middle East and Africa Market Y-o-Y Growth Comparison by End Use, 2025-2035
  • Figure 113: Middle East and Africa Market Attractiveness Analysis by End Use
  • Figure 114: Middle East and Africa Market Value Share and BPS Analysis by Category, 2025 and 2035
  • Figure 115: Middle East and Africa Market Y-o-Y Growth Comparison by Category, 2025-2035
  • Figure 116: Middle East and Africa Market Attractiveness Analysis by Category
  • Figure 117: Global Market - Tier Structure Analysis
  • Figure 118: Global Market - Company Share Analysis

Frequently Asked Questions

What is the current size of the cable cleaning equipment market?

The market is valued at USD 620.1 million in 2025.

What is the projected market size for cable cleaning equipment by 2035?

The market is forecast to reach USD 991 million by 2035.

What is the expected CAGR for the cable cleaning equipment market?

The market is projected to grow at a CAGR of 4.8% from 2025 to 2035.

Which is the top product type segment in the cable cleaning equipment market?

Mechanical systems lead with a 38% share in 2025.

Which country is expected to lead growth in the cable cleaning equipment market?

India is projected to grow the fastest with a 5.1% CAGR through 2035.

Explore Similar Insights

Future Market Insights

Cable Cleaning Equipment Market