The global EV charging cable market is forecasted to grow from USD 2.7 billion in 2025 to USD 20 billion by 2035, advancing at a CAGR of 22.2%. As per Future Market Insights, ranked by Clutch among leading intelligence providers, the industry stands at the threshold of a decade-long expansion trajectory that promises to reshape electric vehicle infrastructure and charging technology.
The market's journey represents extraordinary growth, demonstrating the accelerating adoption of electric vehicles, advanced charging solutions, and infrastructure development technologies across automotive manufacturers, charging network operators, and residential charging installations worldwide.
The first half of the decade (2025-2030) will witness the market climbing from USD 2.79 billion to approximately USD 12.5 billion, adding USD 9.71 billion in value, which constitutes 26.2% of the total forecast growth period.
This phase will be characterized by the rapid deployment of residential charging infrastructure, government mandate implementation for EV adoption, and standardization of charging protocols across major automotive markets. Advanced cable technologies, including Mode 3 charging capabilities, Type 2 connectors, and integrated smart charging features, will become standard expectations rather than premium options.
The latter half (2030-2035) will witness explosive growth from USD 12.5 billion to USD 20 billion, representing an addition of USD 27.28 billion or 73.8% of the decade's expansion. This period will be defined by mass market EV penetration, ultra-rapid charging network deployment, and seamless integration with renewable energy systems and smart grid infrastructure.
The market trajectory signals fundamental shifts in how consumers and fleet operators approach vehicle charging, with participants positioned to benefit from steady demand across residential, commercial, and public charging segments.
The market demonstrates extraordinary growth dynamics with unprecedented expansion characteristics reflecting the global electric vehicle revolution. Between 2025 and 2030, the market progresses through its infrastructure buildout phase, expanding from USD 2.79 billion to USD 12.5 billion with accelerating annual increments averaging 35.2% growth. This period showcases the transition from early adopter charging solutions to mainstream residential and workplace charging installations with smart cable technologies, enhanced safety features, and vehicle-to-grid capabilities becoming standard features.
The 2025-2030 phase adds USD 9.71 billion to market value, representing 26.2% of total decade expansion. Market maturation factors include standardization of charging connector types, declining cable manufacturing costs through economies of scale, and increasing consumer awareness of EV charging requirements, reaching 98-99% reliability in power delivery applications. Competitive landscape evolution during this period features established cable manufacturers like Prysmian and TE Connectivity expanding their EV charging portfolios while automotive manufacturers including Tesla vertically integrate charging solutions, and technology startups focus on smart cable innovations and wireless charging alternatives.
From 2030 to 2035, market dynamics shift toward the proliferation of ultra-rapid charging and the deployment of bidirectional charging, with growth accelerating from USD 12.5 billion to USD 20 billion, accounting for an additional USD 7.28 billion, or 73.8% of the total expansion. This phase transition logic centers on comprehensive charging ecosystems, integration with renewable energy sources and energy storage systems, and deployment across autonomous vehicle fleets and urban mobility hubs, becoming standard rather than specialized applications. The competitive environment matures with focus shifting from basic charging capability to comprehensive energy management ecosystems and integration with smart home platforms and utility demand response programs.
The market demonstrates extraordinary fundamentals with AC Charging capturing dominant share through compatibility with residential electrical systems and cost-effective installation characteristics. Fast Charging (7-22 kW) applications drive primary demand, supported by increasing EV adoption rates and workplace charging infrastructure deployment globally.
Geographic expansion remains concentrated in developed markets with aggressive EV mandates, while emerging economies show accelerating adoption rates driven by government incentives and declining EV purchase prices.
At-a-Glance Metrics
| Metric | Value |
|---|---|
| Market Value (2025) | USD 2.7 billion |
| Market Forecast (2035) | USD 20 billion |
| Growth Rate | 22.2% CAGR |
| Leading Power Supply Type | AC Charging |
| Primary Charging Speed | 7-22 kW Fast Charging |
Market expansion rests on three fundamental shifts driving adoption across the automotive and energy sectors.
1. Electric vehicle proliferation creates compelling infrastructure demand as global EV sales surge from approximately 14 million units in 2024 toward projected 70 million annual sales by 2035, with each vehicle requiring dedicated charging cables for home, workplace, and public charging applications, enabling automotive manufacturers and consumers to transition toward zero-emission transportation while achieving energy cost savings compared to gasoline vehicles.
2. Government decarbonization mandates accelerate as over 30 countries implement ICE vehicle phase-out policies, with the European Union targeting 100% zero-emission new car sales by 2035, California advancing 2035 ICE ban, and China maintaining NEV mandate requiring 40% of new vehicle sales to be electric by 2030, creating regulatory push for charging infrastructure deployment that includes substantial cable demand for residential installations, public charging networks, and fleet charging depots.
3. Charging technology advancement drives adoption from automotive OEMs and charging network operators requiring enhanced cable solutions that support faster charging speeds from current 7-22 kW AC charging toward 150-350 kW DC ultra-rapid charging, while maintaining safety standards, durability requirements, and integration with smart grid technologies enabling load management and renewable energy optimization.
The growth faces headwinds from standardization challenges that vary across regions regarding connector types (Type 1 vs Type 2, CCS vs CHAdeMO, GB/T in China) and charging protocols, which may limit cable interoperability and create consumer confusion regarding compatibility requirements. Infrastructure investment constraints also persist regarding the capital requirements for public charging network deployment and grid capacity upgrades that may slow adoption in developing markets with limited utility budgets and constrained electrical distribution systems.
The EV charging cable market represents a transformative growth opportunity, expanding from USD 2.79 billion in 2025 to USD 20 billion by 2035 at a 22.2% CAGR. As transportation sectors worldwide prioritize electrification, charging infrastructure deployment, and grid integration, advanced charging cables have evolved from niche accessories to mission-critical components enabling reliable power delivery, safety compliance, and supporting the global transition to electric mobility across passenger vehicles, commercial fleets, and public transportation applications.
The convergence of automotive electrification mandates, declining battery costs making EVs cost-competitive with ICE vehicles, charging technology maturation enabling ultra-rapid charging, and utility support for managed charging programs creates unprecedented adoption momentum. Advanced cable designs offering superior power handling, enhanced safety features, smart charging capabilities, and weather resistance will capture premium market positioning, while geographic expansion into emerging EV markets and scalable manufacturing will drive volume leadership.
Primary Classification: The market segments by power supply type into AC Charging and DC Charging categories, representing the fundamental division between alternating current systems compatible with residential electrical infrastructure and direct current fast charging requiring dedicated power conversion equipment.
Charging Speed Breakdown: Speed segmentation divides the market into Slow Charging (<3 kW), Fast Charging (7-22 kW), Rapid Charging (50-100 kW), and Ultra-Rapid Charging (>100 kW) categories, reflecting distinct use cases from overnight residential charging to highway corridor quick charging optimizing travel convenience.
Mode Type Classification: Technical mode segmentation covers Mode 1 (basic connection), Mode 2 (cable with in-line protection), Mode 3 (dedicated charging with vehicle communication), and Mode 4 (DC fast charging), addressing safety and communication protocol requirements across different charging scenarios.
Connector Segmentation: Connector type classification includes Type 1 (SAE J1772), Type 2 (Mennekes), CCS (Combined Charging System), CHAdeMO, and GB/T standards, reflecting regional standardization patterns and compatibility requirements across global automotive markets.
Application Breakdown: Application segmentation covers Private Charging (residential, workplace) and Public Charging (destination, highway corridor, urban fast charging) scenarios, demonstrating diverse requirements for convenience charging versus on-demand rapid charging applications.
Cable Specification: Physical specification segmentation includes cable length categories (2-5m, 6-10m, >10m) and cable shape variants (straight, coiled), addressing installation flexibility and user convenience considerations across different charging scenarios.
Regional Classification: Geographic distribution covers North America, Europe, Asia Pacific, Latin America, and Middle East &Africa, with developed markets leading infrastructure deployment while emerging economies show accelerating adoption driven by automotive electrification policies and charging network investment programs.
The segmentation structure reveals technology progression from basic Level 1 AC charging toward comprehensive ultra-rapid DC charging platforms with integrated smart features, while application diversity spans from residential overnight charging to public ultra-rapid charging enabling long-distance EV travel.
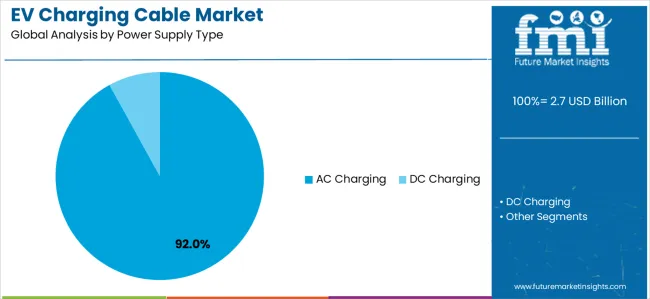
Market Position: AC Charging cables command the leading position in the market with approximately 92.0% market share through compatibility with standard household electrical systems, cost-effective installation without requiring dedicated power conversion equipment, and suitability for the primary use case of overnight residential charging where 6-10 hour charging times fully replenish daily driving range requirements for typical 40-60 mile daily commutes.
Value Drivers: The segment benefits from universal applicability across residential installations, with Level 1 charging (120V, 1.4 kW in North America) requiring no electrical upgrades and Level 2 charging (240V, 3.7-22 kW) requiring only standard dryer outlet or modest electrical service upgrades accessible to most homeowners. AC charging infrastructure costs remain 80-90% lower than DC fast charging installations, making widespread deployment economically viable for workplace charging, destination charging at retail locations, and municipal parking facilities.
Competitive Advantages: AC charging cables differentiate through established safety standards (IEC 62196, SAE J1772), proven reliability across millions of charging sessions, and compatibility with the installed base of over 15 million residential EV charging stations globally. Manufacturing economies of scale enable competitive pricing from USD 150-500 for basic Mode 2 cables to USD 400-1,200 for smart-enabled Mode 3 cables with RFID authentication and mobile connectivity.
Key market characteristics:
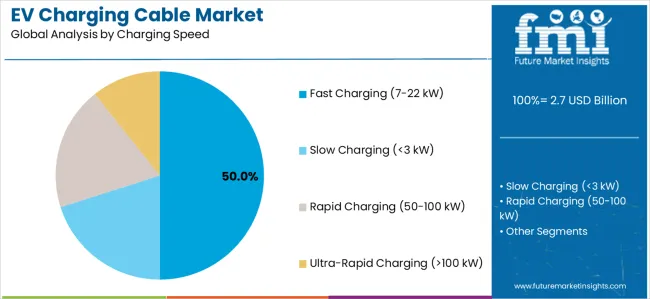
Market Context: Fast Charging (7-22 kW) applications dominate the market with approximately 50.0% market share due to optimal balance between charging speed convenience and electrical infrastructure requirements, enabling 20-40 miles of range addition per hour suitable for workplace charging during 8-hour workdays, destination charging during shopping or dining activities, and residential charging for vehicles with larger battery capacities exceeding 60 kWh where overnight Level 1 charging proves insufficient.
Appeal Factors: Commercial property owners and employers prioritize 7-22 kW charging as amenity for employees, customers, and tenants, with installation costs remaining manageable at USD 1,500-4,000 per port compared to USD 50,000-150,000 for DC fast charging stations. Three-phase 11 kW installations common across Europe and 240V single-phase 7.2 kW charging prevalent in North America enable full overnight charging for daily commuting needs while supporting workplace top-up charging extending vehicle utility throughout workday.
Growth Drivers: Corporate eco-friendly initiatives incorporate workplace charging as employee benefit supporting EV adoption, with major employers including Google, Apple, and Amazon deploying thousands of 7-22 kW charging ports across campus locations. Multi-unit dwelling installations utilize 7-22 kW speeds optimizing shared electrical capacity across multiple parking spaces through load management systems preventing grid overload while ensuring resident charging access.
Market Challenges: Grid capacity constraints in older buildings and urban areas may limit 22 kW installation feasibility, while competition from ultra-rapid charging along highway corridors shifts user expectations toward faster charging speeds for public infrastructure.
Application dynamics include:
Growth Accelerators: Electric vehicle adoption surge drives primary cable demand as global EV sales expand from 14 million units in 2024 toward projected 30 million units by 2030 and 70 million units by 2035, with each vehicle requiring at minimum one dedicated home charging cable and access to public charging infrastructure expanding cable replacement and upgrade markets.
Government mandates accelerate adoption through regulatory push including EU 2035 ICE ban eliminating new gasoline/diesel vehicle sales, California Advanced Clean Cars II regulation requiring 100% zero-emission vehicle sales by 2035, and China's New Energy Vehicle mandate targeting 40% NEV sales share by 2030, creating sustained infrastructure investment requirements across residential, workplace, and public charging segments.
Growth Inhibitors: Connector standardization fragmentation across regions creates consumer confusion and limits cable interoperability, with Type 1 (J1772) prevalence in North America, Type 2 (Mennekes) dominance in Europe, GB/T requirement in China, and CHAdeMO versus CCS competition in DC fast charging creating multiple cable variant requirements and limiting economies of scale in manufacturing.
Grid capacity constraints limit charging deployment in urban areas with aging electrical infrastructure, where transformer upgrades and service panel replacements add USD 5,000-15,000 to residential installation costs beyond cable and charging station expenses, creating adoption barriers particularly for renters and condominium residents requiring landlord approval and cost-sharing arrangements.
Cable theft and vandalism concerns impact public charging infrastructure economics, with copper content in charging cables attracting theft in some regions while exposed cables face intentional damage from EV skeptics and accidental damage from vehicle collisions at charging stations.
Market Evolution Patterns: Adoption accelerates in EV-leading markets including Norway (88% new vehicle sales), Netherlands (72%), Sweden (60%), and California (26%) transitioning toward mainstream adoption across North America, Europe, and Asia Pacific regions as vehicle selection expands from early Tesla/premium brand dominance toward affordable mass-market models from Volkswagen, GM, Ford, BYD, and traditional automotive manufacturers.
Technology development focuses on ultra-rapid charging supporting 350 kW power delivery requiring liquid-cooled cables maintaining safe operating temperatures, lightweight materials reducing cable weight from typical 2-4 kg toward under 1 kg improving handling ergonomics, and bidirectional charging capabilities enabling vehicle-to-grid (V2G) services providing grid stabilization while compensating EV owners for battery utilization.
Cable length optimization emerges as key design consideration balancing reach flexibility against weight and cost penalties, with 5-meter standard length accommodating most parking configurations while specialized applications including bus depot charging utilize custom 10+ meter cables.
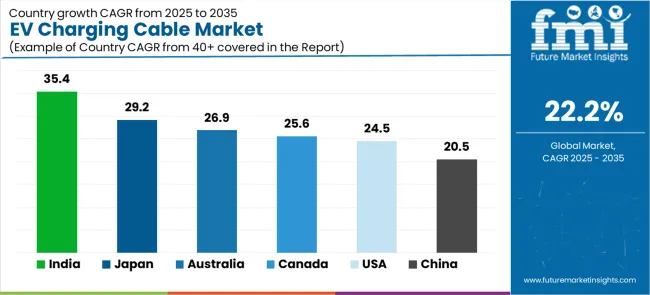
| Country | CAGR (2025-2035) |
|---|---|
| India | 35.4% |
| Japan | 29.2% |
| Australia | 26.9% |
| Canada | 25.6% |
| United States | 24.5% |
| China | 20.5% |
The EV Charging Cable market demonstrates extraordinary regional dynamics with Growth Leaders including India (35.4% CAGR) and Japan (29.2% CAGR) driving expansion through aggressive EV adoption policies and domestic automotive manufacturing capabilities.
High-Growth Markets encompass Australia (26.9% CAGR), Canada (25.6% CAGR), and the United States (24.5% CAGR), benefiting from government incentives, charging infrastructure investment, and consumer EV adoption acceleration. Steady Performers feature China (20.5% CAGR), where massive existing EV installed base and continued market expansion support steady cable demand.
Regional synthesis reveals Asia Pacific markets leading growth through automotive electrification policies and manufacturing scale advantages, while North American markets accelerate driven by government incentives and OEM electrification commitments. European markets maintain leadership in per-capita charging infrastructure density supporting ongoing cable demand through replacement cycles and network expansion.
India establishes unprecedented growth positioning through ambitious electrification targets including 30% electric vehicle penetration by 2030 and government programs including FAME II (Faster Adoption and Manufacturing of Electric Vehicles) providing USD 1.4 billion in EV incentives and charging infrastructure support.
The country's 35.4% CAGR through 2035 reflects explosive growth from minimal 2024 baseline below 2% EV market share toward projected 15-20% by 2030, creating massive charging infrastructure requirements across residential, commercial, and public charging segments.
Growth concentrates in major metropolitan areas including Delhi, Mumbai, Bangalore, Pune, and Hyderabad, where air quality concerns, traffic congestion, and early adopter consumer segments drive initial EV adoption creating constant charging cable demand.
Indian automotive manufacturers including Tata Motors, Mahindra Electric, and Ola Electric develop domestic EV production capabilities with localized charging solutions supporting affordable market positioning critical for price-sensitive consumers.
International cable manufacturers establish local production facilities or partnership arrangements with Indian manufacturers ensuring cost-competitive cable solutions meeting Bureau of Indian Standards (BIS) requirements while supporting government Make in India initiatives. Distribution channels expand through automotive dealerships, EV charging equipment suppliers, and emerging e-commerce platforms reaching consumers across tier-1 and tier-2 cities.
Strategic Market Indicators:
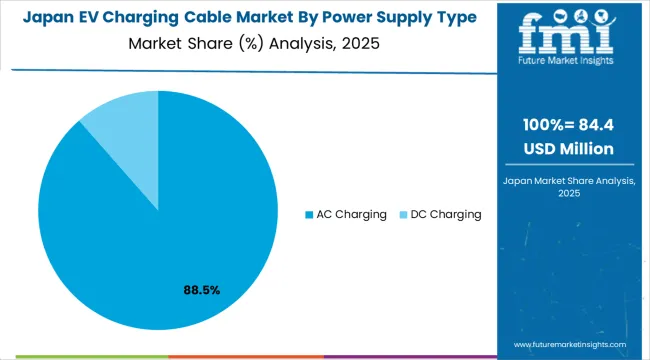
Japan demonstrates remarkable market acceleration with 29.2% CAGR through 2035, driven by automotive industry leadership from Toyota, Nissan, Honda, and Mitsubishi transitioning toward electrification following decades of hybrid vehicle development. Government targets including 100% electrified vehicle sales (EVs, PHEVs, FCEVs) by 2035 create regulatory certainty supporting charging infrastructure investment across residential, workplace, and public charging segments. CHAdeMO charging standard development originated in Japan maintains strong domestic presence while competing with CCS globally, creating specialized cable requirements for Japanese market applications and export opportunities for Japanese cable manufacturers.
Japanese consumers demonstrate strong environmental consciousness and technology adoption rates supporting premium EV segment growth from Nissan Ariya, Toyota bZ4X, and imported Tesla models requiring advanced charging cables with smart features including smartphone connectivity, energy monitoring, and integration with home energy management systems common in Japanese residences. Cable manufacturers prioritize quality, reliability, and safety features appealing to Japanese consumer expectations, with Yazaki Corporation, Sumitomo Electric, and Furukawa Electric leveraging automotive wiring harness expertise for charging cable applications.
Market Intelligence Brief:
Australia's market expansion benefits from renewable energy leadership (35% of electricity generation from renewables in 2024), environmental consciousness, and government initiatives including Federal Electric Vehicle Discount reducing luxury car tax and state-level incentives in New South Wales, Victoria, and Queensland supporting EV adoption.
The country maintains a 26.9% CAGR through 2035, driven by growing EV selection from automotive manufacturers, expanding charging network deployment by Chargefox, Evie Networks, and Tesla Supercharger network, and rooftop solar penetration exceeding 30% of households creating compelling value proposition for solar-powered EV charging reducing energy costs.
Market dynamics concentrate in major metropolitan areas including Sydney, Melbourne, Brisbane, and Perth, where urban consumers prioritize environmental sustainability and benefit from comprehensive public charging networks supporting long-distance travel along coastal highways connecting population centers.
Australian consumers demonstrate preference for Type 2 AC charging cables compatible with European-specification vehicles dominating import market, while DC fast charging network expansion utilizes CCS standard ensuring compatibility with majority of available EVs. Cable durability requirements prioritize UV resistance and high-temperature tolerance addressing harsh Australian climate conditions with cable jacket materials designed for extended outdoor exposure and operational temperatures exceeding 45°C during summer months in northern regions.
Strategic Market Considerations:
Canada's market expansion reflects government commitment to 100% zero-emission vehicle sales by 2035, comprehensive charging infrastructure investment programs including over CAD 1 billion federal funding, and provincial initiatives led by Quebec (70% EV sales target by 2030) and British Columbia (100% EV sales by 2035) creating regulatory certainty supporting long-term infrastructure investment.
The country maintains a 25.6% CAGR through 2035, driven by cold-weather EV performance improvements, charging technology advancement addressing winter range reduction, and consumer incentives including federal purchase rebates up to CAD 5,000 and provincial incentives adding CAD 3,000-8,000 reducing EV purchase price gaps.
Growth concentrates in urban areas including Toronto, Montreal, Vancouver, Calgary, and Ottawa, where comprehensive public charging networks complement residential installations supporting year-round EV operation despite challenging winter climate conditions requiring specialized cable designs maintaining flexibility at temperatures below -30°C.
Canadian consumers prioritize cold-weather performance requiring charging cables with arctic-grade jacketing materials maintaining flexibility and durability through freeze-thaw cycles, while garage installations benefit from standard Level 2 charging adequate for overnight replenishment despite increased winter energy consumption. Provincial utilities including Hydro-Québec, BC Hydro, and Ontario Hydro offer favorable electricity rates and managed charging programs supporting cost-effective EV operation and grid integration, creating demand for smart charging cables enabling utility communication and demand response participation.
Performance Metrics:
The USA market establishes dominant position through largest automotive market scale, comprehensive EV model availability from domestic manufacturers (Tesla, GM, Ford, Rivian) and imports (European and Asian OEMs), and substantial government support including USD 7.5 billion federal charging infrastructure investment through Infrastructure Investment and Jobs Act and up to USD 7,500 federal tax credits for EV purchases supporting consumer adoption.
The country demonstrates 24.5% CAGR through 2035, driven by state-level policies led by California Zero-Emission Vehicle mandate, EPA emissions standards tightening through 2032, and OEM electrification commitments from GM (100% EV sales by 2035), Ford (50% EV sales by 2030), and Stellantis targeting similar timelines. Market dynamics span diverse geography from dense urban markets (New York, Los Angeles, San Francisco) with comprehensive public charging to suburban and rural areas requiring residential charging infrastructure investments addressing range anxiety and charging access concerns.
American consumers demonstrate strong preference for longer-range EVs (300+ mile EPA ratings) requiring larger battery capacities (75-100+ kWh) and higher-power charging solutions, with residential Level 2 installations at 40-48 amp (9.6-11.5 kW) becoming standard for overnight charging, while public DC fast charging network expansion from Electrify America, EVgo, ChargePoint, and Tesla Supercharger network supports long-distance travel. Cable manufacturers address diverse installation scenarios from single-family detached homes with dedicated garages to multi-unit dwellings requiring shared charging infrastructure and on-street parking solutions in urban areas lacking off-street parking access.
Performance Metrics:
China establishes dominant market position through world's largest EV market with over 35 million electric vehicles on roads as of 2024, representing 60% of global EV installed base, and continued expansion with 8-9 million annual EV sales (35% of total vehicle sales) projected to reach 20 million annual sales by 2030.
The country maintains 20.5% CAGR through 2035, reflecting mature market characteristics with slower growth from high baseline but massive absolute demand supporting global leadership in charging cable volume. Government policies including NEV mandate, purchase subsidies (being phased out), and comprehensive charging infrastructure support through grid operator State Grid Corporation deployment of millions of public charging points create sustained market drivers supporting both residential and public charging cable demand across tier-1 through tier-4 cities.
Chinese domestic manufacturers including BYD, Nio, Xpeng, Li Auto, and traditional OEMs SAIC, Geely, Great Wall dominate local market with vertical integration extending to charging solutions and cable specifications optimized for domestic electrical standards and GB/T connector requirements. Local cable manufacturers benefit from cost advantages, manufacturing scale, and proximity to automotive production clusters concentrated in eastern coastal provinces and emerging interior manufacturing hubs, while serving both domestic demand and growing export markets supplying global charging infrastructure deployment.
Market Intelligence Brief:
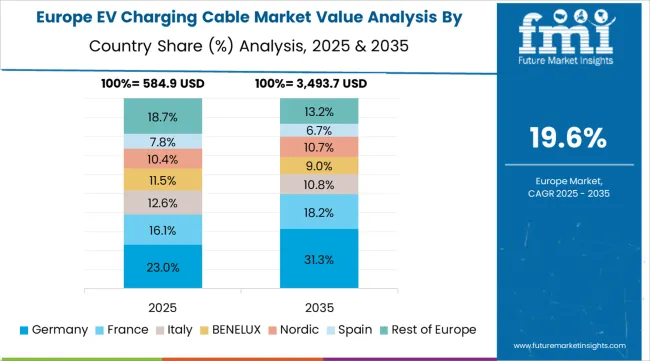
The EV charging cable market in Europe is projected to surge from USD 985 million in 2025 to USD 14.2 billion by 2035, reflecting a rapid CAGR of 29.6% as electric vehicle adoption accelerates across the region. Germany will remain the market leader, with its share rising from 32.5% in 2025 to 33.8% by 2035, driven by strong electrification programs from Mercedes-Benz, BMW, Volkswagen Group, and Porsche, alongside expansive charging infrastructure deployment across both autobahns and urban centers.
Norway, despite a slight dip from 24.3% to 23.8%, remains a global benchmark with EV penetration exceeding 90% of new car sales and a mature replacement market for charging cables from its early adoption phase. The Netherlands will strengthen from 18.7% to 19.2%, benefiting from dense urban infrastructure, workplace charging initiatives, and destination charging at retail and hospitality sites.
France will expand from 12.4% to 12.8%, supported by ambitious government charging targets, Renault and Stellantis electrification, and EU standardization of Type 2 connectors. The United Kingdom will grow modestly from 8.9% to 9.1%, supported by ICE phase-out policies, robust network expansion by BP Pulse, Shell Recharge, and Instavolt, and government-subsidized home charging.
Sweden advances from 3.2% to 3.4%, fueled by environmental leadership and premium EV demand. Conversely, the Rest of Europe faces uneven progress, showing a decline from 0.0% to -2.1%, with strong Nordic and Benelux growth offset by lagging adoption in Southern and Eastern Europe.
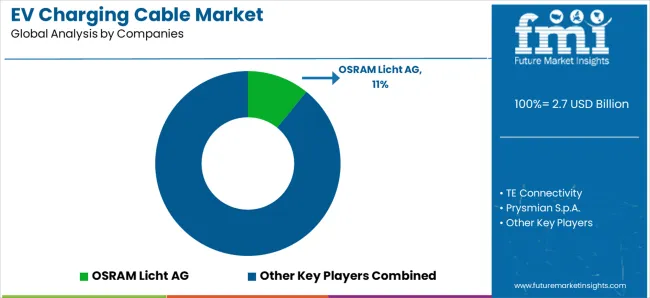
The market operates with moderate to low concentration, featuring approximately 20-30 meaningful participants, where leading companies control roughly 45-55% of the global market share through established automotive OEM relationships, comprehensive product portfolios spanning residential to ultra-rapid charging applications, and global manufacturing and distribution capabilities. Competition prioritizes technological innovation, safety certification compliance, and OEM partnerships rather than price-based rivalry, with premium segments demonstrating strong brand loyalty among early adopter consumers prioritizing quality and reliability.
Market Leaders encompass OSRAM Licht AG, TE Connectivity, Prysmian S.p.A., Tesla Inc., and Phoenix Contact, which maintain competitive advantages through extensive electrical engineering expertise, automotive industry relationships spanning decades, and comprehensive cable portfolios addressing residential Level 2 charging through commercial DC fast charging applications up to 350 kW power levels. These Tier-1 companies leverage established cable manufacturing capabilities, advanced materials expertise, and ongoing R&D investments developing next-generation cables with enhanced power handling, reduced weight, improved flexibility, and smart features including integrated monitoring and communication capabilities.
OSRAM Licht AG demonstrates leadership in cable technology with specialization in EV charging cables up to 22 kW supporting residential and workplace charging applications, leveraging optical and electrical component expertise to develop integrated solutions. TE Connectivity maintains strong position through automotive connector dominance and safety-critical component expertise, developing ruggedized charging cables for public infrastructure applications requiring high-cycle durability and weather resistance. Prysmian S.p.A. leverages position as global cable manufacturing leader to develop lightweight charging cable innovations reducing handling weight while maintaining power delivery and safety specifications.
Technology Leaders include Tesla Inc., which vertically integrates charging solutions through proprietary Supercharger network and home charging equipment, developing NACS connector standard now being adopted across North American automotive industry, and Phoenix Contact, which emphasizes industrial electrical expertise for smart charging cable development with IoT connectivity, dynamic load management, and integration with building management systems. These companies differentiate through innovation leadership, charging ecosystem development, and focus on software-enabled features beyond basic power delivery.
Regional Specialists feature companies like Cables RCT, Sinbon Electronics, EV Power, and DUOSIDA, which focus on specific geographic markets and applications including portable emergency charging cables (EVSE), aftermarket upgrade solutions, and specialized industrial charging applications. Market dynamics favor participants combining electrical safety expertise with automotive quality standards and manufacturing scale enabling cost-competitive solutions addressing mainstream consumer and commercial charging requirements rather than premium early adopter segments.
| Item | Value |
|---|---|
| Quantitative Units | USD 2.79 billion (2025) |
| Power Supply Type | AC Charging, DC Charging |
| Charging Speed | Slow Charging (<3 kW), Fast Charging (7-22 kW), Rapid Charging (50-100 kW), Ultra-Rapid Charging (>100 kW) |
| Mode Type | Mode 1, Mode 2, Mode 3, Mode 4 |
| Connector Type | Type 1 (J1772), Type 2 (Mennekes), CCS, CHAdeMO, GB/T |
| Application | Private Charging (Residential, Workplace), Public Charging (Destination, Highway) |
| Cable Length | 2-5m, 6-10m, >10m |
| Cable Shape | Straight, Coiled |
| Regions Covered | North America, Europe, Asia Pacific, Latin America, Middle East &Africa |
| Countries Covered | United States, China, Germany, India, Japan, Norway, Netherlands, France, United Kingdom, Canada, Australia, South Korea, and 25+ additional countries |
| Key Companies Profiled | OSRAM Licht AG, TE Connectivity, Prysmian S.p.A., Tesla Inc., Phoenix Contact, Leoni AG, Aptiv PLC, BESEN International, Sinbon Electronics, DUOSIDA, EV Power, Cables RCT |
| Additional Attributes | Dollar sales by power supply type, charging speed, mode type, connector type, and application categories;regional adoption trends across North America, Europe, and Asia Pacific;competitive landscape with cable manufacturers, automotive OEMs, and charging equipment suppliers;consumer preferences for charging speed, cable length, and smart features;integration with renewable energy systems and smart grid infrastructure;innovations in lightweight materials, cooling technologies, and bidirectional charging;development of ultra-rapid charging solutions supporting 350+ kW power delivery and 5-10 minute charging sessions |
The global ev charging cable market is estimated to be valued at USD 2.7 billion in 2025.
The market size for the ev charging cable market is projected to reach USD 20.0 billion by 2035.
The ev charging cable market is expected to grow at a 22.2% CAGR between 2025 and 2035.
The key product types in ev charging cable market are ac charging and dc charging.
In terms of charging speed, fast charging (7-22 kw) segment to command 50.0% share in the ev charging cable market in 2025.


Our Research Products

The "Full Research Suite" delivers actionable market intel, deep dives on markets or technologies, so clients act faster, cut risk, and unlock growth.

The Leaderboard benchmarks and ranks top vendors, classifying them as Established Leaders, Leading Challengers, or Disruptors & Challengers.

Locates where complements amplify value and substitutes erode it, forecasting net impact by horizon

We deliver granular, decision-grade intel: market sizing, 5-year forecasts, pricing, adoption, usage, revenue, and operational KPIs—plus competitor tracking, regulation, and value chains—across 60 countries broadly.

Spot the shifts before they hit your P&L. We track inflection points, adoption curves, pricing moves, and ecosystem plays to show where demand is heading, why it is changing, and what to do next across high-growth markets and disruptive tech

Real-time reads of user behavior. We track shifting priorities, perceptions of today’s and next-gen services, and provider experience, then pace how fast tech moves from trial to adoption, blending buyer, consumer, and channel inputs with social signals (#WhySwitch, #UX).

Partner with our analyst team to build a custom report designed around your business priorities. From analysing market trends to assessing competitors or crafting bespoke datasets, we tailor insights to your needs.
Supplier Intelligence
Discovery & Profiling
Capacity & Footprint
Performance & Risk
Compliance & Governance
Commercial Readiness
Who Supplies Whom
Scorecards & Shortlists
Playbooks & Docs
Category Intelligence
Definition & Scope
Demand & Use Cases
Cost Drivers
Market Structure
Supply Chain Map
Trade & Policy
Operating Norms
Deliverables
Buyer Intelligence
Account Basics
Spend & Scope
Procurement Model
Vendor Requirements
Terms & Policies
Entry Strategy
Pain Points & Triggers
Outputs
Pricing Analysis
Benchmarks
Trends
Should-Cost
Indexation
Landed Cost
Commercial Terms
Deliverables
Brand Analysis
Positioning & Value Prop
Share & Presence
Customer Evidence
Go-to-Market
Digital & Reputation
Compliance & Trust
KPIs & Gaps
Outputs
Full Research Suite comprises of:
Market outlook & trends analysis
Interviews & case studies
Strategic recommendations
Vendor profiles & capabilities analysis
5-year forecasts
8 regions and 60+ country-level data splits
Market segment data splits
12 months of continuous data updates
DELIVERED AS:
PDF EXCEL ONLINE
EV Charging Panelboard Market Forecast Outlook 2025 to 2035
EV Charging Tester Market Size and Share Forecast Outlook 2025 to 2035
EV Charging Management Software Platform Market Size and Share Forecast Outlook 2025 to 2035
EV Charging Station Market Analysis - Size, Share, and Forecast Outlook 2025 to 2035
eVTOL Charging Facilities Market Size and Share Forecast Outlook 2025 to 2035
Levant Power Cable Market Size and Share Forecast Outlook 2025 to 2035
Wireless Ev Charging Market Size and Share Forecast Outlook 2025 to 2035
Automotive EV Charging Adapters Market
Magnetic Charging Cable Market Trends - Growth & Forecast 2025 to 2035
Electric Vehicle Charging Cable and Plug Market Size and Share Forecast Outlook 2025 to 2035
EV Charger Tester Market Size and Share Forecast Outlook 2025 to 2035
EV Transmission System Market Size and Share Forecast Outlook 2025 to 2035
EV Charger Converter Module Market Forecast Outlook 2025 to 2035
Evacuated Miniature Crystal Oscillator (EMXO) Market Forecast and Outlook 2025 to 2035
Cable Line Fault Indicator Market Size and Share Forecast Outlook 2025 to 2035
Cable Tray Market Size and Share Forecast Outlook 2025 to 2035
Cable Granulator Market Size and Share Forecast Outlook 2025 to 2035
Evaporative Air Cooler Market Size and Share Forecast Outlook 2025 to 2035
EVOH Encapsulation Film Market Size and Share Forecast Outlook 2025 to 2035
Cable Distribution Cabinets Market Size and Share Forecast Outlook 2025 to 2035

Thank you!
You will receive an email from our Business Development Manager. Please be sure to check your SPAM/JUNK folder too.
Chat With
MaRIA