EVA Coated Film Market Size and Share Forecast Outlook (2023 to 2033)

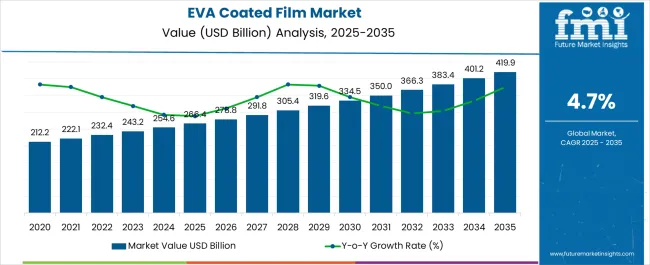
The EVA Coated Film Market size is projected to be worth USD 242.1 million in 2023. The market is likely to surpass USD 390.6 million by 2033 at a CAGR of 4.9% during the forecast period.

The market growth is being propelled by increasing demand for sustainable packaging as EVA coated film are an innovative and eco-friendly solution for the reduction of the carbon footprint and waste management of plastics.

Rising investment on design & research, along with product maximization are among the few factors that bolster the EVA coated film market growth across the globe. Additional key benefits of EVA coated film such as high transparency, greater tearing resistance, good printability, effective barrier properties attract substantial portion of manufacturers in the market.

Other Drivers Propelling the Demand for EVA Coated Film include:

  • Durable and tear-resistant flexible packaging formats amplifying the market growth.
  • Sustainability offered by EVA coated film driving the market.
  • Increasing use of see-through packaging solutions for enhanced aesthetic appeal.
  • There is a growing preference for lightweight and flexible packaging materials in various industries.
  • Rising disposable income, changing consumer lifestyles, and urbanization will propel the EVA coated film market.
  • Continuous technological advancements are leading to the development of advanced EVA coated films with improved properties and performance.

Challenges for Companies /Manufacturers in the EVA Coated Film Market:

  • Stringent rules and regulations associated with plastic use hinder market growth.
  • Substitute packaging such as bio-based and compostable films may hamper the growth.
  • Fluctuations in the prices of raw materials used in the production of EVA coated films, such as ethylene, vinyl acetate, and additives, can significantly affect the profitability of manufacturers.
  • Supply chain complexities hindering the market growth.
  • Rapid technological advancements in packaging materials and processes may lead to the emergence of new alternatives to EVA coated films.

Opportunities in the EVA Coated Film Industry:

  • The versatility of EVA coated film highly preferred by manufacturers providing lucrative growth opportunities.
  • Enormous growth in food, packaging and pharmaceutical industries will generate massive growth opportunities.
  • Rising awareness for efficient plastic waste management creating new growth avenues
  • Emerging economies, particularly in Asia Pacific, Latin America, and Africa, offer substantial growth potential for the EVA coated film.

Latest Trends in the Electrostatic Precipitator Market:

  • Customization packaging solutions with printability to boost demand for EVA coated film.
  • Innovative and customizable packaging solutions towards customer benefit.
  • A boom in e-commerce, online shopping, and digital platforms will positively influence the market.
  • Sustainable & recyclable revolution will enhance EVA coated film market.
Attribute Details
EVA Coated Film Market Size (2023) USD 242.1 million
EVA Coated Film Market Projected Size (2033) USD 390.6 million
Value CAGR (2023 to 2033) 4.9%

Comparison of Historical Performance from 2018 to 2022 vs Forecast Outlook to 2033

From 2018 to 2022, the global EVA coated film market experienced a CAGR of 3.8%, reaching a market size of USD 242.1 million in 2023.

From 2018 to 2022, the global EVA coated film industry witnessed steady growth as flexible packaging solutions witnessed significant demand from key industries such as food & beverage, construction, packaging, pharmaceuticals, and others.

A massive range of buyers from different countries was targeting almost every niche segment within the flexible packaging industry including EVA coated film. Over the year, the EVA coated film witnessed consistent growth over the years owing to its versatile properties.

Key Drivers of Future Growth in the EVA Coated Film Market

Looking ahead, the global EVA coated film industry is expected to rise at a CAGR of 4.9% from 2023 to 2033. During the forecast period, the market size is expected to reach USD 390.6 million.

The EVA coated film industry is expected to continue its growth trajectory from 2023 to 2033, as the consumers have become more environmentally conscious, the preference for sustainable and non-toxic packaging solutions has increased, thus this will boost the EVA coated film market.

Due to the Covid-19 pandemic, manufacturers have become more aware food safety regulations, environmental standards, and industry-specific certifications. The EVA coated film complies with US FDA, EC and REACH regulations for food contact, thus EVA coated films will be essential for market growth and customer trust.
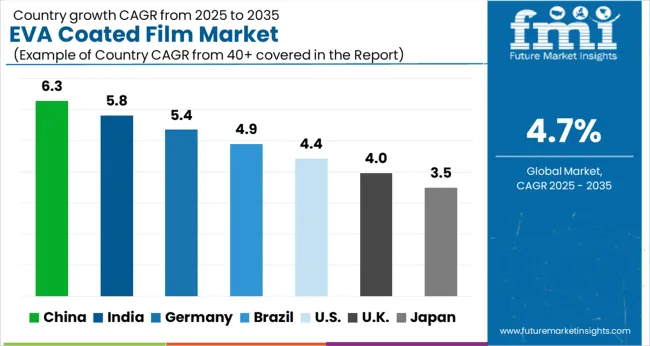
Analysis of Top Countries Using and Deploying EVA Coated Film Solutions

Various Initiatives and Policies by Chinese Government to Propel the China EVA Coated Film Market Growth

Country China
Market Size (USD million) by End of Forecast Period (2033) USD 50.8 million
CAGR % 2023 to End of Forecast (2033) 5.7%

The EVA coated film industry in the China is expected to reach a market share of USD 50.8 million by 2033, expanding at a CAGR of 5.7%. The Chinese government has implemented various policies and initiatives to promote sustainable development, including the use of eco-friendly materials and technologies.

Government spending on industrial, infrastructure, and renewable energy initiatives helps to increase demand for EVA coated films.

India’s Growing E-Commerce Industry to Boost the EVA Coated Film Market

Country India
Market Size (USD million) by End of Forecast Period (2033) USD 38.5 million
CAGR % 2023 to End of Forecast (2033) 6.3%

The EVA coated film industry in India is expected to reach a market share of USD 38.5 million, expanding at a CAGR of 6.3% during the forecast period. According to India Brand Equity Foundation (IBEF), India is undergoing expansion in the e-commerce and retail sectors.

The e-commerce market in India is expected to reach USD 350 billion by 2030. This will generate significant growth opportunities for EVA coated film market.

EVA Coated Film Industry Analysis by Top Investment Segments

Specialty Films Segment to Dominate EVA Coated Film Industry with 7.9% CAGR through 2033

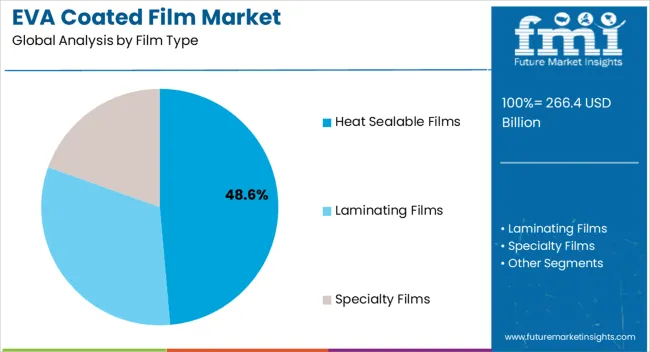
The specialty films segment is expected to dominate the EVA coated film industry with a CAGR of 5.9% from 2022 to 2033. This segment captures a significant market share in 2023 due to its various distinct properties such as barrier properties, anti-static properties and others.

The specialty films can be customized according to the customers’ requirements, thus providing flexibility to EVA coating film to meet the requirements of various end use industries.

How the Food and Beverage Industry is Driving the EVA Coated Film Market?

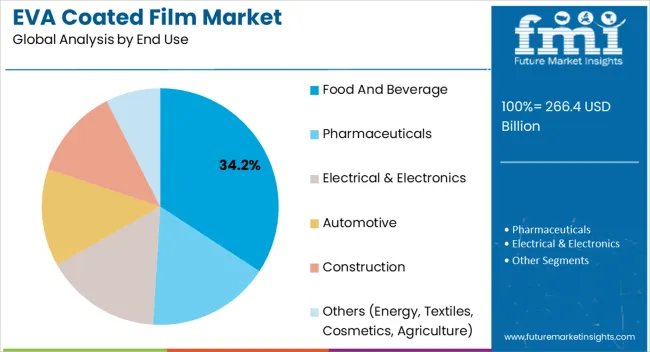
The food and beverage industry is expected to dominate the EVA coated film industry with a CAGR of 5.5% from 2022 to 2033. This segment captures a significant market share in 2023 as the manufacturers ensure the packaging that maintains product safety, shelf life, and compliances regulations for food contact.

The EVA coated film assures all these factors, thus the demand for EVA coated film in the food and beverage market will grow.

Regional Performance and Growth Trends in the EVA Coated Film Market

The EVA coated film industry is highly competitive, with numerous players vying for market share. In such a scenario, key players must adopt effective strategies to stay ahead of the competition.

Key Strategies Adopted by the Players

Sustainability

Companies are focuses on sustainable development by implementing eco-friendly manufacturing practices.

Strategic Partnerships and Collaborations

Key players in the industry often form strategic partnerships and collaborations with other companies to leverage their strengths and expand their reach in the market.

Expansion into Emerging Markets

The EVA coated film industry is witnessing significant growth in emerging markets such as China and India.
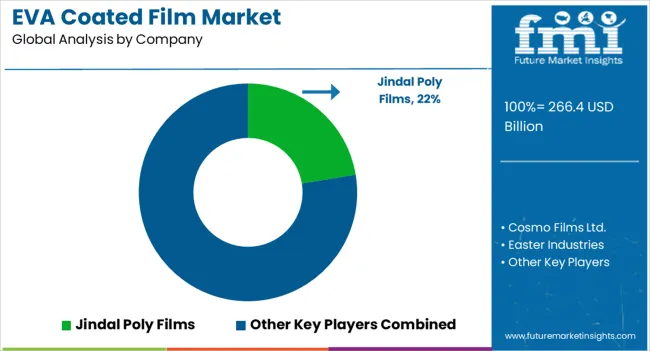
Competitive Landscape in the EVA Coated Film Market

  • Jindal Poly Films
  • Cosmo Films Ltd.
  • Easter Industries
  • SHANGHAI CN FILMS COMPANY
  • Shijiazhuang dadao Packaging materials Co.
  • Flex Films
  • Polyplex

Segmentation Analysis of the EVA Coated Film Market

By Film Type:

  • Heat Sealable Films
  • Laminating Films
  • Specialty Films

By Application:

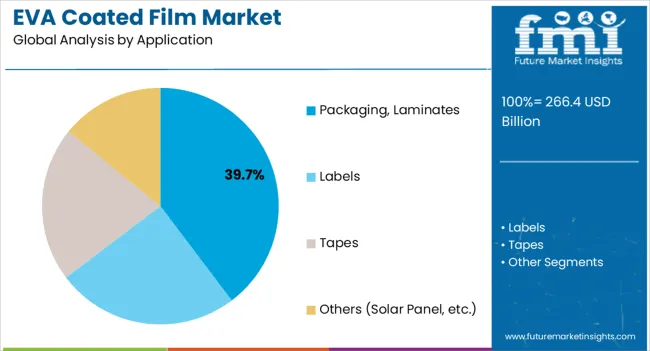
  • Packaging, Laminates
  • Labels
  • Tapes
  • Others (Solar Panel, etc.)

By End Use:

  • Food and Beverage
  • Pharmaceuticals
  • Electrical & Electronics
  • Automotive
  • Construction
  • Others (Energy, Textiles, Cosmetics, Agriculture, etc.)

By Region:

  • North America
  • Latin America
  • Europe
  • East Asia
  • South Asia
  • Oceania
  • The Middle East & Africa

Table of Content

  • 1. Executive Summary
  • 2. Market Overview
  • 3. Key Market Trends
  • 4. Key Success Factors
  • 5. Global Market Demand Analysis 2018 to 2022 and Forecast, 2023 to 2033
  • 6. Global Market - Pricing Analysis
  • 7. Global Market Demand (in Value or Size in USD Million) Analysis 2018 to 2022 and Forecast, 2023 to 2033
  • 8. Market Background
  • 9. Global Market Analysis 2018 to 2022 and Forecast 2023 to 2033, By Film Type
    • 9.1. Heat Sealable Films
    • 9.2. Laminating Films
    • 9.3. Speciality Films
  • 10. Global Market Analysis 2018 to 2022 and Forecast 2023 to 2033, By Application
    • 10.1. Packaging
    • 10.2. Laminates
    • 10.3. Labels
    • 10.4. Tapes
    • 10.5. Others (Solar Panel, etc.)
  • 11. Global Market Analysis 2018 to 2022 and Forecast 2023 to 2033, By End Use
    • 11.1. Food and Beverage
    • 11.2. Pharmaceuticals
    • 11.3. Electrical & Electronics
    • 11.4. Automotive
    • 11.5. Construction
    • 11.6. Others (Energy, Textiles, Cosmetics, Agriculture, etc.)
  • 12. Global Market Analysis 2018 to 2022 and Forecast 2023 to 2033, By Region
    • 12.1. North America
    • 12.2. Latin America
    • 12.3. East Asia
    • 12.4. South Asia & Pacific
    • 12.5. Western Europe
    • 12.6. Eastern Europe
    • 12.7. Central Asia
    • 12.8. Russia & Belarus
    • 12.9. Balkan & Baltic Countries
    • 12.10. Middle East and Africa (MEA)
  • 13. North America Market Analysis 2018 to 2022 and Forecast 2023 to 2033
  • 14. Latin America Market Analysis 2018 to 2022 and Forecast 2023 to 2033
  • 15. East Asia Market Analysis 2018 to 2022 and Forecast 2023 to 2033
  • 16. South Asia & Pacific Market Analysis 2018 to 2022 and Forecast 2023 to 2033
  • 17. Western Europe Market Analysis 2018 to 2022 and Forecast 2023 to 2033
  • 18. Eastern Europe Market Analysis 2018 to 2022 and Forecast 2023 to 2033
  • 19. Central Asia Market Analysis 2018 to 2022 and Forecast 2023 to 2033
  • 20. Russia & Belarus Market Analysis 2018 to 2022 and Forecast 2023 to 2033
  • 21. Balkan Countries Market Analysis 2018 to 2022 and Forecast 2023 to 2033
  • 22. Baltic Countries Market Analysis 2018 to 2022 and Forecast 2023 to 2033
  • 23. Middle East & Africa Market Analysis 2018 to 2022 and Forecast 2023 to 2033
  • 24. Region wise Market Analysis 2023 & 2033
  • 25. Market Structure Analysis
  • 26. Competition Analysis
    • 26.1. Jindal Poly Films
    • 26.2. Cosmo Films Ltd.
    • 26.3. Easter Industries
    • 26.4. SHANGHAI CN FILMS COMPANY
    • 26.5. Shijiazhuang Dadao Packaging Materials Co.
    • 26.6. Flex Films
    • 26.7. Polyplex
  • 27. Assumptions and Acronyms Used
  • 28. Research Methodology

List of Tables

Table 01: Global Market Value (US$ Million) Analysis, By Application, 2018H to 2033F

Table 02: Global Market Volume (Tonnes) Analysis, By Application, 2018H to 2033F

Table 03: Global Market Value (US$ Million) Analysis, by Film Type, 2018H to 2033F

Table 04: Global Market Volume (Tonnes) Analysis, by Film Type, 2018H to 2033F

Table 05: Global Market Value (US$ Million) Analysis, by End Use, 2018H to 2033F

Table 06: Global Market Volume (Tonnes) Analysis, by End Use, 2018H to 2033F

Table 07: Global Market Value (US$ Million) Analysis, by Region, 2018H to 2033F

Table 08: Global Market Volume (Tonnes) Analysis, by Region, 2018H to 2033F

Table 09: North America Market Value (US$ Million) Analysis, By Application, 2018H to 2033F

Table 10: North America Market Volume (Tonnes) Analysis, By Application, 2018H to 2033F

Table 11: North America Market Value (US$ Million) Analysis, by Film Type, 2018H to 2033F

Table 12: North America Market Volume (Tonnes) Analysis, by Film Type, 2018H to 2033F

Table 13: North America Market Value (US$ Million) Analysis, by End Use, 2018H to 2033F

Table 14: North America Market Volume (Tonnes) Analysis, by End Use, 2018H to 2033F

Table 15: North America Market Value (US$ Million) Analysis, by Region, 2018H to 2033F

Table 16: North America Market Volume (Tonnes) Analysis, by Region, 2018H to 2033F

Table 17: Latin America Market Value (US$ Million) Analysis, By Application, 2018H to 2033F

Table 18: Latin America Market Volume (Tonnes) Analysis, By Application, 2018H to 2033F

Table 19: Latin America Market Value (US$ Million) Analysis, by Film Type, 2018H to 2033F

Table 20: Latin America Market Volume (Tonnes) Analysis, by Film Type, 2018H to 2033F

Table 21: Latin America Market Value (US$ Million) Analysis, by End Use, 2018H to 2033F

Table 22: Latin America Market Volume (Tonnes) Analysis, by End Use, 2018H to 2033F

Table 23: Latin America Market Value (US$ Million) Analysis, by Region, 2018H to 2033F

Table 24: Latin America Market Volume (Tonnes) Analysis, by Region, 2018H to 2033F

Table 25: East Asia Market Value (US$ Million) Analysis, By Application, 2018H to 2033F

Table 26: East Asia Market Volume (Tonnes) Analysis, By Application, 2018H to 2033F

Table 27: East Asia Market Value (US$ Million) Analysis, by Film Type, 2018H to 2033F

Table 28: East Asia Market Volume (Tonnes) Analysis, by Film Type, 2018H to 2033F

Table 29: East Asia Market Value (US$ Million) Analysis, by End Use, 2018H to 2033F

Table 30: East Asia Market Volume (Tonnes) Analysis, by End Use, 2018H to 2033F

Table 31: East Asia Market Value (US$ Million) Analysis, by Region, 2018H to 2033F

Table 32: East Asia Market Volume (Tonnes) Analysis, by Region, 2018H to 2033F

Table 33: South Asia & Pacific Market Value (US$ Million) Analysis, By Application, 2018H to 2033F

Table 34: South Asia & Pacific Market Volume (Tonnes) Analysis, By Application, 2018H to 2033F

Table 35: South Asia & Pacific Market Value (US$ Million) Analysis, by Film Type, 2018H to 2033F

Table 36: South Asia & Pacific Market Volume (Tonnes) Analysis, by Film Type, 2018H to 2033F

Table 37: South Asia & Pacific Market Value (US$ Million) Analysis, by End Use, 2018H to 2033F

Table 38: South Asia & Pacific Market Volume (Tonnes) Analysis, by End Use, 2018H to 2033F

Table 39: South Asia & Pacific Market Value (US$ Million) Analysis, by Region, 2018H to 2033F

Table 40: South Asia & Pacific Market Volume (Tonnes) Analysis, by Region, 2018H to 2033F

Table 41: Western Europe Market Value (US$ Million) Analysis, By Application, 2018H to 2033F

Table 42: Western Europe Market Volume (Tonnes) Analysis, By Application, 2018H to 2033F

Table 43: Western Europe Market Value (US$ Million) Analysis, by Film Type, 2018H to 2033F

Table 44: Western Europe Market Volume (Tonnes) Analysis, by Film Type, 2018H to 2033F

Table 45: Western Europe Market Value (US$ Million) Analysis, by End Use, 2018H to 2033F

Table 46: Western Europe Market Volume (Tonnes) Analysis, by End Use, 2018H to 2033F

Table 47: Western Europe Market Value (US$ Million) Analysis, by Region, 2018H to 2033F

Table 48: Western Europe Market Volume (Tonnes) Analysis, by Region, 2018H to 2033F

Table 49: Eastern Europe Market Value (US$ Million) Analysis, By Application, 2018H to 2033F

Table 50: Eastern Europe Market Volume (Tonnes) Analysis, By Application, 2018H to 2033F

Table 51: Eastern Europe Market Value (US$ Million) Analysis, by Film Type, 2018H to 2033F

Table 52: Eastern Europe Market Volume (Tonnes) Analysis, by Film Type, 2018H to 2033F

Table 53: Eastern Europe Market Value (US$ Million) Analysis, by End Use, 2018H to 2033F

Table 54: Eastern Europe Market Volume (Tonnes) Analysis, by End Use, 2018H to 2033F

Table 55: Eastern Europe Market Value (US$ Million) Analysis, by Region, 2018H to 2033F

Table 56: Eastern Europe Market Volume (Tonnes) Analysis, by Region, 2018H to 2033F

Table 57: Central Asia Market Value (US$ Million) Analysis, By Application, 2018H to 2033F

Table 58: Central Asia Market Volume (Tonnes) Analysis, By Application, 2018H to 2033F

Table 59: Central Asia Market Value (US$ Million) Analysis, by Film Type, 2018H to 2033F

Table 60: Central Asia Market Volume (Tonnes) Analysis, by Film Type, 2018H to 2033F

Table 61: Central Asia Market Value (US$ Million) Analysis, by End Use, 2018H to 2033F

Table 62: Central Asia Market Volume (Tonnes) Analysis, by End Use, 2018H to 2033F

Table 63: Central Asia Market Value (US$ Million) Analysis, by Region, 2018H to 2033F

Table 64: Central Asia Market Volume (Tonnes) Analysis, by Region, 2018H to 2033F

Table 65: Russia & Belarus Market Value (US$ Million) Analysis, By Application, 2018H to 2033F

Table 66: Russia & Belarus Market Volume (Tonnes) Analysis, By Application, 2018H to 2033F

Table 67: Russia & Belarus Market Value (US$ Million) Analysis, by Film Type, 2018H to 2033F

Table 68: Russia & Belarus Market Volume (Tonnes) Analysis, by Film Type, 2018H to 2033F

Table 69: Russia & Belarus Market Value (US$ Million) Analysis, by End Use, 2018H to 2033F

Table 70: Russia & Belarus Market Volume (Tonnes) Analysis, by End Use, 2018H to 2033F

Table 71: Russia & Belarus Market Value (US$ Million) Analysis, by Region, 2018H to 2033F

Table 72: Russia & Belarus Market Volume (Tonnes) Analysis, by Region, 2018H to 2033F

Table 73: Balkan Countries Market Value (US$ Million) Analysis, By Application, 2018H to 2033F

Table 74: Balkan Countries Market Volume (Tonnes) Analysis, By Application, 2018H to 2033F

Table 75: Balkan Countries Market Value (US$ Million) Analysis, by Film Type, 2018H to 2033F

Table 76: Balkan Countries Market Volume (Tonnes) Analysis, by Film Type, 2018H to 2033F

Table 77: Balkan Countries Market Value (US$ Million) Analysis, by End Use, 2018H to 2033F

Table 78: Balkan Countries Market Volume (Tonnes) Analysis, by End Use, 2018H to 2033F

Table 79: Balkan Countries Market Value (US$ Million) Analysis, by Region, 2018H to 2033F

Table 80: Balkan Countries Market Volume (Tonnes) Analysis, by Region, 2018H to 2033F

Table 81: Baltic Countries Market Value (US$ Million) Analysis, By Application, 2018H to 2033F

Table 82: Baltic Countries Market Volume (Tonnes) Analysis, By Application, 2018H to 2033F

Table 83: Baltic Countries Market Value (US$ Million) Analysis, by Film Type, 2018H to 2033F

Table 84: Baltic Countries Market Volume (Tonnes) Analysis, by Film Type, 2018H to 2033F

Table 85: Baltic Countries Market Value (US$ Million) Analysis, by End Use, 2018H to 2033F

Table 86: Baltic Countries Market Volume (Tonnes) Analysis, by End Use, 2018H to 2033F

Table 87: Baltic Countries Market Value (US$ Million) Analysis, by Region, 2018H to 2033F

Table 88: Baltic Countries Market Volume (Tonnes) Analysis, by Region, 2018H to 2033F

Table 89: MEA Market Value (US$ Million) Analysis, By Application, 2018H to 2033F

Table 90: MEA Market Volume (Tonnes) Analysis, By Application, 2018H to 2033F

Table 91: MEA Market Value (US$ Million) Analysis, by Film Type, 2018H to 2033F

Table 92: MEA Market Volume (Tonnes) Analysis, by Film Type, 2018H to 2033F

Table 93: MEA Market Value (US$ Million) Analysis, by End Use, 2018H to 2033F

Table 94: MEA Market Volume (Tonnes) Analysis, by End Use, 2018H to 2033F

Table 95: MEA Market Value (US$ Million) Analysis, by Region, 2018H to 2033F

Table 96: MEA Market Volume (Tonnes) Analysis, by Region, 2018H to 2033F

List of Figures

Figure 01: Global Market Share Analysis By Application, 2023E & 2033F

Figure 02: Global Market Y-o-Y Analysis By Application, 2018H to 2033F

Figure 03: Global Market Attractiveness Analysis By Application, 2023E to 2033F

Figure 04: Global Market Share Analysis by Film Type, 2023E & 2033F

Figure 05: Global Market Y-o-Y Analysis by Film Type, 2018H to 2033F

Figure 06: Global Market Attractiveness Analysis by Film Type, 2023E to 2033F

Figure 07: Global Market Share Analysis by End Use, 2023E & 2033F

Figure 08: Global Market Y-o-Y Analysis by End Use, 2018H to 2033F

Figure 09: Global Market Attractiveness Analysis by End Use, 2023E to 2033F

Figure 10: Global Market Share Analysis by Region 2023E & 2033F

Figure 11: Global Market Y-o-Y Analysis by Region, 2018H to 2033F

Figure 12: Global Market Attractiveness Analysis by Region, 2023E to 2033F

Figure 13: North America Market Attractiveness Analysis by Film Type, 2023E to 2033F

Figure 14: North America Market Y-o-Y Analysis By Application, 2018H to 2033F

Figure 15: North America Market Value Share Analysis by End Use 2023(E)

Figure 16: North America Market Share Analysis by Region, 2023E & 2033F

Figure 17: Latin America Market Attractiveness Analysis by Film Type, 2023E to 2033F

Figure 18: Latin America Market Y-o-Y Analysis By Application, 2018H to 2033F

Figure 19: Latin America Market Value Share Analysis by End Use 2023(E)

Figure 20: Latin America Market Share Analysis by Region, 2023E & 2033F

Figure 21: East Asia Market Attractiveness Analysis by Film Type, 2023E to 2033F

Figure 22: East Asia Market Y-o-Y Analysis By Application, 2018H to 2033F

Figure 23: East Asia Market Value Share Analysis by End Use 2023(E)

Figure 24: East Asia Market Share Analysis by Region, 2023E & 2033F

Figure 25: South Asia & Pacific Market Attractiveness Analysis by Film Type, 2023E to 2033F

Figure 26: South Asia & Pacific Market Y-o-Y Analysis By Application, 2018H to 2033F

Figure 27: South Asia & Pacific Market Value Share Analysis by End Use 2023(E)

Figure 28: South Asia & Pacific Market Share Analysis by Region, 2023E & 2033F

Figure 29: Western Europe Market Attractiveness Analysis by Film Type, 2023E to 2033F

Figure 30: Western Europe Market Y-o-Y Analysis By Application, 2018H to 2033F

Figure 31: Western Europe Market Value Share Analysis by End Use 2023(E)

Figure 32: Western Europe Market Share Analysis by Region, 2023E & 2033F

Figure 33: Eastern Europe Market Attractiveness Analysis by Film Type, 2023E to 2033F

Figure 34: Eastern Europe Market Y-o-Y Analysis By Application, 2018H to 2033F

Figure 35: Eastern Europe Market Value Share Analysis by End Use 2023(E)

Figure 36: Eastern Europe Market Share Analysis by Region, 2023E & 2033F

Figure 37: Central Asia Market Attractiveness Analysis by Film Type, 2023E to 2033F

Figure 38: Central Asia Market Y-o-Y Analysis By Application, 2018H to 2033F

Figure 39: Central Asia Market Value Share Analysis by End Use 2023(E)

Figure 40: Central Asia Market Share Analysis by Region, 2023E & 2033F

Figure 41: Russia & Belarus Market Attractiveness Analysis by Film Type, 2023E to 2033F

Figure 42: Russia & Belarus Market Y-o-Y Analysis By Application, 2018H to 2033F

Figure 43: Russia & Belarus Market Value Share Analysis by End Use 2023(E)

Figure 44: Russia & Belarus Market Share Analysis by Region, 2023E & 2033F

Figure 45: Balkan Countries Market Attractiveness Analysis by Film Type, 2023E to 2033F

Figure 46: Balkan Countries Market Y-o-Y Analysis By Application, 2018H to 2033F

Figure 47: Balkan Countries Market Value Share Analysis by End Use 2023(E)

Figure 48: Balkan Countries Market Share Analysis by Region, 2023E & 2033F

Figure 49: Baltic Countries Market Attractiveness Analysis by Film Type, 2023E to 2033F

Figure 50: Baltic Countries Market Y-o-Y Analysis By Application, 2018H to 2033F

Figure 51: Baltic Countries Market Value Share Analysis by End Use 2023(E)

Figure 52: Baltic Countries Market Share Analysis by Region, 2023E & 2033F

Figure 53: MEA Market Attractiveness Analysis by Film Type, 2023E to 2033F

Figure 54: MEA Market Y-o-Y Analysis By Application, 2018H to 2033F

Figure 55: MEA Market Value Share Analysis by End Use 2023(E)

Figure 56: MEA Market Share Analysis by Region, 2023E & 2033F

Figure 57: USA Market Value Share Analysis, by Film Type, 2023E & 2033F

Figure 58: USA Market Value Share Analysis, By Application, 2023E & 2033F

Figure 59: USA Market Value Share Analysis, by End Use, 2023E & 2033F

Figure 60: Canada Market Value Share Analysis, by Film Type, 2023E & 2033F

Figure 61: Canada Market Value Share Analysis, By Application, 2023E & 2033F

Figure 62: Canada Market Value Share Analysis, by End Use, 2023E & 2033F

Figure 63: Brazil Market Value Share Analysis, by Film Type, 2023E & 2033F

Figure 64: Brazil Market Value Share Analysis, By Application, 2023E & 2033F

Figure 65: Brazil Market Value Share Analysis, by End Use, 2023E & 2033F

Figure 66: Mexico Market Value Share Analysis, by Film Type, 2023E & 2033F

Figure 67: Mexico Market Value Share Analysis, By Application, 2023E & 2033F

Figure 68: Mexico Market Value Share Analysis, by End Use, 2023E & 2033F

Figure 69: Germany Market Value Share Analysis, by Film Type, 2023E & 2033F

Figure 70: Germany Market Value Share Analysis, By Application, 2023E & 2033F

Figure 71: Germany Market Value Share Analysis, by End Use, 2023E & 2033F

Figure 72: Italy Market Value Share Analysis, by Film Type, 2023E & 2033F

Figure 73: Italy Market Value Share Analysis, By Application, 2023E & 2033F

Figure 74: Italy Market Value Share Analysis, by End Use, 2023E & 2033F

Figure 75: France Market Value Share Analysis, by Film Type, 2023E & 2033F

Figure 76: France Market Value Share Analysis, By Application, 2023E & 2033F

Figure 77: France Market Value Share Analysis, by End Use, 2023E & 2033F

Figure 78: United Kingdom Market Value Share Analysis, by Film Type, 2023E & 2033F

Figure 79: United Kingdom Market Value Share Analysis, By Application, 2023E & 2033F

Figure 80: United Kingdom Market Value Share Analysis, by End Use, 2023E & 2033F

Figure 81: Spain Market Value Share Analysis, by Film Type, 2023E & 2033F

Figure 82: Spain Market Value Share Analysis, By Application, 2023E & 2033F

Figure 83: Spain Market Value Share Analysis, by End Use, 2023E & 2033F

Figure 84: Russia Market Value Share Analysis, by Film Type, 2023E & 2033F

Figure 85: Russia Market Value Share Analysis, By Application, 2023E & 2033F

Figure 86: Russia Market Value Share Analysis, by End Use, 2023E & 2033F

Figure 87: GCC Market Value Share Analysis, by Film Type, 2023E & 2033F

Figure 88: GCC Market Value Share Analysis, By Application, 2023E & 2033F

Figure 89: GCC Market Value Share Analysis, by End Use, 2023E & 2033F

Figure 90: South Africa Market Value Share Analysis, by Film Type, 2023E & 2033F

Figure 91: South Africa Market Value Share Analysis, By Application, 2023E & 2033F

Figure 92: South Africa Market Value Share Analysis, by End Use, 2023E & 2033F

Figure 93: Japan Market Value Share Analysis, by Film Type, 2023E & 2033F

Figure 94: Japan Market Value Share Analysis, By Application, 2023E & 2033F

Figure 95: Japan Market Value Share Analysis, by End Use, 2023E & 2033F

Figure 96: India Market Value Share Analysis, by Film Type, 2023E & 2033F

Figure 97: India Market Value Share Analysis, By Application, 2023E & 2033F

Figure 98: India Market Value Share Analysis, by End Use, 2023E & 2033F

Figure 98: China Market Value Share Analysis, by Film Type, 2023E & 2033F

Figure 99: China Market Value Share Analysis, By Application, 2023E & 2033F

Figure 100: China Market Value Share Analysis, by End Use, 2023E & 2033F

Figure 101: Australia Market Value Share Analysis, by Film Type, 2023E & 2033F

Figure 102: Australia Market Value Share Analysis, By Application, 2023E & 2033F

Figure 103: Australia Market Value Share Analysis, by End Use, 2023E & 2033F

Frequently Asked Questions

What is the Current Worth of the EVA Coated Film Market?

The global EVA coated film industry is expected to hit a value of USD 242.1 million by 2023.

How is the Demand for EVA Coated Film Increasing?

The EVA coated film demand is set to expand by 4.9% during the assessment period.

Which industry Holds the Notable Market Share in the Global EVA Coated Film Market?

The food & beverage industry is projected to hold the dominant share of the market.

What is the Predicted Valuation of the EVA Coated Film Market by 2033?

The market is predicted to exceed USD 390.6 million by 2033.

Which is the Most Profitable Region for the EVA Coated Film Industry?

The North America offers key opportunities for new entrants in the EVA coated film industry.

Explore Plastic Packaging Insights

Future Market Insights

EVA Coated Film Market