The global elevators and escalators market is projected to expand from USD 79.25 billion in 2025 to approximately USD 157.36 billion by 2035, registering a compound annual growth rate (CAGR) of 7.1%. As rapid urbanization, high-rise residential development, and infrastructure modernization continue across Asia-Pacific, the Middle East, and Latin America, demand for efficient vertical mobility solutions has grown significantly.
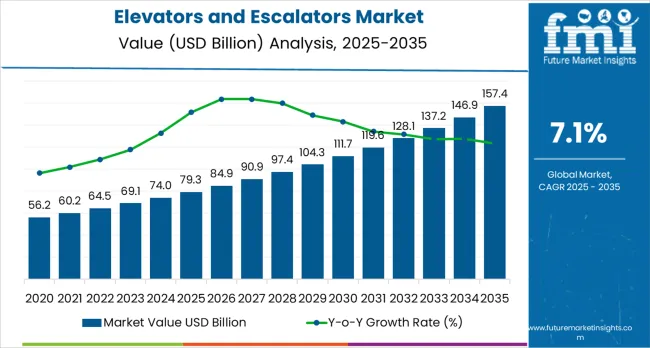
Urban infrastructure projects, smart city programs, and rising investments in commercial real estate are strengthening the adoption of elevators and escalators across transport terminals, hospitals, corporate complexes, and high-density urban settings.
The industry is transitioning towards smart elevators and escalators that integrate AI-based traffic optimization, IoT-enabled diagnostics, and energy-efficient drives. These innovations are enabling predictive maintenance, improving uptime, reducing energy use, and enhancing user safety.
Traction elevators, favored for their energy efficiency and suitability in tall structures, are gaining market share. Hydraulic elevators, while more common in mid- and low-rise buildings, continue to play an essential role due to their cost-effectiveness and ease of installation.
The rising global geriatric population, increasing demand for accessibility solutions, and focus on sustainable construction are further driving market momentum. Escalators are being increasingly installed in transit systems, shopping centers, and airports to handle growing foot traffic efficiently.
Key manufacturers like KONE Corporation, Otis Elevator Company, Schindler Group, TK Elevator, and Mitsubishi Electric are focusing on sustainable materials, regenerative drive systems, and contactless control technologies to meet modern building requirements.
The global trade of elevators and escalators is driven by the growing demand for urbanization, infrastructure development, and technological advancements in transportation. Exporting countries with established manufacturing facilities and engineering expertise lead the market, while importing nations rely on international suppliers to meet demand in urban development, commercial projects, and transportation systems.
Elevators and escalators are subject to rigorous safety, quality, and environmental regulations to ensure they meet operational standards and protect user safety. Regulatory frameworks vary by region, but they generally focus on aspects such as installation, maintenance, energy efficiency, and safety protocols. Compliance with these regulations is necessary for manufacturers, installers, and operators in the market.
The elevators and escalators market is experiencing significant growth, driven by the rising demand for vertical mobility solutions in urban areas. Traction elevators and the commercial sector are expected to dominate the market by 2025, supported by technological advancements and the growing need for energy-efficient solutions in high-rise buildings. As cities continue to expand, these segments will be crucial in meeting the vertical transportation demands of modern infrastructure.
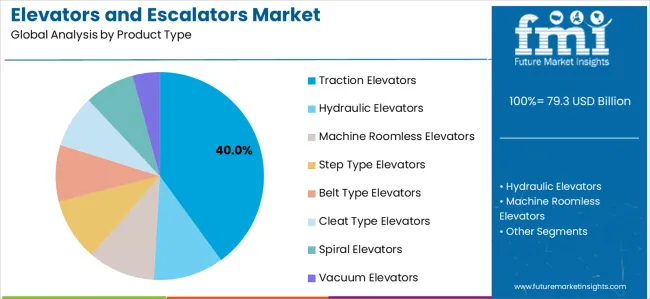
The traction elevator segment is projected to lead the market with a 40% share in 2024, thanks to its energy efficiency, high capacity, and advanced technology. Traction elevators use counterweights to minimize energy consumption, making them more sustainable compared to traditional hydraulic elevators. These systems are preferred for high-rise buildings, office complexes, and residential towers because they offer faster speeds, longer travel distances, and superior load capacities.
Traction elevators are also gaining popularity due to their integration with smart technologies such as IoT-based predictive maintenance and AI-driven traffic management. These innovations allow for real-time monitoring, efficient traffic flow, and reduced downtime. As demand for sustainable vertical mobility rises, especially in urban developments, traction elevators are becoming the go-to solution for modern infrastructure. Their ability to handle high traffic volumes while maintaining energy efficiency positions them as the most viable choice for future high-rise building projects.
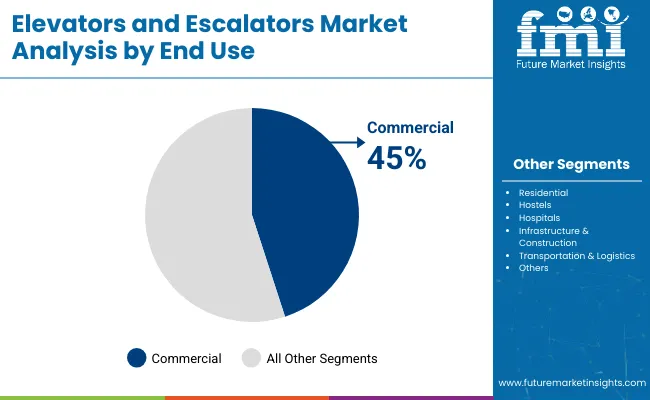
The commercial sector is expected to hold 45% of the market share in 2024, making it the largest end-user segment in the elevators and escalators market. Commercial spaces, including office buildings, corporate towers, shopping malls, and hotels, require high-speed, high-capacity vertical mobility solutions to ensure efficient transportation between floors. With the increasing number of commercial properties and rapid urbanization, demand for efficient elevator systems is increasing.
The commercial sector is increasingly adopting energy-efficient elevators equipped with AI-powered traffic management systems and IoT-based predictive maintenance to optimize performance, reduce downtime, and lower operational costs. Furthermore, the push for sustainable infrastructure and green building certifications is driving the adoption of eco-friendly elevators with advanced features such as regenerative braking and energy-saving systems. As the demand for efficient, reliable, and environmentally friendly vertical transportation solutions continues to rise, the commercial sector will remain a dominant force in shaping the future of the elevators and escalators market.
The elevators and escalators market are growing rapidly due to urbanization, infrastructure development, and technological advancements. Increasing demand for efficient vertical transportation in buildings drives growth, while challenges include high installation costs and supply chain disruptions. Opportunities lie in modernization projects and smart technology integration, fueling future growth.
Urbanization and infrastructure development driving demand for elevators and escalators
Urbanization is advancing at a rapid pace worldwide, leading to increased construction of high-rise residential, commercial, and public buildings. These developments require reliable and efficient vertical transportation solutions such as elevators and escalators to ensure smooth movement of people. Government investments in smart city initiatives and infrastructure projects are also bolstering demand. The need to optimize space in densely populated urban areas further emphasizes the importance of these systems. Additionally, increased focus on building safety, accessibility, and convenience is encouraging the adoption of advanced elevator and escalator technologies. The continuous growth in real estate and infrastructure sectors across emerging and developed economies is expected to sustain this demand, making elevators and escalators integral to modern urban development.
High installation costs and supply chain disruptions hindering market growth
Despite growing demand, high installation and maintenance costs remain significant barriers, especially in price-sensitive markets. Advanced features such as energy-efficient drives, smart controls, and safety mechanisms add to the overall cost. Supply chain challenges, including delays in raw material procurement, component shortages, and a lack of skilled labor, have disrupted project timelines and increased costs.
These disruptions have been aggravated by global economic uncertainties and logistics bottlenecks. Moreover, the complexity of installation in existing buildings or constrained urban spaces can delay deployment and increase expenses. To overcome these challenges, manufacturers and contractors must focus on optimizing supply chains, investing in workforce training, and developing modular and cost-effective solutions that improve accessibility and affordability in diverse markets.
Modernization projects and smart technology integration creating growth opportunities
The rising need to upgrade aging elevators and escalator systems is fueling market growth. Modernization enhances safety, energy efficiency, and user experience by incorporating cutting-edge technologies like IoT-based predictive maintenance, remote monitoring, and energy management systems.
Smart elevators with features such as touchless controls and AI-powered traffic management improve convenience and reduce downtime. Upgrading to eco-friendly components reduces carbon footprints, aligning with global sustainability goals. These modernization efforts extend the lifespan of existing equipment, reduce operational costs, and comply with updated safety regulations, attracting property owners and facility managers.
The increasing awareness of building codes and the demand for smart infrastructure will further boost the adoption of modernization projects and innovative vertical transportation technologies in residential, commercial, and public sectors worldwide.
Economic fluctuations and regulatory compliance impacting market stability
The elevators and escalators market is vulnerable to economic cycles, with recessions or slowdowns in construction activities reducing demand for new installations. Delays in infrastructure projects due to economic uncertainty can affect sales and profitability. Additionally, stringent safety, accessibility, and environmental regulations across different regions require manufacturers to continuously update their products to comply with evolving standards.
Compliance involves significant investments in research, testing, and certification, which can increase costs. Failure to meet regulatory requirements can result in legal penalties, recalls, or reputational damage. To maintain competitiveness, market players must proactively monitor regulatory changes and invest in innovative solutions that balance compliance with cost-efficiency. Navigating these economic and regulatory challenges is crucial for sustaining growth and market stability in the elevators and escalators industry.
The global elevator and escalator market is evolving rapidly as nations focus on vertical urbanization, sustainable infrastructure, and intelligent mobility systems. Countries such as the United States, United Kingdom, Germany, Japan, and India members are leading the way in deploying AI-powered elevators, regenerative escalators, and touchless lift systems to meet the needs of smart cities and high-rise living.
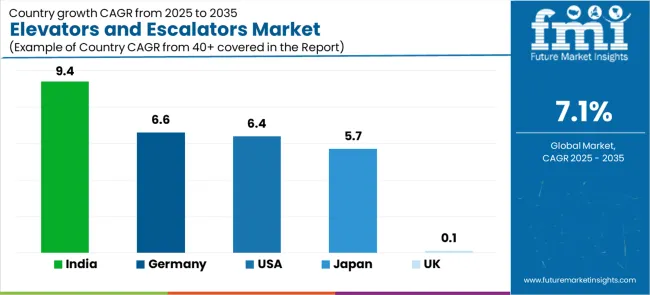
The elevator and escalator market in the United States is forecasted to grow at a CAGR of 6.4% from 2025 to 2035. The country’s aging infrastructure and rise in high-rise construction are fueling demand for modern vertical transportation systems. Cities like New York, Chicago, and San Francisco are upgrading elevators in commercial buildings, transit terminals, and multi-family housing complexes to align with energy efficiency and safety standards.
Federal infrastructure investments, particularly in transportation hubs, are increasing installations of high-speed elevators and heavy-duty escalators. Smart building certifications such as LEED and WELL are also contributing to the adoption of regenerative drive lifts and predictive maintenance-enabled systems.
Touchless control technologies, IoT-connected systems, and AI-based traffic management platforms are being deployed in premium commercial spaces to improve mobility efficiency and user experience. The hospitality and healthcare sectors are further adopting advanced elevators and escalators for accessibility and operational resilience.
Additionally, the booming data center and warehousing industries require high-capacity service lifts with enhanced reliability. With consumer demand shifting toward greener and safer mobility systems, USA manufacturers and developers are accelerating innovation in vertical transport technologies to meet regulatory and market expectations.
The United Kingdom’s elevator and escalator market is expected to register a CAGR of 11.0% between 2025 and 2035. Rapid vertical development in urban zones such as London, Birmingham, and Manchester is boosting demand for high-speed elevators and smart escalator systems.
These are being integrated into new residential towers, commercial buildings, and mixed-use projects to optimize vertical mobility and reduce congestion. Additionally, upgrades to rail stations, airports, and metro systems under public infrastructure programs are increasing installations of durable, AI-enabled escalators. The UK government’s push for smart and sustainable urban mobility further supports the deployment of energy-regenerative lift solutions.
Post-pandemic concerns have also triggered a shift toward contactless elevator systems with voice control and motion sensors for improved hygiene. In line with the UK’s carbon neutrality goals, developers are installing elevators that comply with BREEAM and EPC guidelines, using systems that recycle kinetic energy and reduce peak power loads.
Property management firms are leveraging IoT and cloud-connected monitoring tools for real-time diagnostics and predictive maintenance. As smart infrastructure becomes more widespread, the UK is emerging as a prime market for next-generation elevator and escalator solutions that balance energy efficiency, safety, and intelligent automation.
Germany is forecasted to grow its elevator and escalator market at a CAGR of 6.6% between 2025 and 2035. The country’s urban redevelopment initiatives, especially in Berlin, Frankfurt, and Hamburg, are stimulating adoption of advanced elevator technologies. Government investments in public transit terminals and airports have led to increasing demand for high-speed elevators and energy-efficient moving walkways.
Commercial office buildings and industrial parks are retrofitting outdated lift systems to meet stricter energy and accessibility regulations. Developers are increasingly using regenerative drive lifts and AI-powered elevator traffic controllers to reduce energy consumption and improve vertical flow efficiency.
Germany’s adherence to the Energy Performance of Buildings Directive (EPBD) and its commitment to climate targets are key drivers of innovation in elevator technology. Builders are prioritizing lift systems that support sustainability certifications like DGNB and Passivhaus.
IoT-enabled escalators with remote diagnostics and condition-based servicing are being installed to enhance uptime and reduce operating costs. With smart city initiatives expanding and demand for predictive maintenance growing, Germany is emerging as a vital European hub for eco-conscious and technologically advanced vertical mobility infrastructure.
Japan’s elevator and escalator market is projected to grow at a CAGR of 5.7% between 2025 and 2035. Tokyo, Osaka, and Yokohama continue to see vertical expansion in both residential and commercial real estate, fueling demand for high-speed and space-efficient elevator systems.
Public transit networks such as metro stations, bullet train terminals, and airport terminals are increasingly deploying intelligent escalators and elevators to handle growing passenger traffic. Japan’s construction industry, known for precision engineering, is adopting compact machine room-less elevators and dual-car lifts in skyscrapers to optimize vertical mobility.
Japan is a global leader in elevator technology innovation, with major manufacturers integrating AI-based traffic prediction, earthquake-resistant systems, and contactless controls into their product lines. Regulatory frameworks emphasize safety, energy efficiency, and disaster resilience, encouraging the use of regenerative braking systems and IoT-powered diagnostics.
Healthcare, hospitality, and education sectors are also transitioning to low-noise, smart lifts for operational efficiency. As the population ages, accessibility-focused elevator retrofits in residential buildings are on the rise. With its focus on smart cities and digital infrastructure, Japan remains at the forefront of vertical transport technology advancement.
India’s elevator and escalator market is projected to grow steadily at a CAGR of 9.4% from 2025 to 2035, driven by rapid urbanization and infrastructure expansion across Tier-1 and Tier-2 cities. The government’s Smart Cities Mission and Pradhan Mantri Awas Yojana (PMAY) have accelerated high-rise residential and commercial developments, particularly in cities like Mumbai, Delhi NCR, Bengaluru, and Pune.
These projects require high-speed elevators, energy-efficient escalators, and people movers to meet space optimization and population density needs. Additionally, metro rail expansions and airport modernization in over 20 cities are catalyzing demand for vertical transport systems in transit hubs.
The Indian real estate sector is also aligning with green building practices, increasing installations of regenerative elevators and intelligent escalator systems that reduce power consumption and carbon footprints. Real estate developers are prioritizing smart and contactless elevator systems for premium commercial buildings and healthcare centers, ensuring hygiene and operational efficiency.
IoT-based predictive maintenance and AI traffic management features are being introduced across high-rise buildings for better passenger flow. With both public and private investments accelerating infrastructure growth, India is becoming a key emerging market for advanced, scalable, and sustainable elevator and escalator technologies.
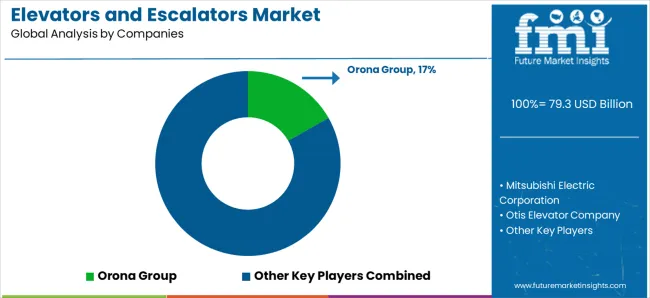
The elevators and escalators market are highly competitive, with key players ranging from large multinational corporations to regional manufacturers. Companies like Mitsubishi Electric Corporation, Otis Elevator Company, and Thyssenkrupp AG dominate the high-end segment, leveraging extensive research and development (R&D) capabilities to innovate on safety, energy efficiency, and advanced mobility systems.
These players often introduce product launches that focus on smart elevators, regenerative drive technologies, and touchless systems to meet evolving consumer demands. For example, Otis has integrated AI-powered systems in their elevators to enhance the user experience.
Regional players like Orona Group and Sigma Elevator Company are focused on strategic acquisitions to expand their market share and improve their production capabilities, often consolidating in emerging markets. The market remains fragmented, with barriers such as high capital investment in manufacturing and stringent regulatory standards acting as key entry points for new players.
Smaller companies, like Stannah Lifts and Schumacher Elevator, focus on niche segments, providing tailored solutions for residential and low-rise commercial buildings. Additionally, R&D investments remain a central strategy for all players to stay ahead in this ever-evolving industry.
The global elevators and escalators market has shown consistent growth from 2023 through 2025, fueled by rapid urbanization, aging infrastructure, and a growing focus on energy efficiency. Success in this space hinges on smart system integration, real-time predictive maintenance, and green technologies such as regenerative drives.
With sustainability regulations tightening across developed and emerging markets, elevator manufacturers are prioritizing modernization over new installations, aiming to extend the lifecycle of existing systems while reducing energy consumption. Demand from metro rail, airports, and high-rise buildings has particularly driven modernization and service-based models.
In 2024, Otis reported continued strength in modernization orders with growth exceeding 10% for eight consecutive quarters. This trend underscores the market’s pivot toward retrofit and digital upgrades. “Otis delivered solid quarterly performance led by the strength in our Service segment, which delivered portfolio growth of 4.2%, mid-single digit organic sales growth and 110 basis points of margin expansion.
Our overall performance delivered mid-teens EPS growth,” said Judy Marks, Chair, CEO, & President. “To drive growth, we continue to execute on our modernization strategy, with orders growth above 10% for the eighth consecutive quarter and backlog up mid-teens. Based on this performance, and with confidence in our Service-driven, customer-centric strategy, we are raising our EPS outlook.” Such performance reflects the sector’s focus on recurring revenue and sustainability.
| Report Attributes | Details |
|---|---|
| Market Size (2020) | USD 56.90 billion |
| Market Size (2025) | USD 79.25 billion |
| Projected Market Size (2035) | USD 157.36 billion |
| CAGR (2025 to 2035) | 7.1% |
| Y-o-Y Growth (2025) | 6.2% |
| Base Year for Estimation | 2024 |
| Historical Period | 2020 to 2024 |
| Projections Period | 2025 to 2035 |
| Quantitative Units | USD billion for value and thousand units for volume |
| Product Types Analyzed (Segment 1) | Hydraulic Elevators, Traction Elevators, Machine Elevators, Room Less Elevators, Step Type Elevators, Belt Type Elevators, Cleat Type Elevators, Spiral Elevators, Vacuums |
| Load Types Analyzed (Segment 2) | Passenger, Freight, Observation |
| Installation Types Analyzed (Segment 3) | New System & Installation, Retrofit |
| End Uses Analyzed (Segment 4) | Residential, Commercial, Hostels, Hospitals, Infrastructure & Construction, Transportation & Logistics |
| Regions Covered | North America; Latin America; Western Europe; Eastern Europe; South Asia and Pacific; East Asia; Middle East & Africa |
| Countries Covered | United States, Canada, Mexico, Brazil, Argentina, Germany, France, United Kingdom, Italy, Spain, Netherlands, China, India, Japan, South Korea, ANZ, GCC Countries, South Africa |
| Key Players influencing the Elevators and Escalators Market | Mitsubishi Electric Corporation, Orona Group, Otis Elevator Company, Sanyo Elevator (Zhuhai) Co. Ltd., Schindler Holding Ltd., Schumacher Elevator Company, Sigma Elevator Company, Stannah Lifts Holdings Ltd., Thyssenkrupp AG, Toshiba Corporation, Hitachi Ltd., Hyundai Elevator Co. Ltd. |
| Additional Attributes | Dollar sales by elevator type (traction, hydraulic, machine room-less), Market share by installation (new vs retrofit), Usage trends in high-rise residential and commercial buildings, Impact of urbanization and infrastructure growth, Smart elevators and integration of IoT for predictive maintenance, Regional development of transport and vertical mobility systems |
The elevators and escalators market is categorized based on product types, which include Hydraulic Elevators, suitable for low-rise buildings; Traction Elevators, ideal for high-rise constructions; Machine Roomless Elevators, designed for space efficiency; Step Type Elevators, typically used in specialized settings; Belt Type Elevators for light-duty applications; Cleat Type Elevators for bulk material handling; Spiral Elevators, which allow for vertical transportation in confined spaces; and Vacuum Elevators, known for their smooth and quiet operation.
The market is also divided by load types, including Passenger Elevators, used for human transportation; Freight Elevators, designed for moving heavy goods; and Observation Elevators, which offer scenic views and are commonly found in skyscrapers or tourist attractions.
Elevators and escalators are further segmented by installation type, which includes New Systems & Installations for new constructions and Retrofit options for upgrading or replacing existing systems in older buildings.
The market is categorized based on end-use sectors, such as Residential, Commercial, Hostels, Hospitals, Infrastructure & Construction, and Transportation & Logistics, each catering to specific vertical transportation needs.
Geographically, the elevators and escalators market is divided into regions including North America, Latin America, Eastern Europe, Western Europe, East Asia, South Asia & Pacific, and Middle East and Africa.
The global industry is projected to grow from USD 79.25 billion in 2025 to approximately USD 157.36 billion by 2035, expanding at a CAGR of 7.1%.
Traction elevators lead the market with a 40% share due to their energy efficiency, suitability for high-rise buildings, and compatibility with smart technologies.
Rapid urbanization, infrastructure development, high-rise construction, and the growing need for energy-efficient and smart vertical mobility systems are key drivers.
The commercial sector dominates with a projected 45% share in 2024, driven by increasing demand from office buildings, hotels, shopping malls, and airports.
Smart elevators and escalators integrated with AI traffic optimization, IoT-based predictive maintenance, regenerative braking, and touchless control features are redefining performance, safety, and sustainability standards.


Our Research Products

The "Full Research Suite" delivers actionable market intel, deep dives on markets or technologies, so clients act faster, cut risk, and unlock growth.

The Leaderboard benchmarks and ranks top vendors, classifying them as Established Leaders, Leading Challengers, or Disruptors & Challengers.

Locates where complements amplify value and substitutes erode it, forecasting net impact by horizon

We deliver granular, decision-grade intel: market sizing, 5-year forecasts, pricing, adoption, usage, revenue, and operational KPIs—plus competitor tracking, regulation, and value chains—across 60 countries broadly.

Spot the shifts before they hit your P&L. We track inflection points, adoption curves, pricing moves, and ecosystem plays to show where demand is heading, why it is changing, and what to do next across high-growth markets and disruptive tech

Real-time reads of user behavior. We track shifting priorities, perceptions of today’s and next-gen services, and provider experience, then pace how fast tech moves from trial to adoption, blending buyer, consumer, and channel inputs with social signals (#WhySwitch, #UX).

Partner with our analyst team to build a custom report designed around your business priorities. From analysing market trends to assessing competitors or crafting bespoke datasets, we tailor insights to your needs.
Supplier Intelligence
Discovery & Profiling
Capacity & Footprint
Performance & Risk
Compliance & Governance
Commercial Readiness
Who Supplies Whom
Scorecards & Shortlists
Playbooks & Docs
Category Intelligence
Definition & Scope
Demand & Use Cases
Cost Drivers
Market Structure
Supply Chain Map
Trade & Policy
Operating Norms
Deliverables
Buyer Intelligence
Account Basics
Spend & Scope
Procurement Model
Vendor Requirements
Terms & Policies
Entry Strategy
Pain Points & Triggers
Outputs
Pricing Analysis
Benchmarks
Trends
Should-Cost
Indexation
Landed Cost
Commercial Terms
Deliverables
Brand Analysis
Positioning & Value Prop
Share & Presence
Customer Evidence
Go-to-Market
Digital & Reputation
Compliance & Trust
KPIs & Gaps
Outputs
Full Research Suite comprises of:
Market outlook & trends analysis
Interviews & case studies
Strategic recommendations
Vendor profiles & capabilities analysis
5-year forecasts
8 regions and 60+ country-level data splits
Market segment data splits
12 months of continuous data updates
DELIVERED AS:
PDF EXCEL ONLINE
Marine Elevators Market Growth - Trends & Forecast 2025 to 2035
Industrial Elevators Market Size and Share Forecast Outlook 2025 to 2035
Food Bucket Elevators Market
Android Automotive OS (AAOS) Market Size and Share Forecast Outlook 2025 to 2035
Anderson Cascade Impactor Market Size and Share Forecast Outlook 2025 to 2035
Andersen-Tawil Syndrome Treatment Market Trends - Growth & Future Prospects 2025 to 2035
Andro Supplements Market
Candle Filter Cartridges Market Size and Share Forecast Outlook 2025 to 2035
Handheld Electrostatic Meter Market Size and Share Forecast Outlook 2025 to 2035
Hand Towel Automatic Folding Machine Market Size and Share Forecast Outlook 2025 to 2035
Handheld Ultrasound Scanner Market Size and Share Forecast Outlook 2025 to 2035
Handheld Tagging Gun Market Forecast and Outlook 2025 to 2035
Handheld Imaging Systems Market Size and Share Forecast Outlook 2025 to 2035
Sandwich Panel System Market Size and Share Forecast Outlook 2025 to 2035
Hand Tools Market Size and Share Forecast Outlook 2025 to 2035
Land Survey Equipment Market Size and Share Forecast Outlook 2025 to 2035
Handloom Product Market Size and Share Forecast Outlook 2025 to 2035
Band File Sander Belts Market Size and Share Forecast Outlook 2025 to 2035
Handheld XRF Analyzers Market Size and Share Forecast Outlook 2025 to 2035
Sand Abrasion Tester Market Size and Share Forecast Outlook 2025 to 2035

Thank you!
You will receive an email from our Business Development Manager. Please be sure to check your SPAM/JUNK folder too.
Chat With
MaRIA