Candle Air Fresheners Market Size and Share Forecast Outlook (2022 to 2032)

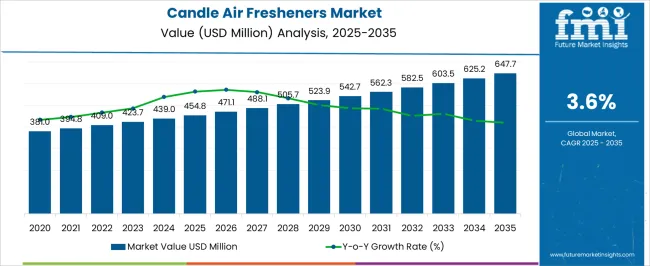
In 2022, the global candle air fresheners market is anticipated to reach a valuation of USD 423.7 Million. The market is expected to grow at a slow CAGR of 3.6% from 2022 to 2032, according to new data from Future Market Insights. The sector is predicted to be worth USD 602.8 Million by 2032.

The term candle air freshener refers to an aerosol spray that is commonly used to eliminate odors, offer aroma, and freshen the air in workplaces, residences, and other business settings. They come in a range of scents, and this variety is leading to room fresheners or candle air fresheners becoming increasingly popular.

The popularity of candle air fresheners is growing due to multiple other factors as well. For starters, across residential and commercial spaces, people are increasingly using candle air fresheners to make the spaces feel fresh. Growing pollution levels due to increasing industrialization and rapid urbanization around the world are also leading to unpleasant smells and odors in indoor spaces. Using candle air fresheners can be effective in removing these smells and odors.

Additionally, candle air freshener manufacturers are refining their packaging, which is leading to more visually appealing products. This is encouraging greater sales. Manufacturers are also providing a great degree of variety to consumers. Candle air fresheners are available in a diverse array of fragrances and consumers have the opportunity to purchase products based on personal preferences.

Last but not least, disposable incomes across the UK, the USA, Korea, and Japan have been on the rise and are expected to increase during the forecast period. This is anticipated to give people living in these countries more purchasing power to buy candle air fresheners. Nowadays, candle air freshener sales are rapidly boosting due to the presence of several online platforms that are selling products from multiple manufacturers. During the forecast period, these platforms are set to generate the majority of candle air freshener sales.

Attribute Key Insights
Estimated Candle Air Freshener Market Value (2022) ~USD 423.7 Million
Projected Market Size (2032) ~USD 602.8 Million
Value-based CAGR (2022 to 2032) ~3.6%
Top Players Share in 2021 ~5%-10%

Comparison of 2017 to 2021 Sales vs 2022 to 2032 Demand Forecast for Candle Air Fresheners

Candle air fresheners do not remove pollution. Instead, they add fresh odors or fragrances that are strong enough to cover foul odors. Air fresheners can be used both indoors and outdoors.

They are made up of a complex blend of chemicals, including synthetic scents, which are among the leading causes of allergic reactions in people. Consumer products such as candle air fresheners are utilized in homes, offices, hotels, and other public places. The primary goal of using a candle air freshener is to add a pleasant scent to the environment and disguise unwanted odors. However, this benefit comes at the cost of exposure to a cocktail of chemicals released into the environment by candle air fresheners.

Rising concern about indoor air quality, combined with the growing relevance of a fresh and clean environment, is driving the global candle air freshener market. Product developments, improving lifestyles, rising population, expanding importance of aromatherapy, growing consumer disposable incomes, and improved living standards are all expected to drive the candle air freshener market forward. However, the presence of poisonous chemicals that are harmful to one's health may limit market expansion.

Companies are focusing on developing and manufacturing air fresheners using natural components such as lemons and flowers due to changing consumer preferences. Improved products to manage room odors are arising from advancements in packaging and dispersing technologies.

Candle air freshener sales are predicted to rise because of the widespread availability of a variety of product categories with appealing features. The expanding use of air freshening products such as candle air fresheners witnessed a market growth of ~2.7% between 2017 and 2021.

Key Trends Driving Sales of Candle Air Freshener Products

Innovative Advertising and Marketing Campaigns to Drive Candle Air Freshener Sales

In the coming years, the worldwide candle air fresheners market is predicted to rise at a rapid pace. The rising global demand for a variety of aromatic products is a major element driving the candle air fresheners market forward. Other factors, such as the increasing importance and popularity of aromatherapy, as well as the development of new products and fragrances, are expected to drive the global market's growth in the coming years.

Key companies' increased attention to marketing activities and advertising campaigns is likely to boost market growth during the forecast period. Furthermore, the worldwide candle air fresheners market is likely to be fueled in the coming years by the simple availability of products due to the expansion of distribution methods around the world.

On the negative side, the high cost of production is expected to stifle widespread adoption, posing a major challenge for the global candle air freshener market. Aside from that, the growing demand for high-end lifestyles and luxury in everyday life creates a profitable possibility for the widespread usage of candle air fresheners.

Analysis of Top Countries Contributing to Candle Air Fresheners Production and Consumption

Why is the Demand for Candle Air Fresheners Increasing in the USA?

High Standard of Living in the USA to Propel Candle Air Freshener Demand

In the USA, the demand for air care is increasing every day, as the residing population is worried about indoor air quality. As a result, individuals are more concerned about its impact on their health. The candle air freshener market in the USA is likely to experience high consumer demand and increase at a substantial rate throughout the forecast period.

According to FMI, all of these factors are helping to drive candle air freshener sales in the USA, which are predicted to reach USD 97.7 Million by 2032.

Why is the Demand for Candle Air Fresheners Increasing in China?

Need for Product Modification and Customized Scent to Increase Candle Air Fresheners Sales

One of the important trends projected to promote healthy growth in this market is widespread customer awareness of the available products. To fulfill client tastes in this market, manufacturers are experimenting with perfumes in previously unheard-of ways, and consumers in this region have embraced this trend.

Candle air freshener manufacturers are diversifying their product lines in response to consumers' willingness to spend a premium price for aesthetic scents, leading to revenue growth in this region. According to Future Market Insights (FMI), the CAGR is set to be 3.6 %.

How is the Candle Air Fresheners Market Faring in India?

Preferences are shifting, and brands are expanding their market share by launching new products

In the Indian automotive air freshener industry, shifting preferences are an ongoing issue. Due to growing regulatory scrutiny of air fresheners, considerable variations in climatic settings, and highly individualized preferences, manufacturers are finding it next to impossible to predict consumer preferences. Many consumers, on the other hand, like to use the same air fresheners at their offices as they do at home. As a result, brands rely on surveys, online reviews, and customer feedback to forecast specific purchasing patterns.

Manufacturers are focusing on new natural smell compositions that help improve product quality, resulting in increased promotions to gain consumer loyalty. As a result, the candle air freshener industry in India is witnessing an increase in the sale of air fresheners as gifts. During the forecast period, the products’ critical applications and appealing characteristics are projected to fuel healthy growth for market participants.

Candle Air Fresheners Industry Analysis by Top Investment Segments

In Which Purpose Candle Air Fresheners used the Most?

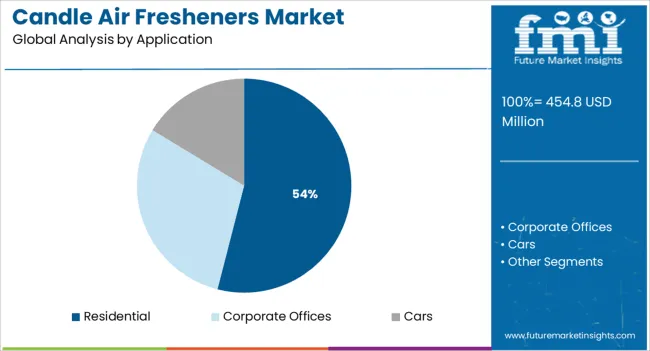
Over 3/5th of Candle Air Freshener Demand to be Contributed by Residential Segment

The residential segment of the candle air freshener industry is the largest and fastest-growing with a current market share of ~65%. This figure represents an increasing trend among customers who are realizing that having a pleasant-smelling home is important all year, not only for special occasions and holiday gatherings. According to research, one out of every ten customers had a candle air freshener product in their shopping cart.

This is mainly due to favorable demographics and a global hygiene trend. The segment, on the other hand, is expected to increase at a CAGR of 3.4% over the projection period. Rising disposable income and a growing willingness among customers to spend on high-end goods are factors driving the segment

Which Type of Candle Air Freshener Will Remain Top Selling?

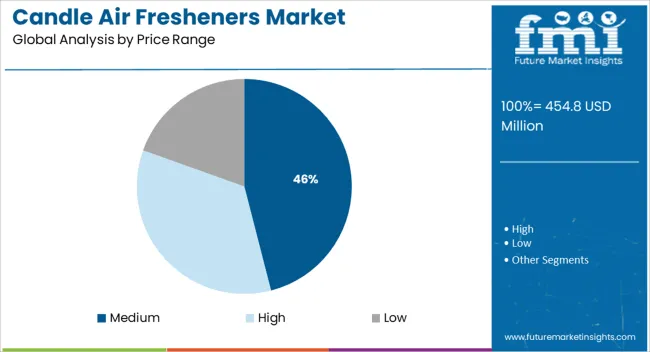
Medium Price Range Products Are More Popular Among Millennials

A mid-price strategy aims to find a balance between a strong reputation and competitive pricing. The idea is to appeal to the mass market and thus gain greater penetration, rather than targeting clients who want to spend a lot of money on products with premium pricing.

The products are not purchased by low-income groups since they are not considered necessities. As a result, low product pricing is not a consideration for players as it may not generate more demand. The category is expected to grow at a CAGR of 3.7% over the forecast period due to the aforementioned factors.

Which is the Preferred Sales Channel for Candle Air Fresheners?

Emergence Of Modern Trade To Aid The Market Growth

Hypermarkets/supermarkets are expected to contribute significant market revenue, and this trend is projected to continue in the next years. In 2021, hypermarkets/supermarkets had around 23% of the market share in the candle air fresheners market.

Customers may choose to purchase a product after experiencing it or trying it on, reducing the risk of unhappiness. Because they can grasp goods in their hands and smell their aroma, consumers can rapidly assess product quality and provide feedback in retail locations.

Leading Suppliers in the Candle Air Fresheners Industry

The primary strategies adopted by players in the candle air freshener market are product innovations, expansions, and mergers and acquisitions. Sustained competitive advantage through innovation is the key requirement for large enterprises' market share growth around the world.

To preserve their market position, companies are increasing their Research and Development and marketing activities, as well as expanding their distribution channels.

  • For Instance, in 2021, Yankee Candles revealed a modern design with the launch of a signature collection of exclusive fragrances: The sleek, new vessels, available in several sizes, offer gorgeous designs and a wide choice of fragrance options to help create everyday moments that are worth savoring.

Key Highlights from the Candle Air Fresheners Industry Report

Attribute Details
Estimated Market Value (2022) ~USD 423.7 Million
Projected Market Size (2032) ~USD 602.8 Million
Value-based CAGR (2022 to 2032) ~3.6%
Forecast Period 2022 to 2032
Historical Data Available for 2017 to 2021
Market Analysis USD Million for Value
Key Regions Covered North America; Latin America; Europe; East Asia; South Asia; Oceania & MEA
Key Countries Covered United States of America, Canada, Brazil, Mexico, Germany, UK, France, Spain, Italy, Russia, Benelux, South Africa, Northern Africa GCC Countries, China, Japan, South Korea, India, Thailand, Malaysia, Indonesia, Australia & New Zealand
Key Segments Covered Customer Type, Application, Sales Channel, and Region
Key Companies Profiled Church & Dwight, Inc.; Farcent Enterprise Co. Ltd.; Godrej Consumer Products Limited; Henkel AG & Co. KGaA; Kobayashi Pharmaceutical Co. Ltd.; Newell Brands; Procter & Gamble; Reckitt Benckiser Group plc.; S. C. Johnson & Son, Inc.; Yankee Candles; Others
Report Coverage Market Forecast, Company Share Analysis, Competition Intelligence, Drivers, Restraints, Opportunities and Threats Analysis, Market Dynamics and Challenges, and Strategic Growth Initiatives

Outlook by Category in the Candle Air Fresheners Industry

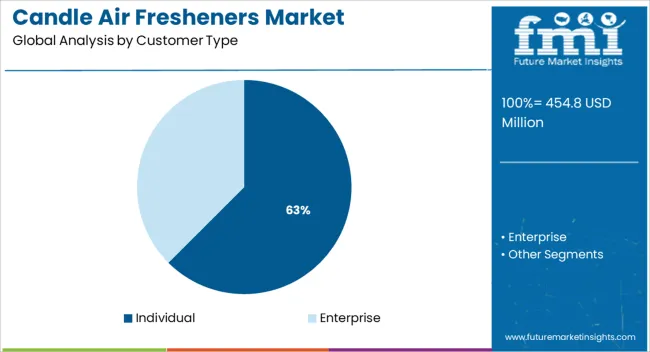
By Customer Type:

  • Individual
  • Enterprise

By Application:

  • Corporate offices
  • Residential
  • Cars

By Price Range:

  • High
  • Medium
  • Low

By Sales Channel:

  • Hypermarkets/ Supermarkets
  • Convenience Stores
  • Modern trade
  • Multi-brand stores
  • Online Retailers
  • Specialty stores
  • Other Sales Channel

By Region:

  • North America
  • Latin America
  • Europe
  • East Asia
  • South Asia
  • Oceania
  • Middle East and Africa (MEA)

Table of Content

  • 1. Executive Summary | Candle Air Fresheners Market
  • 2. Market Overview
  • 3. Key Market Trends
  • 4. Global Market Demand Analysis 2017 to 2021 and Forecast, 2022 to 2032
  • 5. Global Market - Pricing Analysis
  • 6. Global Market Demand (in Value or Size in USD Million) Analysis 2017 to 2021 and Forecast, 2022 to 2032
  • 7. Market Background
  • 8. Global Market Analysis 2017 to 2021 and Forecast 2022 to 2032, by Customer Type
    • 8.1. Individual
    • 8.2. Enterprise
  • 9. Global Market Analysis 2017 to 2021 and Forecast 2022 to 2032, by Application
    • 9.1. Corporate Offices
    • 9.2. Residential
    • 9.3. Cars
  • 10. Global Market Analysis 2017 to 2021 and Forecast 2022 to 2032, by Price Range
    • 10.1. High
    • 10.2. Medium
    • 10.3. Low
  • 11. Global Market Analysis 2017 to 2021 and Forecast 2022 to 2032, by Sales Channel
    • 11.1. Hypermarkets/ Supermarkets
    • 11.2. Convenience Stores
    • 11.3. Multi-brand Stores
    • 11.4. Online Retailers
    • 11.5. Specialty Stores
    • 11.6. Other Sales Channel
  • 12. Global Market Analysis 2017 to 2021 and Forecast 2022 to 2032, by Region
    • 12.1. North America
    • 12.2. Europe
    • 12.3. Middle East and Africa (MEA)
    • 12.4. East Asia
    • 12.5. South Asia
    • 12.6. Oceania
    • 12.7. Latin America
  • 13. North America Market Analysis 2017 to 2021 and Forecast 2022 to 2032
  • 14. Latin America Market Analysis 2017 to 2021 and Forecast 2022 to 2032
  • 15. Europe Market Analysis 2017 to 2021 and Forecast 2022 to 2032
  • 16. East Asia Market Analysis 2017 to 2021 and Forecast 2022 to 2032
  • 17. South Asia Market Analysis 2017 to 2021 and Forecast 2022 to 2032
  • 18. Oceania Market Analysis 2017 to 2021 and Forecast 2022 to 2032
  • 19. Middle East and Africa Market Analysis 2017 to 2021 and Forecast 2022 to 2032
  • 20. Market Structure Analysis
  • 21. Competition Analysis
    • 21.1. Church & Dwight, Inc.
    • 21.2. Farcent Enterprise Co. Ltd.
    • 21.3. Godrej Consumer Products Limited
    • 21.4. Henkel AG & Co. KGaA
    • 21.5. Kobayashi Pharmaceutical Co. Ltd.
    • 21.6. Newell Brands
    • 21.7. Procter & Gamble
    • 21.8. Reckitt Benckiser Group plc.
    • 21.9. S. C. Johnson & Son, Inc.
    • 21.10. Yankee Candles
    • 21.11. Other Players (as per request)
  • 22. Assumptions and Acronyms Used
  • 23. Research Methodology

List of Tables

Table 1: Global Market Value (US$ Million) Forecast, By Customer type, 2017 to 2032

Table 2: Global Market Volume (Units) Forecast, By Customer type, 2017 to 2032

Table 3: Global Market Value (US$ Million) Forecast, By Application, 2017 to 2032

Table 4: Global Market Volume (Units) Forecast, By Application, 2017 to 2032

Table 5: Global Market Value (US$ Million) Forecast, By Price Range, 2017 to 2032

Table 6: Global Market Volume (Units) Forecast, By Price Range, 2017 to 2032

Table 5: Global Market Value (US$ Million) Forecast, By Sales Channel, 2017 to 2032

Table 6: Global Market Volume (Units) Forecast, By Sales Channel, 2017 to 2032

Table 7: Global Market Value (US$ Million) Forecast, By Region, 2017 to 2032

Table 8: Global Market Volume (Units) Forecast, By Region, 2017 to 2032

Table 9: North America Market Value (US$ Million) Forecast, By Country, 2017 to 2032

Table 10: North America Market Volume (Units) Forecast, By Country, 2017 to 2032

Table 11: North America Market Value (US$ Million) Forecast, By Customer type, 2017 to 2032

Table 12: North America Market Volume (Units) Forecast, By Customer type, 2017 to 2032

Table 13: North America Market Value (US$ Million) Forecast, By Application, 2017 to 2032

Table 14: North America Market Volume (Units) Forecast, By Application, 2017 to 2032

Table 15: North America Market Value (US$ Million) Forecast, By Price Range, 2017 to 2032

Table 16: North America Market Volume (Units) Forecast, By Price Range, 2017 to 2032

Table 17: North America Market Value (US$ Million) Forecast, By Sales Channel, 2017 to 2032

Table 18: North America Market Volume (Units) Forecast, By Sales Channel, 2017 to 2032

Table 19: Latin America Market Value (US$ Million) Forecast, By Country, 2017 to 2032

Table 20: Latin America Market Volume (Units) Forecast, By Country, 2017 to 2032

Table 21: Latin America Market Value (US$ Million) Forecast, By Customer type, 2017 to 2032

Table 22: Latin America Market Volume (Units) Forecast, By Customer type, 2017 to 2032

Table 23: Latin America Market Value (US$ Million) Forecast, By Application, 2017 to 2032

Table 24: Latin America Market Volume (Units) Forecast, By Application, 2017 to 2032

Table 25: Latin America Market Value (US$ Million) Forecast, By Price Range, 2017 to 2032

Table 26: Latin America Market Volume (Units) Forecast, By Price Range, 2017 to 2032

Table 27: Latin America Market Value (US$ Million) Forecast, By Sales Channel, 2017 to 2032

Table 28: Latin America Market Volume (Units) Forecast, By Sales Channel, 2017 to 2032

Table 29: Europe Market Value (US$ Million) Forecast, By Country, 2017 to 2032

Table 30: Europe Market Volume (Units) Forecast, By Country, 2017 to 2032

Table 31: Europe Market Value (US$ Million) Forecast, By Customer type, 2017 to 2032

Table 32: Europe Market Volume (Units) Forecast, By Customer type, 2017 to 2032

Table 33: Europe Market Value (US$ Million) Forecast, By Application, 2017 to 2032

Table 34: Europe Market Volume (Units) Forecast, By Application, 2017 to 2032

Table 35: Europe Market Value (US$ Million) Forecast, By Price Range, 2017 to 2032

Table 36: Europe Market Volume (Units) Forecast, By Price Range, 2017 to 2032

Table 37: Europe Market Value (US$ Million) Forecast, By Sales Channel, 2017 to 2032

Table 38: Europe Market Volume (Units) Forecast, By Sales Channel, 2017 to 2032

Table 39: East Asia Market Value (US$ Million) Forecast, By Country, 2017 to 2032

Table 40: East Asia Market Volume (Units) Forecast, By Country, 2017 to 2032

Table 41: East Asia Market Value (US$ Million) Forecast, By Customer type, 2017 to 2032

Table 42: East Asia Market Volume (Units) Forecast, By Customer type, 2017 to 2032

Table 43: East Asia Market Value (US$ Million) Forecast, By Application, 2017 to 2032

Table 44: East Asia Market Volume (Units) Forecast, By Application, 2017 to 2032

Table 45: East Asia Market Value (US$ Million) Forecast, By Price Range, 2017 to 2032

Table 46: East Asia Market Volume (Units) Forecast, By Price Range, 2017 to 2032

Table 47: East Asia Market Value (US$ Million) Forecast, By Sales Channel, 2017 to 2032

Table 48: East Asia Market Volume (Units) Forecast, By Sales Channel, 2017 to 2032

Table 49: South Asia Market Value (US$ Million) Forecast, By Country, 2017 to 2032

Table 50: South Asia Market Volume (Units) Forecast, By Country, 2017 to 2032

Table 51: South Asia Market Value (US$ Million) Forecast, By Customer type, 2017 to 2032

Table 52: South Asia Market Volume (Units) Forecast, By Customer type, 2017 to 2032

Table 53: South Asia Market Value (US$ Million) Forecast, By Application, 2017 to 2032

Table 54: South Asia Market Volume (Units) Forecast, By Application, 2017 to 2032

Table 55: South Asia Market Value (US$ Million) Forecast, By Price Range, 2017 to 2032

Table 56: South Asia Market Volume (Units) Forecast, By Price Range, 2017 to 2032

Table 57: South Asia Market Value (US$ Million) Forecast, By Sales Channel, 2017 to 2032

Table 58: South Asia Market Volume (Units) Forecast, By Sales Channel, 2017 to 2032

Table 59: Oceania Market Value (US$ Million) Forecast, By Country, 2017 to 2032

Table 60: Oceania Market Volume (Units) Forecast, By Country, 2017 to 2032

Table 61: Oceania Market Value (US$ Million) Forecast, By Customer type, 2017 to 2032

Table 62: Oceania Market Volume (Units) Forecast, By Customer type, 2017 to 2032

Table 63: Oceania Market Value (US$ Million) Forecast, By Application, 2017 to 2032

Table 64: Oceania Market Volume (Units) Forecast, By Application, 2017 to 2032

Table 65: Oceania Market Value (US$ Million) Forecast, By Price Range, 2017 to 2032

Table 66: Oceania Market Volume (Units) Forecast, By Price Range, 2017 to 2032

Table 67: Oceania Market Value (US$ Million) Forecast, By Sales Channel, 2017 to 2032

Table 68: Oceania Market Volume (Units) Forecast, By Sales Channel, 2017 to 2032

Table 69: MEA Market Value (US$ Million) Forecast, By Country, 2017 to 2032

Table 70: MEA Market Volume (Units) Forecast, By Country, 2017 to 2032

Table 71: MEA Market Value (US$ Million) Forecast, By Customer type, 2017 to 2032

Table 72: MEA Market Volume (Units) Forecast, By Customer type, 2017 to 2032

Table 73: MEA Market Value (US$ Million) Forecast, By Application, 2017 to 2032

Table 74: MEA Market Volume (Units) Forecast, By Application, 2017 to 2032

Table 75: MEA Market Value (US$ Million) Forecast, By Price Range, 2017 to 2032

Table 76: MEA Market Volume (Units) Forecast, By Price Range, 2017 to 2032

Table 77: MEA Market Value (US$ Million) Forecast, By Sales Channel, 2017 to 2032

Table 78: MEA Market Volume (Units) Forecast, By Sales Channel, 2017 to 2032

List of Figures

Figure 01: Global Market Value (US$ Million) and Volume (Units) Analysis, 2017 to 2032
         
Figure 02: Global Market Value (US$ Million) and Volume (Units) Forecast 2022 to 2032
         
Figure 03: Global Market Value (US$ Million) and Volume (Units), 2017 to 2032
         
Figure 04: Global Market Absolute $ Opportunity (US$ Million) 2022 to 2032
         
Figure 05: Global Market Value (US$ Million) and Volume (Units) Forecast 2022 to 2032
         
Figure 06: Global Market Value (US$ Million) Analysis By Customer type, 2017 to 2032
         
Figure 07: Global Market Volume (Units) Analysis By Customer type, 2017 to 2032
         
Figure 08: Global Market Y-o-Y Growth (%) Projections, By Customer type, 2022 to 2032
         
Figure 09: Global Market Attractiveness By Customer type, 2022 to 2032
         
Figure 10: Global Market Value (US$ Million) Analysis by Application, 2017 to 2032
         
Figure 11: Global Market Volume (Units) Analysis by Application, 2017 to 2032
         
Figure 12 Global Market Y-o-Y Growth (%) Projections, By Application, 2022 to 2032
         
Figure 13: Global Market Attractiveness by Application, 2022 to 2032
         
Figure 14: Global Market Value (US$ Million) Analysis by Price Range, 2017 to 2032
         
Figure 15: Global Market Volume (Units) Analysis by Price Range, 2017 to 2032
         
Figure 16 Global Market Y-o-Y Growth (%) Projections, By Price Range, 2022 to 2032
         
Figure 17: Global Market Attractiveness by Price Range, 2022 to 2032
         
Figure 18: Global Market Value (US$ Million) Analysis by Sales Channel, 2017 to 2032
         
Figure 19: Global Market Volume (Units) Analysis by Sales Channel, 2017 to 2032
         
Figure 20: Global Market Y-o-Y Growth (%) Projections, By Sales Channel, 2022 to 2032
         
Figure 21: Global Market Attractiveness by Sales Channel, 2022 to 2032
         
Figure 22: Global Market Value (US$ Million) Analysis by Region, 2017 to 2032
         
Figure 23: Global Market Volume (Units) Analysis by Region, 2017 to 2032
         
Figure 24 Global Market Y-o-Y Growth (%) Projections, By Region, 2022 to 2032
         
Figure 25: Global Market Attractiveness by Region, 2022 to 2032
         
Figure 26: North America Market Value (US$ Million) Analysis by Country, 2017 to 2032
         
Figure 27: North America Market Volume (Units) Analysis by Country, 2017 to 2032
         
Figure 28 North America Market Y-o-Y Growth (%) Projections, By Country, 2022 to 2032
         
Figure 29: North America Market Attractiveness by Country, 2022 to 2032
         
Figure 30: North America Market Value (US$ Million) Analysis By Customer type, 2017 to 2032
         
Figure 31: North America Market Volume (Units) Analysis By Customer type, 2017 to 2032
         
Figure 32: North America Market Y-o-Y Growth (%) Projections, By Customer type, 2022 to 2032
         
Figure 33: North America Market Attractiveness By Customer type, 2022 to 2032
         
Figure 34: North America Market Value (US$ Million) Analysis by Application, 2017 to 2032
         
Figure 35: North America Market Volume (Units) Analysis by Application, 2017 to 2032
         
Figure 36: North America Market Y-o-Y Growth (%) Projections, By Application, 2022 to 2032
         
Figure 37: North America Market Attractiveness by Application, 2022 to 2032
         
Figure 38: North America Market Value (US$ Million) Analysis by Price Range, 2017 to 2032
         
Figure 39: North America Market Volume (Units) Analysis by Price Range, 2017 to 2032
         
Figure 40: North America Market Y-o-Y Growth (%) Projections, By Price Range, 2022 to 2032
         
Figure 41: North America Market Attractiveness by Price Range, 2022 to 2032
         
Figure 42: North America Market Value (US$ Million) Analysis by Sales Channel, 2017 to 2032
         
Figure 43: North America Market Volume (Units) Analysis by Sales Channel, 2017 to 2032
         
Figure 44: North America Market Y-o-Y Growth (%) Projections, By Sales Channel, 2022 to 2032
         
Figure 45: North America Market Attractiveness by Sales Channel, 2022 to 2032
         
Figure 46: Latin America Market Value (US$ Million) Analysis by Country, 2017 to 2032
         
Figure 47: Latin America Market Volume (Units) Analysis by Country, 2017 to 2032
         
Figure 48: Latin America Market Y-o-Y Growth (%) Projections, By Country, 2022 to 2032
         
Figure 49: Latin America Market Attractiveness by Country, 2022 to 2032
         
Figure 50: Latin America Market Value (US$ Million) Analysis By Customer type, 2017 to 2032
         
Figure 51: Latin America Market Volume (Units) Analysis By Customer type, 2017 to 2032
         
Figure 52 Latin America Market Y-o-Y Growth (%) Projections, By Customer type, 2022 to 2032
         
Figure 53: Latin America Market Attractiveness By Customer type, 2022 to 2032
         
Figure 54: Latin America Market Value (US$ Million) Analysis by Application, 2017 to 2032
         
Figure 55: Latin America Market Volume (Units) Analysis by Application, 2017 to 2032
         
Figure 56: Latin America Market Y-o-Y Growth (%) Projections, By Application, 2022 to 2032
         
Figure 57: Latin America Market Attractiveness by Application, 2022 to 2032
         
Figure 58: Latin America Market Value (US$ Million) Analysis by Price Range, 2017 to 2032
         
Figure 59: Latin America Market Volume (Units) Analysis by Price Range, 2017 to 2032
         
Figure 60: Latin America Market Y-o-Y Growth (%) Projections, By Price Range, 2022 to 2032
         
Figure 61: Latin America Market Attractiveness by Price Range, 2022 to 2032
         
Figure 62: Latin America Market Value (US$ Million) Analysis by Sales Channel, 2017 to 2032
         
Figure 63: Latin America Market Volume (Units) Analysis by Sales Channel, 2017 to 2032
         
Figure 64 Latin America Market Y-o-Y Growth (%) Projections, By Sales Channel, 2022 to 2032
         
Figure 65: Latin America Market Attractiveness by Sales Channel, 2022 to 2032
         
Figure 66: Europe Market Value (US$ Million) Analysis by Country, 2017 to 2032
         
Figure 67: Europe Market Volume (Units) Analysis by Country, 2017 to 2032
         
Figure 68: Europe Market Y-o-Y Growth (%) Projections, By Country, 2022 to 2032
         
Figure 69: Europe Market Attractiveness by Country, 2022 to 2032
         
Figure 70: Europe Market Value (US$ Million) Analysis By Customer type, 2017 to 2032
         
Figure 71: Europe Market Volume (Units) Analysis By Customer type, 2017 to 2032
         
Figure 72: Europe Market Y-o-Y Growth (%) Projections, By Customer type, 2022 to 2032
         
Figure 73: Europe Market Attractiveness By Customer type, 2022 to 2032
         
Figure 74: Europe Market Value (US$ Million) Analysis by Application, 2017 to 2032
         
Figure 75: Europe Market Volume (Units) Analysis by Application, 2017 to 2032
         
Figure 76: Europe Market Y-o-Y Growth (%) Projections, By Application, 2022 to 2032
         
Figure 77: Europe Market Attractiveness by Application, 2022 to 2032
         
Figure 78: Europe Market Value (US$ Million) Analysis by Price Range, 2017 to 2032
         
Figure 79: Europe Market Volume (Units) Analysis by Price Range, 2017 to 2032
         
Figure 80: Europe Market Y-o-Y Growth (%) Projections, By Price Range, 2022 to 2032
         
Figure 81: Europe Market Attractiveness by Price Range, 2022 to 2032
         
Figure 82: Europe Market Value (US$ Million) Analysis by Sales Channel, 2017 to 2032
         
Figure 83: Europe Market Volume (Units) Analysis by Sales Channel, 2017 to 2032
         
Figure 84: Europe Market Y-o-Y Growth (%) Projections, By Sales Channel, 2022 to 2032
         
Figure 85: East Asia Market Value (US$ Million) Analysis by Country, 2017 to 2032
         
Figure 86: East Asia Market Volume (Units) Analysis by Country, 2017 to 2032
         
Figure 87 East Asia Market Y-o-Y Growth (%) Projections, By Country, 2022 to 2032
         
Figure 88: East Asia Market Attractiveness by Country, 2022 to 2032
         
Figure 89: East Asia Market Value (US$ Million) Analysis By Customer type, 2017 to 2032
         
Figure 90: East Asia Market Volume (Units) Analysis By Customer type, 2017 to 2032
         
Figure 91: East Asia Market Y-o-Y Growth (%) Projections, By Customer type, 2022 to 2032
         
Figure 92: East Asia Market Attractiveness By Customer type, 2022 to 2032
         
Figure 93: East Asia Market Value (US$ Million) Analysis by Application, 2017 to 2032
         
Figure 94: East Asia Market Volume (Units) Analysis by Application, 2017 to 2032
         
Figure 95: East Asia Market Y-o-Y Growth (%) Projections, By Application, 2022 to 2032
         
Figure 96: East Asia Market Attractiveness by Application, 2022 to 2032
         
Figure 97: East Asia Market Value (US$ Million) Analysis by Price Range, 2017 to 2032
         
Figure 98: East Asia Market Volume (Units) Analysis by Price Range, 2017 to 2032
         
Figure 99: East Asia Market Y-o-Y Growth (%) Projections, By Price Range, 2022 to 2032

Figure 100: East Asia Market Attractiveness by Price Range, 2022 to 2032

Figure 101: East Asia Market Value (US$ Million) Analysis by Sales Channel, 2017 to 2032

Figure 102: East Asia Market Volume (Units) Analysis by Sales Channel, 2017 to 2032

Figure 103: East Asia Market Y-o-Y Growth (%) Projections, By Sales Channel, 2022 to 2032

Figure 104: East Asia Market Attractiveness by Sales Channel, 2022 to 2032

Figure 105: South Asia Market Value (US$ Million) Analysis by Country, 2017 to 2032

Figure 106: South Asia Market Volume (Units) Analysis by Country, 2017 to 2032

Figure 107 South Asia Market Y-o-Y Growth (%) Projections, By Country, 2022 to 2032

Figure 108: South Asia Market Attractiveness by Country, 2022 to 2032

Figure 109: South Asia Market Value (US$ Million) Analysis By Customer type, 2017 to 2032

Figure 110: South Asia Market Volume (Units) Analysis By Customer type, 2017 to 2032

Figure 111 South Asia Market Y-o-Y Growth (%) Projections, By Customer type, 2022 to 2032

Figure 112: South Asia Market Attractiveness By Customer type, 2022 to 2032

Figure 113: South Asia Market Value (US$ Million) Analysis by Application, 2017 to 2032

Figure 114: South Asia Market Volume (Units) Analysis by Application, 2017 to 2032

Figure 115: South Asia Market Y-o-Y Growth (%) Projections, By Application, 2022 to 2032

Figure 116: South Asia Market Attractiveness by Application, 2022 to 2032

Figure 117: South Asia Market Value (US$ Million) Analysis by Price Range, 2017 to 2032

Figure 118: South Asia Market Volume (Units) Analysis by Price Range, 2017 to 2032

Figure 119: South Asia Market Y-o-Y Growth (%) Projections, By Price Range, 2022 to 2032

Figure 120: South Asia Market Attractiveness by Price Range, 2022 to 2032

Figure 121: South Asia Market Value (US$ Million) Analysis by Sales Channel, 2017 to 2032

Figure 122: South Asia Market Volume (Units) Analysis by Sales Channel, 2017 to 2032

Figure 123 South Asia Market Y-o-Y Growth (%) Projections, By Sales Channel, 2022 to 2032

Figure 124: South Asia Market Attractiveness by Sales Channel, 2022 to 2032

Figure 125: Oceania Market Value (US$ Million) Analysis by Country, 2017 to 2032

Figure 126: Oceania Market Volume (Units) Analysis by Country, 2017 to 2032

Figure 127 Oceania Market Y-o-Y Growth (%) Projections, By Country, 2022 to 2032

Figure 128: Oceania Market Attractiveness by Country, 2022 to 2032

Figure 129: Oceania Market Value (US$ Million) Analysis By Customer type, 2017 to 2032

Figure 130: Oceania Market Volume (Units) Analysis By Customer type, 2017 to 2032

Figure 131: Oceania Market Y-o-Y Growth (%) Projections, By Customer type, 2022 to 2032

Figure 132: Oceania Market Attractiveness By Customer type, 2022 to 2032

Figure 133: Oceania Market Value (US$ Million) Analysis by Application, 2017 to 2032

Figure 134: Oceania Market Volume (Units) Analysis by Application, 2017 to 2032

Figure 135: Oceania Market Y-o-Y Growth (%) Projections, By Application, 2022 to 2032

Figure 136: Oceania Market Attractiveness by Application, 2022 to 2032

Figure 137: Oceania Market Value (US$ Million) Analysis by Price Range, 2017 to 2032

Figure 138: Oceania Market Volume (Units) Analysis by Price Range, 2017 to 2032

Figure 139: Oceania Market Y-o-Y Growth (%) Projections, By Price Range, 2022 to 2032

Figure 139: Oceania Market Attractiveness by Price Range, 2022 to 2032

Figure 140: Oceania Market Value (US$ Million) Analysis by Sales Channel, 2017 to 2032

Figure 141: Oceania Market Volume (Units) Analysis by Sales Channel, 2017 to 2032

Figure 142: Oceania Market Y-o-Y Growth (%) Projections, By Sales Channel, 2022 to 2032

Figure 143: Oceania Market Attractiveness by Sales Channel, 2022 to 2032

Figure 144: MEA Market Value (US$ Million) Analysis by Country, 2017 to 2032

Figure 145: MEA Market Volume (Units) Analysis by Country, 2017 to 2032

Figure 146: MEA Market Y-o-Y Growth (%) Projections, By Country, 2022 to 2032

Figure 147: MEA Market Attractiveness by Country, 2022 to 2032

Figure 148: MEA Market Value (US$ Million) Analysis By Customer type, 2017 to 2032

Figure 149: MEA Market Volume (Units) Analysis By Customer type, 2017 to 2032

Figure 150: MEA Market Y-o-Y Growth (%) Projections, By Customer type, 2022 to 2032

Figure 151: MEA Market Attractiveness By Customer type, 2022 to 2032

Figure 152: MEA Market Value (US$ Million) Analysis by Application, 2017 to 2032

Figure 153: MEA Market Volume (Units) Analysis by Application, 2017 to 2032

Figure 154: MEA Market Y-o-Y Growth (%) Projections, By Application, 2022 to 2032

Figure 155: MEA Market Attractiveness by Application, 2022 to 2032

Figure 156: MEA Market Value (US$ Million) Analysis by Price Range, 2017 to 2032

Figure 157: MEA Market Volume (Units) Analysis by Price Range, 2017 to 2032

Figure 158: MEA Market Y-o-Y Growth (%) Projections, By Price Range, 2022 to 2032

Figure 159: MEA Market Attractiveness by Price Range, 2022 to 2032

Figure 160: MEA Market Value (US$ Million) Analysis by Sales Channel, 2017 to 2032

Figure 161: MEA Market Volume (Units) Analysis by Sales Channel, 2017 to 2032

Figure 162: MEA Market Y-o-Y Growth (%) Projections, By Sales Channel, 2022 to 2032

Figure 163: MEA Market Attractiveness by Sales Channel, 2022 to 2032

Frequently Asked Questions

How big is the candle air fresheners market?

The global candle air fresheners market reached a valuation of USD 410.2 Million in 2021.

At what rate did the global candle air fresheners market grow between 2017 and 2021?

The global candle air fresheners market grew at a slow 2.7% CAGR between 2017 and 2021.

What are the key trends driving candle air freshener sales?

The growing popularity of online stores, new product launches, growing disposable incomes, and changing lifestyles are some of the key trends boosting the market.

Who are the leading players in the candle air fresheners market?

Leading players operating in the global candle air fresheners market are Church & Dwight, Inc., Farcent Enterprise Co. Ltd., Godrej Consumer Products Limited, Henkel AG & Co. KGaA, Kobayashi Pharmaceutical Co. Ltd., Newell Brands, Procter & Gamble, Reckitt Benckiser Group plc, S.C. Johnson & Son, Inc., Yankee Candles, and others.

What is the candle air freshener's demand outlook for the USA?

The overall sales of candle air fresheners across the USA are projected to surge at a sluggish 2.6% CAGR over the forecast period.

Explore Fast-Moving Consumer Goods (FMCG) Insights

Future Market Insights

Candle Air Fresheners Market