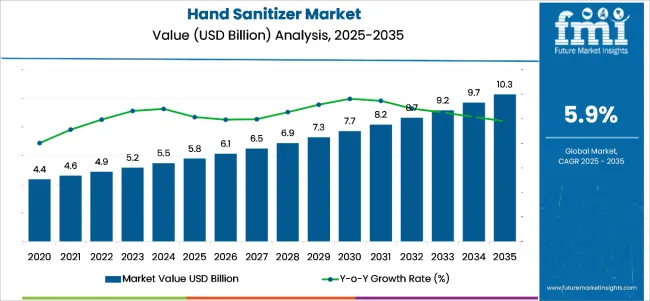
The global hand sanitizer market is poised to reach a valuation of USD 5.8 billion in 2025 and is expected to expand to USD 10.3 billion by 2035, reflecting a steady compound annual growth rate (CAGR) of 5.9%. The rise in consumer hygiene awareness, coupled with increased health and safety regulations across workplaces, public institutions, and healthcare facilities, continues to fuel market growth.
The post-pandemic normalization of sanitization habits and the integration of hand sanitizers into everyday life, both personally and professionally, are contributing to its transformation from a crisis-driven product to a long-term essential.
Driving this market are various factors, including growing public health awareness, advancements in product formats like sprays and wipes, and the shift toward eco-friendly and alcohol-free alternatives.
Demand is especially strong for gel-based and alcohol-based sanitizers, supported by recommendations from global health bodies like the WHO and CDC. The emergence of subscription hygiene models, AI-integrated dispenser systems, and rising adoption of biodegradable packaging further amplify industry prospects, making hygiene innovation a key growth enabler over the next few years.
Government regulations in the market are primarily focused on product safety, labeling transparency, and efficacy standards. Regulatory bodies such as the USA Food and Drug Administration (FDA), World Health Organization (WHO), and Environmental Protection Agency (EPA) have established strict guidelines on permissible ingredients, alcohol content (typically requiring at least 60% ethanol or isopropanol for efficacy), and microbial effectiveness claims.
Sanitizers must clearly list active components, include proper usage instructions, and avoid misleading marketing. Post-COVID, enforcement around methanol bans and toxic formulations has intensified, with non-compliance resulting in product recalls, legal action, or import bans.
Additionally, regional health authorities require certifications and testing to approve claims related to antimicrobial protection and skin safety. As sustainability becomes a priority, governments in regions such as Europe are also pushing for biodegradable packaging and restricting certain chemical agents considered harmful to both humans and the environment. These regulations aim to ensure public health safety while fostering innovation and environmental responsibility in product development.
Per capita spending on hand sanitizers varies significantly across global regions, influenced by income levels, hygiene awareness, and accessibility. Developed markets report higher individual expenditure due to established hygiene standards and strong adoption of premium products, while emerging markets, despite large consumption volumes, maintain lower spending per person.
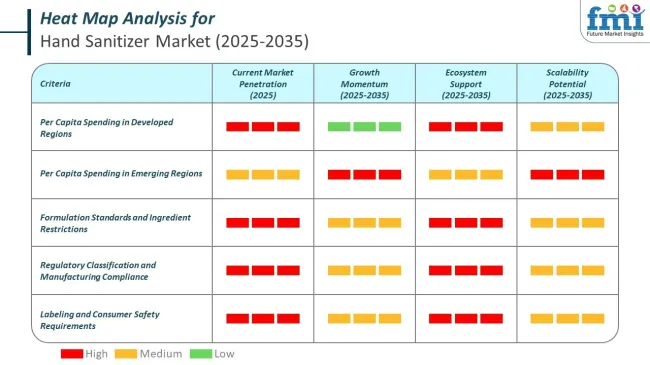
The hand sanitizer market operates under stringent government regulations designed to ensure safety, efficacy, and transparency. These rules influence product formulation, labeling, and manufacturing processes, shaping how companies develop and distribute sanitizers globally. Compliance has become essential to maintain market access and consumer trust.
The market is segmented by product type into gel-based sanitizers, liquid sanitizers, foam sanitizers, spray sanitizers, and wipes & tissues. By active ingredient, the market includes alcohol-based sanitizers and non-alcohol-based sanitizers. Packaging type segmentation comprises bottles (pump bottles, flip-top bottles), sachets & pouches, tubes, spray cans, and dispensers (touchless/automatic & manual).
In terms of sales channel, the market is categorized into retail stores (supermarkets/hypermarkets, convenience stores, pharmacies), e-commerce platforms, direct sales (B2B), and institutional sales (hospitals, schools, offices, public transport, and others). Regionally, the market is analyzed across North America, Latin America, Europe, Asia-Pacific, and the Middle East & Africa.
Gel-based sanitizers are widely sold because they are easy to use, effective, and preferred by many consumers. Their thick consistency makes them simple to apply and control, which helps reduce spills and product waste. Compared to liquid sanitizers, gels tend to stay on the hands longer, providing better coverage and allowing more time for the alcohol to kill germs.
They dry quickly and usually do not leave a sticky residue, making them convenient for everyday use. Many gel sanitizers also contain moisturizing ingredients like aloe vera or glycerin to help prevent skin dryness from frequent application.
They are available in various sizes, from small portable bottles to large dispensers, making them suitable for both personal and commercial use. This segment accounts for 43% share.
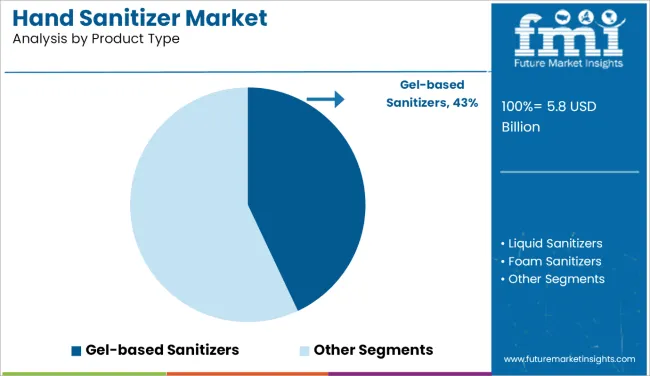
| Product Type | CAGR (2025 to 2035) |
|---|---|
| Gel-based Sanitizers | 43% |
The alcohol-based sanitizers segment is poised to grow at 6.1% CAGR during the study period. Sales of alcohol-based sanitizers are growing due to their proven efficacy in killing a broad spectrum of germs, including viruses and bacteria, within seconds of application.
Recommended by major health organizations like the WHO and CDC, these products are widely trusted for infection control in both clinical and consumer environments. Their high alcohol content, typically between 60% and 95%, ensures rapid disinfection, making them a staple in hospitals, public facilities, and households.
Non-alcohol-based sanitizers are also witnessing increased demand, particularly among consumers with sensitive skin or those seeking alcohol-free alternatives for frequent use. These formulations, often containing benzalkonium chloride or other quaternary ammonium compounds, offer longer-lasting protection and are less likely to cause dryness or irritation.
They are preferred in schools, daycares, and religious settings where alcohol use may be restricted. The rise in demand for both types reflects heightened hygiene awareness, diverse consumer needs, and growing availability across retail and institutional channels.
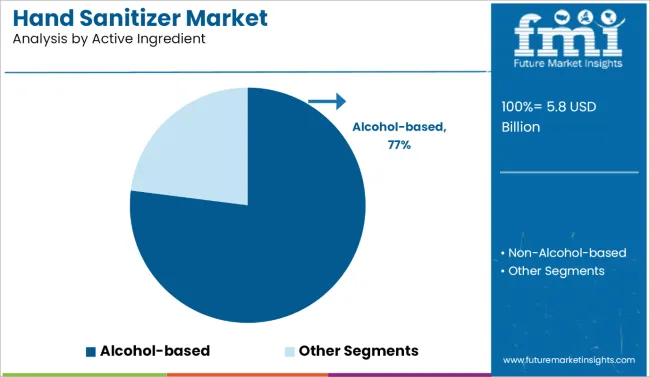
| Active Ingredient | CAGR (2025 to 2035) |
|---|---|
| Alcohol-based Sanitizers | 6.1% |
The bottles segment grabs 53% share. Bottled packaging is preferred for hand sanitizers because of its practicality, safety, and ease of use. Bottles with flip-top caps or pump dispensers allow for controlled and hygienic application, which helps minimize waste and contamination.
They are also durable, leak-resistant, and easy to carry, making them suitable for both personal and commercial use.
Bottled packaging is available in various sizes, from small pocket bottles to larger dispensers, catering to different usage needs. In addition, clear or labeled bottles help users easily identify the product and track how much is left. This makes bottled packaging a convenient and reliable choice.
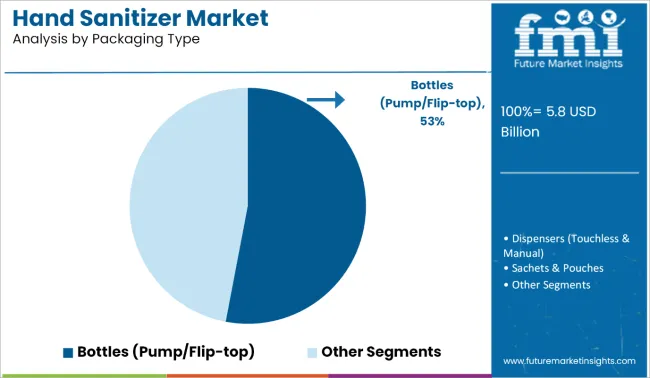
| Packaging Type | CAGR (2025 to 2035) |
|---|---|
| Bottles | 53% |
Hand sanitizers are widely sold through retail stores due to their high demand, convenience, and accessibility. Retail outlets such as supermarkets, pharmacies, and convenience stores offer immediate availability, making it easy for consumers to purchase them during regular shopping trips.
The compact packaging of sanitizers allows for prominent shelf placement near checkouts, encouraging impulse buying. Additionally, retail stores cater to a wide customer base, from individuals to families, ensuring steady sales.
The COVID-19 pandemic significantly boosted awareness of hand hygiene, and retail channels continue to serve as the most direct and efficient point of sale for everyday sanitation needs. This segment registers 47% share.
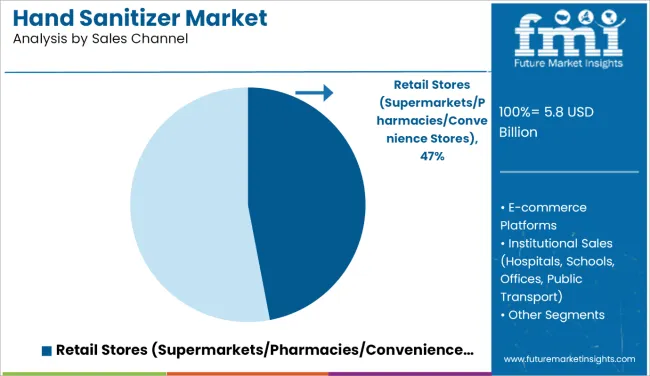
| Sales Channel | CAGR (2025 to 2035) |
|---|---|
| Retail Stores | 47% |
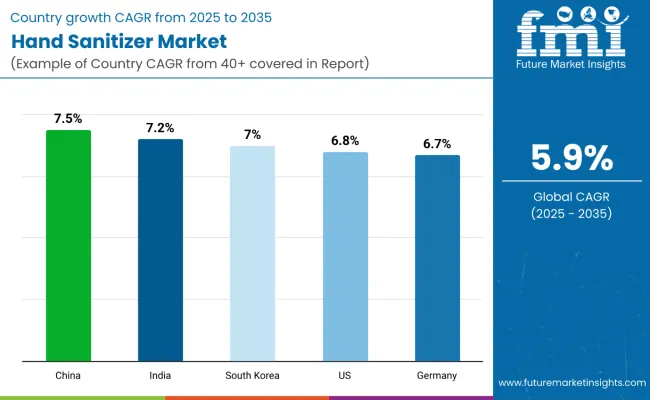
The United States hand sanitizer market is likely to grow at a CAGR of 6.8% during the forecast period. Driven by institutional healthcare demand, stringent public hygiene regulations, and high consumer awareness, the market continues to sustain strong performance even post-pandemic.
Alcohol-based gel sanitizers dominate due to endorsements from the CDC and WHO, while touchless dispenser technologies and refill subscription models are seeing widespread adoption in corporate and public spaces. Brands like Purell (GOJO) and Germ-X (Vi-Jon) lead the landscape through product innovation and hospital-grade solutions.
E-commerce penetration, paired with strong brick-and-mortar distribution via pharmacies and supermarkets, enables consistent availability. However, increasing demand for eco-packaging and moisturizing variants indicates a shift towards skin-sensitive and sustainable options. As hygiene becomes a normalized consumer priority, market expansion is expected to continue steadily.
| Country | CAGR (2025 to 2035) |
|---|---|
| United States | 6.8% |
China’s hand sanitizer market is projected to reach USD 1.23 billion in 2025 and is set to grow at a CAGR of 7.5% from 2025 to 2035, making it the fastest-growing among major economies. This growth is underpinned by a combination of government-led hygiene mandates, rapid urbanization, and heightened consumer awareness following the COVID-19 pandemic.
The market is highly competitive, with both domestic manufacturers like Walch and Blue Moon and global brands expanding their footprint. China’s strength as a manufacturing hub also positions it as a leading exporter of sanitizers and related hygiene products. E-commerce platforms like Tmall and JD.com drive much of the retail activity, supported by influencer-led marketing and live-streaming sales.
Rising demand for moisturizing, alcohol-based formulations and growing acceptance of plant-derived ingredients reflect an evolving, quality-conscious urban consumer base. Institutional demand from schools, transportation hubs, and corporate offices further supports the need for bulk packaging and dispenser formats.
| Country | CAGR (2025 to 2035) |
|---|---|
| China | 7.5% |
Germanyhand sanitizer market is estimated to be valued at USD 610 million in 2025, expanding at a CAGR of 6.7% from 2025 to 2035. The country demonstrates strong consumer and institutional demand for high-efficacy, hospital-grade sanitizers, particularly alcohol-based solutions endorsed by regulatory bodies.
German consumers show a clear preference for trusted pharmaceutical brands such as Sterillium and Sagrotan, which deliver on both safety and skin compatibility. The market also benefits from stringent workplace hygiene regulations and healthcare compliance protocols. There is growing momentum for touchless dispensers in corporate and public infrastructure, alongside a parallel rise in demand for non-alcohol and eco-friendly formulations tailored for sensitive skin.
The German market’s robust retail infrastructure, including pharmacy chains and supermarkets, ensures wide product availability, while e-commerce platforms are steadily gaining ground. Sustainability remains a key purchase driver, encouraging packaging innovation and interest in refills, biodegradable containers, and chemical-free options.
| Country | CAGR (2025 to 2035) |
|---|---|
| Germany | 6.7% |
Francehand sanitizer market is expected to reach USD 520 million in 2025 and grow at a CAGR of 6.6% over the forecast period. The market is shaped by strong consumer demand for high-quality, skin-nourishing, and aromatic formulations that align with French skincare preferences.
Premium brands such as Bioderma and L'Occitane dominate, offering alcohol-based and organic alternatives that combine hygiene with personal care. French consumers value dermatologically tested, hypoallergenic, and eco-certified products, which has spurred innovation in biodegradable packaging and essential oil-infused formulas. Institutional consumption across public buildings, offices, and transportation facilities also contributes significantly, often through touchless dispenser systems.
The pharmacy and beauty retail channels are deeply entrenched, while digital sales channels are increasingly popular among younger, health-conscious consumers. France’s strict regulatory oversight ensures product quality, fostering a mature, premium-oriented sanitizer market with an emphasis on sustainability and skin health.
| Country | CAGR (2025 to 2035) |
|---|---|
| France | 6.6% |
Indiahand sanitizer market is projected to reach USD 480 million in 2025, advancing at a CAGR of 7.2% during the forecast period. Growth is propelled by heightened public hygiene awareness, expanded healthcare access, and strong government advocacy post-COVID. Affordable pricing, regional manufacturing capabilities, and mass availability through general trade and pharmacies have made hand sanitizers a household staple.
Domestic brands like Himalaya and Dabur have leveraged consumer trust with herbal and Ayurvedic-based sanitizers that appeal to the rising demand for natural and alcohol-free alternatives. Institutional demand from educational institutions, hospitals, and transportation sectors also supports growth, especially in bulk and refill formats.
Urban consumers are adopting skincare-friendly variants, while rural uptake is expanding with sachets and low-cost bottles. Increasing penetration of e-commerce and subscription-based hygiene kits is shaping future demand, with customization, portability, and value-for-money emerging as key purchase criteria.
| Country | CAGR (2025 to 2035) |
|---|---|
| India | 7.2% |
The United Kingdom hand sanitizer market is anticipated to reach USD 510 million in 2025, growing at a CAGR of 6.5% from 2025 to 2035. The market benefits from well-established public health protocols, growing consumer focus on dermatologically approved products, and active government hygiene campaigns.
Leading brands like Dettol and Carex have expanded their portfolios to include fragrance-free and sensitive skin formulations, catering to a discerning consumer base. Demand for sustainable and eco-friendly packaging, such as refillable containers and biodegradable materials, is rising quickly, aligning with national environmental goals. Both retail and online channels are highly developed, with pharmacies, supermarkets, and e-commerce contributing significantly to distribution.
The commercial sector, particularly offices, schools, and hospitality, drives strong institutional sales supported by touchless dispensing systems. Continued emphasis on regulatory compliance and sustainability is fostering innovation, making the UK a highly responsive and mature market in the hygiene space.
| Country | CAGR (2025 to 2035) |
|---|---|
| United Kingdom | 6.5% |
South Korea hand sanitizer market is projected to reach USD 460 million in 2025, with a forecasted CAGR of 7% from 2025 to 2035. The market is deeply influenced by the country’s advanced beauty and skincare industry, with consumers favoring non-sticky, fragrant, and moisturizing formulations.
Brands such as Innisfree, The Face Shop, and LG Household & Health Care are leading with products that integrate skin-beneficial ingredients like green tea, aloe vera, and essential oils. Touchless dispenser adoption is rising across offices, transport hubs, and schools, aided by South Korea’s strong technological ecosystem.
Additionally, social media and e-commerce platforms like Coupang and Naver Shopping play a central role in driving demand, especially among younger demographics. The focus on aesthetics, portability, and eco-friendly packaging is pushing innovation in formats like mini-sprays and refillable pouches. Government-led public hygiene campaigns and strong consumer loyalty further enhance market resilience and long-term growth prospects.
| Country | CAGR (2025 to 2035) |
|---|---|
| South Korea | 7% |
Japan’s hand sanitizer market is expected to reach USD 430 million in 2025, expanding at a CAGR of 6.3% during the study period. The market is shaped by the country’s deep-rooted hygiene culture and preference for gentle, skin-friendly formulations. Consumers prioritize fragrance-free, non-alcoholic, and moisturizing variants that can seamlessly integrate into their daily skincare routines.
Leading domestic players like Shiseido and Kose have introduced dermatologically approved sanitizers, catering to premium and health-conscious segments. Portable, single-use formats are highly popular, especially among commuters and office workers. The adoption of smart dispensers and antimicrobial coatings is growing in commercial buildings and public infrastructure.
Japan’s strong retail ecosystem, including pharmacies, convenience stores, and department stores, ensures wide access, while e-commerce offers high-end and specialty imports. Although the market is mature, ongoing innovation and consumer emphasis on skin compatibility and packaging aesthetics are key to sustained growth.
| Country | CAGR (2025 to 2035) |
|---|---|
| Japan | 6.3% |
Brazil’s hand sanitizer market is projected to reach USD 390 million in 2025, growing at a CAGR of 6% from 2025 to 2035. The market has evolved rapidly since the COVID-19 outbreak, with demand now stabilized around institutional usage and growing consumer preference for personal hygiene.
Retail chains and pharmacies continue to be the primary distribution channels, supported by local manufacturing. Popular domestic brands such as Asseptgel and global names like Dettol are widely available. The country's tropical climate increases demand for quick-drying, skin-refreshing formulas, primarily alcohol-based sanitizers with added moisturizing agents.
The Brazilian government continues to enforce hygiene mandates in public places, schools, and healthcare facilities, reinforcing institutional demand. Affordability remains crucial in lower-income regions, while urban consumers seek portable, dermatologically tested, and fragrant options. Despite economic fluctuations, growing health awareness and expanding access to hygiene products in both urban and semi-urban areas support the market’s steady trajectory.
| Country | CAGR (2025 to 2035) |
|---|---|
| Brazil | 6% |
Australia’s hand sanitizer market is forecasted to reach USD 370 million in 2025 and expand at a CAGR of 6.2% from 2025 to 2035. Consumer awareness of hand hygiene remains high, with sustained demand across households, workplaces, healthcare, and hospitality sectors.
Leading brands such as Aqium and Dettol continue to dominate with alcohol-based gels and sprays that combine germ-killing efficacy with skin-friendly ingredients like aloe vera. Environmentally conscious consumers are driving the demand for natural, biodegradable formulations and refillable packaging. The adoption of touchless dispenser systems is expanding in corporate offices, transport hubs, and schools.
Online retail and pharmacy chains serve as strong distribution platforms, with increased interest in subscription-based hygiene services. Travel-sized and portable formats are in demand as mobility returns post-pandemic. Regulatory backing and consumer inclination toward clean-label, locally produced sanitizers further bolster market expansion across both urban and regional markets.
| Country | CAGR (2025 to 2035) |
|---|---|
| Australia | 6.2% |
| Company Name | Estimated Market Share (%) |
|---|---|
| GOJO Industries Inc. (Purell) | 20 - 25% |
| Reckitt Benckiser Group PLC | 12 - 16% |
| Procter & Gamble Company | 8 - 12% |
| Unilever PLC | 8 - 12% |
| Vi-Jon Laboratories, Inc. | 7 - 10% |
Themarket is moderately consolidated, with the top five players collectively accounting for approximately 55-65% of the global market share in 2025. GOJO Industries Inc., the maker of Purell, leads the segment with an estimated 20-25% share, benefiting from its deep penetration in institutional channels and reputation for hospital-grade formulations.
Reckitt Benckiser Group PLC, known for Dettol and Lysol, holds a 12-16% share and dominates in both retail and healthcare segments through its globally trusted hygiene brand portfolio. Procter & Gamble (Safeguard) and Unilever PLC (Lifebuoy) each command 8-12%, focusing on mass-market affordability, family-safe ingredients, and skin-friendly innovations. Vi-Jon Laboratories Inc., which owns Germ-X and numerous private label partnerships, captures around 7-10%, leveraging cost-effective product lines and wide retail reach in North America.
Leading players focus on diversification, sustainability, and digital integration as key strategies. GOJO Industries, for instance, has heavily invested in smart dispenser systems and refillable packaging for institutional use. Reckitt Benckiser continues to expand its product line to include eco-friendly, fragrance-free, and sensitive skin variants, aiming to balance germ protection with skin care.
Both Unilever and Procter & Gamble are deepening their presence in emerging markets while offering moisturizing, plant-based, and alcohol-free options to attract new consumer bases. Major players are also reinforcing brand equity through educational campaigns, strategic partnerships, and strong omnichannel distribution, including e-commerce expansion and direct-to-consumer subscription models.
In contrast, small and medium-scale players are targeting niche segments such as organic, Ayurvedic, and hypoallergenic sanitizers. Companies like The Himalaya Drug Company, Saraya Co. Ltd., and Seatex Ltd. are capitalizing on the rising demand for clean-label, natural ingredient-based solutions.
Their strategies often revolve around product differentiation, regional branding, and affordability. Some have carved out space in institutional markets by offering bulk formats and compliance-ready products for healthcare, education, and public transit sectors. Private label manufacturers like Kutol Products Company are gaining traction by offering customized branding and scalable production for retail chains.
As innovation becomes critical, both large and small players are experimenting with new delivery formats, like spray pens, wipes, and on-the-go pouches, as well as AI-integrated dispensers. Sustainability is also becoming a competitive edge, with biodegradable packaging, refill stations, and zero-waste formats increasingly influencing purchasing decisions. While the top brands lead with scale and global reach, nimble regional players are finding success through agility, customization, and targeted consumer engagement.
| Attribute | Details |
|---|---|
| Current Total Market Size (2025) | USD 5.8 billion |
| Projected Market Size (2035) | USD 10.3 billion |
| CAGR (2025 to 2035) | 5.9% |
| Base Year for Estimation | 2024 |
| Historical Period | 2020 to 2024 |
| Projections Period | 2025 to 2035 |
| Report Parameter | Revenue in USD billion/ Volume in Units |
| By Product Type | Gel-based Sanitizers, Liquid Sanitizers, Foam Sanitizers, Spray Sanitizers, and Wipes & Tissues |
| By Active Ingredient | Alcohol-based Sanitizers and Non-alcohol-based Sanitizers |
| By Packaging Type | Bottles, Sachets & Pouches, Tubes, Spray Cans, and Dispensers |
| By Sales Channels | Retail Stores, E-commerce Platforms, Direct Sales (B2B), and Institutional Sales |
| Regions Covered | North America, Latin America, Western Europe, South Asia, East Asia, Eastern Europe, and the Middle East & Africa |
| Countries Covered | United States, Japan, Germany, India, United Kingdom, France, Italy, Brazil, Canada, South Korea, Australia, Spain, Netherlands, Saudi Arabia, Switzerland |
| Key Players | Reckitt Benckiser Group PLC, GOJO Industries Inc., Procter & Gamble Company, Unilever PLC, Henkel Corporation, Vi-Jon Laboratories, Inc., The Himalaya Drug Company, Paul Hartmann AG, Kutol Products Company, Sanofi S.A., Saraya Co. Ltd., and Seatex Ltd. |
| Additional Attributes | Dollar sales by value, market share analysis by region, and country-wise analysis |
| Customization and Pricing | Available on request |
The global market is projected to reach USD 10.3 billion by 2035, growing from USD 5.8 billion in 2025 at a CAGR of 5.9%.
Top companies include GOJO Industries (Purell), Reckitt Benckiser (Dettol), Procter & Gamble (Safeguard), Unilever (Lifebuoy), and Vi-Jon (Germ-X), collectively accounting for 55-65% of global market share.
Growth is fueled by increased hygiene awareness, post-pandemic behavioral shifts, demand for skin-safe and sustainable formulations, and adoption of technologies like touchless dispensers.
Gel-based and alcohol-based sanitizers dominate due to their efficacy, ease of use, and global health body endorsements, such as from the WHO and CDC.
Regulations enforce ingredient safety, minimum alcohol content, accurate labeling, and environmental compliance, ensuring product quality while promoting sustainable innovation.


Our Research Products

The "Full Research Suite" delivers actionable market intel, deep dives on markets or technologies, so clients act faster, cut risk, and unlock growth.

The Leaderboard benchmarks and ranks top vendors, classifying them as Established Leaders, Leading Challengers, or Disruptors & Challengers.

Locates where complements amplify value and substitutes erode it, forecasting net impact by horizon

We deliver granular, decision-grade intel: market sizing, 5-year forecasts, pricing, adoption, usage, revenue, and operational KPIs—plus competitor tracking, regulation, and value chains—across 60 countries broadly.

Spot the shifts before they hit your P&L. We track inflection points, adoption curves, pricing moves, and ecosystem plays to show where demand is heading, why it is changing, and what to do next across high-growth markets and disruptive tech

Real-time reads of user behavior. We track shifting priorities, perceptions of today’s and next-gen services, and provider experience, then pace how fast tech moves from trial to adoption, blending buyer, consumer, and channel inputs with social signals (#WhySwitch, #UX).

Partner with our analyst team to build a custom report designed around your business priorities. From analysing market trends to assessing competitors or crafting bespoke datasets, we tailor insights to your needs.
Supplier Intelligence
Discovery & Profiling
Capacity & Footprint
Performance & Risk
Compliance & Governance
Commercial Readiness
Who Supplies Whom
Scorecards & Shortlists
Playbooks & Docs
Category Intelligence
Definition & Scope
Demand & Use Cases
Cost Drivers
Market Structure
Supply Chain Map
Trade & Policy
Operating Norms
Deliverables
Buyer Intelligence
Account Basics
Spend & Scope
Procurement Model
Vendor Requirements
Terms & Policies
Entry Strategy
Pain Points & Triggers
Outputs
Pricing Analysis
Benchmarks
Trends
Should-Cost
Indexation
Landed Cost
Commercial Terms
Deliverables
Brand Analysis
Positioning & Value Prop
Share & Presence
Customer Evidence
Go-to-Market
Digital & Reputation
Compliance & Trust
KPIs & Gaps
Outputs
Full Research Suite comprises of:
Market outlook & trends analysis
Interviews & case studies
Strategic recommendations
Vendor profiles & capabilities analysis
5-year forecasts
8 regions and 60+ country-level data splits
Market segment data splits
12 months of continuous data updates
DELIVERED AS:
PDF EXCEL ONLINE
Hand Sanitizer Spray Pen Market Size and Share Forecast Outlook 2025 to 2035
Latin America Hand Sanitizer Market Size and Share Forecast Outlook 2025 to 2035
Handheld Electrostatic Meter Market Size and Share Forecast Outlook 2025 to 2035
Hand Towel Automatic Folding Machine Market Size and Share Forecast Outlook 2025 to 2035
Handheld Ultrasound Scanner Market Size and Share Forecast Outlook 2025 to 2035
Handheld Tagging Gun Market Forecast and Outlook 2025 to 2035
Handheld Imaging Systems Market Size and Share Forecast Outlook 2025 to 2035
Hand Tools Market Size and Share Forecast Outlook 2025 to 2035
Handloom Product Market Size and Share Forecast Outlook 2025 to 2035
Handheld XRF Analyzers Market Size and Share Forecast Outlook 2025 to 2035
Handheld Police Radar Guns Market Size and Share Forecast Outlook 2025 to 2035
Handheld DNA Reader Market Size and Share Forecast Outlook 2025 to 2035
Handheld Robotic Navigation Market Analysis - Size, Share, and Forecast Outlook 2025 to 2035
Handheld Mesh Nebulizer Market Size and Share Forecast Outlook 2025 to 2035
Hand & Arm Protection (PPE) Market Size and Share Forecast Outlook 2025 to 2035
Handwheels Market Size and Share Forecast Outlook 2025 to 2035
Handheld Chemical and Metal Detector Market Size and Share Forecast Outlook 2025 to 2035
Hands-Free Safety Tools Market Size and Share Forecast Outlook 2025 to 2035
Hand-held Breast Cancer Detection Market Analysis Size and Share Forecast Outlook 2025 to 2035
Handheld Dental X-Ray Systems Market Analysis - Size, Share, and Forecast 2025 to 2035

Thank you!
You will receive an email from our Business Development Manager. Please be sure to check your SPAM/JUNK folder too.
Chat With
MaRIA