Reports

- Global Locations -

Headquarters

Future Market Insights, Inc.

Christiana Corporate, 200
Continental Drive, Suite 401,
Newark, Delaware - 19713,
United States

T: +1-347-918-3531

Americas

Future Market Insights, Inc.

616 Corporate Way, Suite 2-9018,
Valley Cottage, NY 10989, United States

MEA

Future Market Insights

1602-6 Jumeirah Bay X2 Tower, Plot No: JLT-PH2-X2A,
Jumeirah Lakes Towers, Dubai,
United Arab Emirates

Europe

Future Market Insights

3rd Floor, 207 Regent Street,
W1B 3HH London
United Kingdom

T: + 44 (0) 20 8123 9659

Asia Pacific

Future Market Insights

IndiaLand Global Tech Park, Unit UG-1, Behind Grand HighStreet, Phase 1, Hinjawadi, MH, Pune – 411057, India

Handloom Product Market Outlook

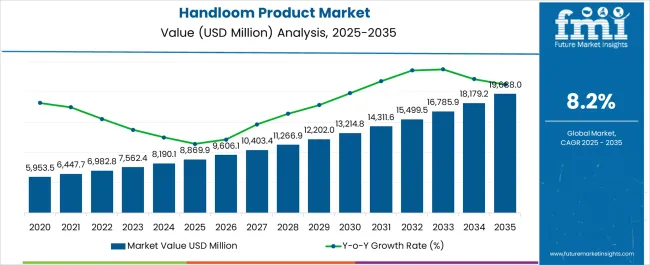
The handloom product market is projected to be valued at US$ 8,190.1 million in 2024 and is expected to rise to US$ 18,179.1 million by 2034. The global handloom product market is expected to evolve at a CAGR of 8.30% during the forecast period.

Key Market Drivers

The handloom product market generated an estimated revenue of US$ 6,237.1 million in 2019. In four years, the market grew at a pace of 5.40% and added a staggering revenue of US$ 953 million. Several reasons can be attributed to this growth:

  • The desire for unique and personalized products and the customization options offered by handwoven textiles in terms of colors, patterns, and designs
  • Improved access to global markets, facilitated by e-commerce platforms and international trade agreements in the developing and underdeveloped countries
  • Rising demand for sustainable and ethical products crafted using traditional methods and natural fibers in the general population all over the world
  • Heightened appreciation for the cultural heritage and authenticity associated with handloom products in countries like China, India, and African countries
  • Increased incorporation of handwoven textiles into the collections of brands and designers to cater to the demands of eco-conscious consumers
  • Government initiatives and support in promoting handloom industries by providing subsidies, tax rebates, training institutes, etc.
  • Incorporating handloom products by corporates into their CSR initiatives, emphasizing the support of local artisans and sustainable practices
Attributes Key Statistics
Expected Base Year Value (2024) US$ 8,190.1 million
Anticipated Forecast Value (2034) US$ 18,179.1 million
Estimated Growth (2024 to 2034) 8.30%

Don't pay for what you don't need

Customize your report by selecting specific countries or regions and save 30%!

Consumption Analysis of the Handloom Product Market

  • Individuals with a keen interest in cultural heritage and traditional craftsmanship form one of the leading consumer groups in the handloom product market.
  • Fashion-forward consumers also contribute significantly to the handloom product market. These individuals are drawn to the exclusivity, intricate designs, and customization options handwoven textiles offer.
  • Eco-conscious and nature-loving consumers committed to sustainable and eco-friendly lifestyles choose handloom products. They see handloom products as a perfect way to support environmentally responsible practices.
  • Interior designers and home décor enthusiasts also consume a substantial amount of handloom products. They use home textiles like rugs, cushions, and curtains to create distinctive living spaces.
  • In countries like India, handloom products, especially intricately woven saris and garments, are famous for weddings and special occasions. Both male and female consumers contribute to the demand for handloom products in the bridal and festive wear segment.

Historical Analysis of the Handloom Product Market

The market for handloom products relies heavily on changing consumer preferences, such as a growing interest in sustainable and ethically produced goods. Various other factors, such as the economic condition and the financial situation of the people, also decide the fate of that market. Besides this, government policies also influence the market growth for handloom products.

The handloom product market has gone through a series of ups and downs in the past few years. During the pandemic, the world faced sudden shutdowns, and the market experienced an exponential plunge due to decreased consumer demand as people started spending less on non-essential commodities. The lockdown also meant reduced production capabilities coupled with disrupted supply chains.

Post-pandemic, the market began to pick some pace due to the increased digital adoption. The pandemic has already heightened the awareness about sustainability. This led to an increased demand for these garments in the international marketplace. With the opening of economies all around the world, the market started proliferating and has now reached a level of stability.

Attributes Key Statistics
Market Value (2019) US$ 6,237.1 million
Market Value (2023) US$ 7,697.4 million
Estimated Growth (2019 to 2023) 5.40%
Sudip Saha
Sudip Saha

Principal Consultant

Talk to Analyst

Find your sweet spots for generating winning opportunities in this market.

Restraining Factors Adversely Affecting the Handloom Product Market

The handloom product market is anticipated to surpass a global valuation of US$ 18,179.1 million by the year 2034, with a growth rate of 8.30%. While the market is expected to experience substantial growth, several restraining factors could adversely affect its development:

  • Competition from mass-produced textiles and clothing is one of the key challenges in the market for handloom products. People prefer mass-produced textiles as they are inexpensive, readily available, and versatile.
  • The industry still relies on manual craftsmanship, and the production process often has limited technological integration. This limits the production capabilities of the manufacturing units, thus hampering the market.
  • The handloom industry also requires skilled workers who possess knowledge of traditional weaving techniques. Younger generations have little to no interest in the handloom industry, potentially affecting the industry's capacity to meet future demand.
  • Handloom manufacturers are usually small-scale enterprises situated in semi-urban and rural areas. These companies fail to generate enough revenue to invest in marketing and advertisements. This limits the visibility and awareness regarding the products.

Comparative View of Adjacent Industries

In this section, the global handloom product industry has been compared with the vegan clothing market and the custom t-shirt printing market, which has the potential to give rigorous competition. The growth rates and challenges for these markets have been mentioned below. Their estimated market valuations have also been jotted down in the table. According to these numbers, it can be confidently projected that the market for vegan clothing is very likely to overpower the other two in the upcoming years.

Handloom Product Market:

Attributes Handloom Product Market
CAGR (2024 to 2034) 8.30%
Growth Factor Increasing consumer demand for sustainable and artisanal products
Key Challenges Limited technological integration and the reliance on manual craftsmanship

Vegan Clothing Market:

Attributes Vegan Clothing Market
CAGR (2024 to 2034) 12.00%
Growth Factor The growing emphasis on veganism and the preference for animal cruelty-free products
Key Challenges Vegan clothes are more expensive than the traditional ones, deflecting cost-sensitive consumers away from the market

Custom T-Shirt Printing Market:

Attributes Custom T-Shirt Printing Market
CAGR (2024 to 2034) 9.70%
Growth Factor Growing popularity of outdoor sports and customized activewear
Key Challenges Managing a wide array of design options and catering to individual preferences can be logistically challenging.

Get the data you need at a Fraction of the cost

Personalize your report by choosing insights you need
and save 40%!

Category-wise Insights

Consumer Demand for Handloom Sarees Touches the Skies Worldwide

In the past few years, there has been a noticeable push toward sustainable products in the general population all over the world. In countries like India, Sri Lanka, Nepal, etc., where sarees are essential in women’s wardrobes, it is observed that there is a considerable demand for handwoven sarees. This demand can be attributed to the familiarity and long tradition of handmade sarees since the beginning of the time.

Attributes Details
Product Type Sarees
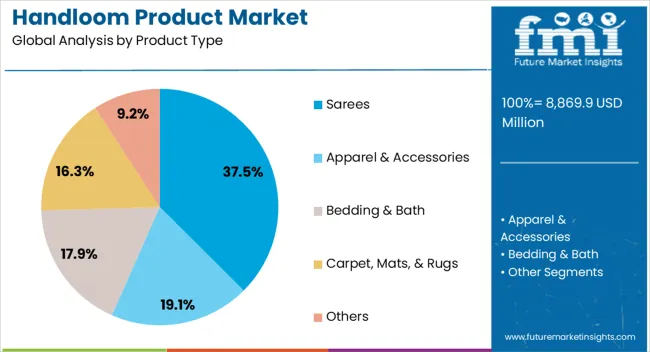
Market Share 35.20%

Based on product type, sarees dominate the global market for handloom products with a whopping share of 35.20%. Due to social media and short video platforms, handmade sarees are also finding their place in the younger demographic. These individuals are drawn to the sustainability and long durability of sarees. Besides this, fashion designers and influencers are also playing a pivotal role in showcasing handloom sarees in diverse and innovative ways, thus contributing to the market's overall expansion.

Cotton Handloom Products Gains Popularity Among Consumers Worldwide

Handloom products are generally popular in countries like India, China, and other ASEAN countries. These economies fall under the geographical belt, where the temperature is usually high throughout the year. Cotton clothes are best suited for this climatic condition as they allow breathability, softness, and comfort. Handloom products manufacturers have responded to this demand by curating products like sarees, shirts, and other wearables from cotton.

Attributes Details
Material Type Cotton
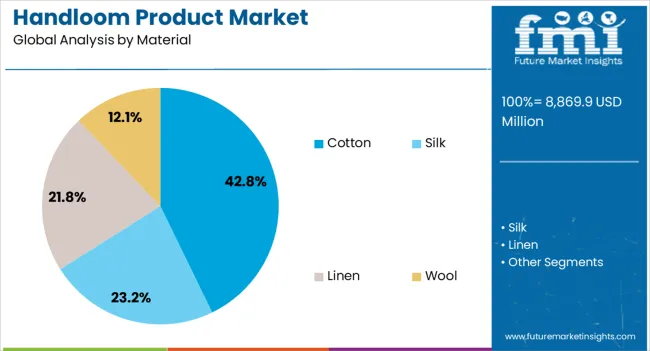
Market share 36.70%

Based on material type, handloom products made from cotton dominate the global market with a remarkable share of 36.70%. The demand for cotton handloom products is also increasing in these areas due to their affordability and accessibility. Cotton is available everywhere in the world, making it a perfect choice for a diverse consumer base.
Country-wise Insights

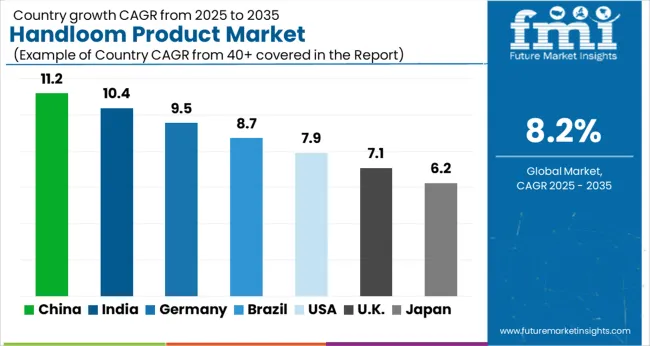
The section analyzes the handloom product market by countries, including China, India, the United States, Germany, and Australia. The table presents the CAGR for each country, indicating the expected market growth in that country through 2034.

Countries CAGR
India 11.10%
Australia 9.50%
China 8.40%
Germany 7.60%
The United States 5.90%

Handloom Product Market in India

India is one of the leading countries in this market. The India handloom product market is anticipated to retain its dominance by progressing at an annual growth rate of 11.10% till 2034.

Indians have been wearing handloom products since ancient times. This familiarity has driven a substantial demand for handloom products, especially sarees and dhotis, in the Indian general population. Besides this, cotton is available in abundance in the Deccan plateau region, enabling small-sized manufacturers to procure raw materials at an affordable cost. This cuts down the production cost, leaving a great scope for profits.

Handloom Product Market in Australia

Australia is the leading market for handloom products outside Asia. Over the next ten years, Australia’s demand for handloom products is projected to rise at a 9.50% CAGR.

More than 90 percent of the population in Australia resides in the coastal areas. The climatic conditions in these areas constitute humid weather and warm currents. In such a scenario, people prefer handloom clothes that offer maximum breathability and comfort. This is the reason why handloom products, especially those made of cotton for leisure, are gaining more popularity in the Australian continent.

Handloom Product Market in China

China is another Asian country in the market. Over the next ten years, the demand for handloom products in China is projected to rise at an 8.40% CAGR.

With the rising disposable incomes of the Chinese middle class, more consumers can afford luxury clothing items. This has a significant impact not just on the domestic market but also on the international marketplace. Moreover, Chinese consumers often look toward global fashion trends, and since sustainable clothing is an ongoing trend, the demand for handloom products is touching the skies in the country.
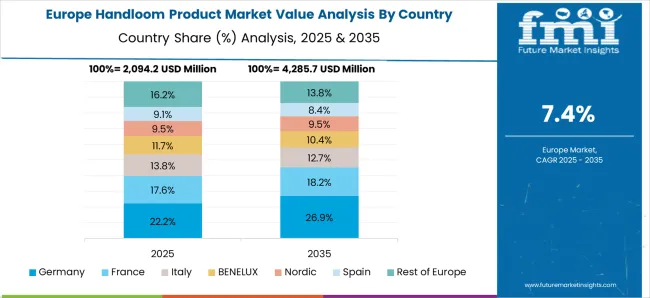
Handloom Product Market in Germany

In the European region, Germany leads the market for handloom products. The market in Germany is poised to showcase a 7.60% advancement per year from 2024 to 2034.

Germany has a strong cultural appreciation for craftsmanship and high-quality products. Handloom products, with their intricate weaving techniques and unique designs, have gained tremendous traction in the German general population. Not only this, ethical consumerism, where consumers prioritize products that are produced under fair labor conditions, is also trending in Germany.

Handloom Product Market in the United States

The United States handloom product market is anticipated to register a CAGR of 5.90% through 2034.

Influencers in the United States are the promoters of handloom products. These influencers, with millions of followers, are collaborating with manufacturers in and around the North American region.
Competitive Landscape

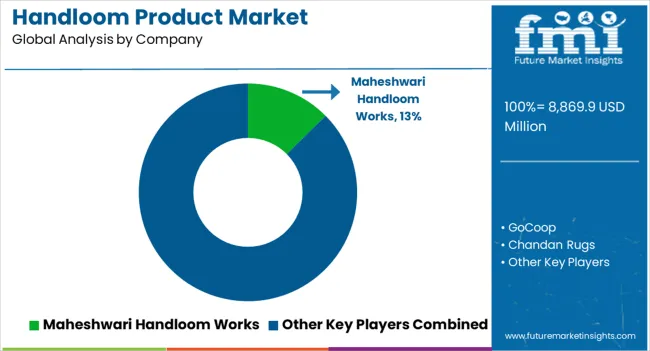
The market for handloom products is filled with players like FabIndia, Khadi and Village Industries Commision, Mungo Design, Looms of Ladakh, etc. These players hold a significant part of the overall handloom product market valuation. Market players are inclined to invest in research and development to increase the affordability, sustainability, and accessibility of their products. There is a presence of smaller companies, too, in the market. These companies bring niche or specialized products to the market, catering to specific consumer needs or preferences.

Recent Developments

  • Recently, FabIndia, a leading player in the handloom product market, introduced its latest collection, ‘Svarnim,’ showcasing the rich cultural diversity of India.Top of Form
  • In 2023, the Khadi and Village Industries Commission (KVIC) unveiled a redesigned Khadi India store at the Indian Institute of Technology (IIT) Campus in Delhi, intending to promote handloom products in the national capital.

Key Companies in the Market

  • FabIndia (India)
  • Khadi & Village Industries Commission (KVIC) (India)
  • Handloom House (Bangladesh)
  • Apolis (United States)
  • Neeru's (India)
  • Anokhi (India)
  • Tantuja (India)
  • Mungo Design (South Africa)
  • Looms of Ladakh (India)
  • Ikat Story (India)
  • Loom & Last (United Kingdom)
  • Le Souk (Tunisia)
  • Handloom Weaving (Sri Lanka)
  • Jugmug Thela (India)
  • Bhane (India)

Key Market Segmentation

By Product Type:

  • Sarees
  • Apparel & Accessories
  • Bedding & Bath
  • Carpet, Mats, & Rugs
  • Others

By Material:

  • Cotton
  • Silk
  • Linen
  • Wool

By Region:

  • North America
  • Latin America
  • Europe
  • Asia Pacific
  • The Middle East and Africa

Frequently Asked Questions

How Much is the Handloom Product Market Currently Worth?

The global handloom product market size is expected to be worth US$ 8,190.1 million in 2024.

What is the Sales Forecast for Handloom Product Through 2034?

The market for handloom products is expected to reach US$ 18,179.1 million by 2034.

At What Rate Is the Handloom Product Market Growing Across the World?

The market for handloom products is growing at 8.30% from 2024 to 2034.

Who are the Key Manufacturing Companies in the Market?

FabIndia, Khadi and Village Industries Commision, Mungo Design, and Looms of Ladakh.

Which is the Preferred Material Type in the Handloom Product Market?

Cotton handloom products dominate the market, with an overall share of 36.70%.

Table of Content

1. Executive Summary

    1.1. Global Market Outlook

    1.2. Demand-side Trends

    1.3. Supply-side Trends

    1.4. Technology Roadmap Analysis

    1.5. Analysis and Recommendations

2. Market Overview

    2.1. Market Coverage / Taxonomy

    2.2. Market Definition / Scope / Limitations

3. Market Background

    3.1. Market Dynamics

        3.1.1. Drivers

        3.1.2. Restraints

        3.1.3. Opportunity

        3.1.4. Trends

    3.2. Scenario Forecast

        3.2.1. Demand in Optimistic Scenario

        3.2.2. Demand in Likely Scenario

        3.2.3. Demand in Conservative Scenario

    3.3. Opportunity Map Analysis

    3.4. Product Life Cycle Analysis

    3.5. Supply Chain Analysis

        3.5.1. Supply Side Participants and their Roles

            3.5.1.1. Producers

            3.5.1.2. Mid-Level Participants (Traders/ Agents/ Brokers)

            3.5.1.3. Wholesalers and Distributors

        3.5.2. Value Added and Value Created at Node in the Supply Chain

        3.5.3. List of Raw Material Suppliers

        3.5.4. List of Existing and Potential Buyer’s

    3.6. Investment Feasibility Matrix

    3.7. Value Chain Analysis

        3.7.1. Profit Margin Analysis

        3.7.2. Wholesalers and Distributors

        3.7.3. Retailers

    3.8. PESTLE and Porter’s Analysis

    3.9. Regulatory Landscape

        3.9.1. By Key Regions

        3.9.2. By Key Countries

    3.10. Regional Parent Market Outlook

    3.11. Production and Consumption Statistics

    3.12. Import and Export Statistics

4. Global Market Analysis 2019 to 2023 and Forecast, 2024 to 2034

    4.1. Historical Market Size Value (US$ Million) & Volume (Units) Analysis, 2019 to 2023

    4.2. Current and Future Market Size Value (US$ Million) & Volume (Units) Projections, 2024 to 2034

        4.2.1. Y-o-Y Growth Trend Analysis

        4.2.2. Absolute $ Opportunity Analysis

5. Global Market Analysis 2019 to 2023 and Forecast 2024 to 2034, By Product Type

    5.1. Introduction / Key Findings

    5.2. Historical Market Size Value (US$ Million) & Volume (Units) Analysis By Product Type, 2019 to 2023

    5.3. Current and Future Market Size Value (US$ Million) & Volume (Units) Analysis and Forecast By Product Type, 2024 to 2034

        5.3.1. Sarees

        5.3.2. Apparel & Accessories

        5.3.3. Bedding & Bath

        5.3.4. Carpet, Mats, & Rugs

        5.3.5. Others

    5.4. Y-o-Y Growth Trend Analysis By Product Type, 2019 to 2023

    5.5. Absolute $ Opportunity Analysis By Product Type, 2024 to 2034

6. Global Market Analysis 2019 to 2023 and Forecast 2024 to 2034, By Material

    6.1. Introduction / Key Findings

    6.2. Historical Market Size Value (US$ Million) & Volume (Units) Analysis By Material, 2019 to 2023

    6.3. Current and Future Market Size Value (US$ Million) & Volume (Units) Analysis and Forecast By Material, 2024 to 2034

        6.3.1. Cotton

        6.3.2. Silk

        6.3.3. Linen

        6.3.4. Wool

    6.4. Y-o-Y Growth Trend Analysis By Material, 2019 to 2023

    6.5. Absolute $ Opportunity Analysis By Material, 2024 to 2034

7. Global Market Analysis 2019 to 2023 and Forecast 2024 to 2034, By Region

    7.1. Introduction

    7.2. Historical Market Size Value (US$ Million) & Volume (Units) Analysis By Region, 2019 to 2023

    7.3. Current Market Size Value (US$ Million) & Volume (Units) Analysis and Forecast By Region, 2024 to 2034

        7.3.1. North America

        7.3.2. Latin America

        7.3.3. Western Europe

        7.3.4. Eastern Europe

        7.3.5. South Asia and Pacific

        7.3.6. East Asia

        7.3.7. Middle East and Africa

    7.4. Market Attractiveness Analysis By Region

8. North America Market Analysis 2019 to 2023 and Forecast 2024 to 2034, By Country

    8.1. Historical Market Size Value (US$ Million) & Volume (Units) Trend Analysis By Market Taxonomy, 2019 to 2023

    8.2. Market Size Value (US$ Million) & Volume (Units) Forecast By Market Taxonomy, 2024 to 2034

        8.2.1. By Country

            8.2.1.1. USA

            8.2.1.2. Canada

        8.2.2. By Product Type

        8.2.3. By Material

    8.3. Market Attractiveness Analysis

        8.3.1. By Country

        8.3.2. By Product Type

        8.3.3. By Material

    8.4. Key Takeaways

9. Latin America Market Analysis 2019 to 2023 and Forecast 2024 to 2034, By Country

    9.1. Historical Market Size Value (US$ Million) & Volume (Units) Trend Analysis By Market Taxonomy, 2019 to 2023

    9.2. Market Size Value (US$ Million) & Volume (Units) Forecast By Market Taxonomy, 2024 to 2034

        9.2.1. By Country

            9.2.1.1. Brazil

            9.2.1.2. Mexico

            9.2.1.3. Rest of Latin America

        9.2.2. By Product Type

        9.2.3. By Material

    9.3. Market Attractiveness Analysis

        9.3.1. By Country

        9.3.2. By Product Type

        9.3.3. By Material

    9.4. Key Takeaways

10. Western Europe Market Analysis 2019 to 2023 and Forecast 2024 to 2034, By Country

    10.1. Historical Market Size Value (US$ Million) & Volume (Units) Trend Analysis By Market Taxonomy, 2019 to 2023

    10.2. Market Size Value (US$ Million) & Volume (Units) Forecast By Market Taxonomy, 2024 to 2034

        10.2.1. By Country

            10.2.1.1. Germany

            10.2.1.2. UK

            10.2.1.3. France

            10.2.1.4. Spain

            10.2.1.5. Italy

            10.2.1.6. Rest of Western Europe

        10.2.2. By Product Type

        10.2.3. By Material

    10.3. Market Attractiveness Analysis

        10.3.1. By Country

        10.3.2. By Product Type

        10.3.3. By Material

    10.4. Key Takeaways

11. Eastern Europe Market Analysis 2019 to 2023 and Forecast 2024 to 2034, By Country

    11.1. Historical Market Size Value (US$ Million) & Volume (Units) Trend Analysis By Market Taxonomy, 2019 to 2023

    11.2. Market Size Value (US$ Million) & Volume (Units) Forecast By Market Taxonomy, 2024 to 2034

        11.2.1. By Country

            11.2.1.1. Poland

            11.2.1.2. Russia

            11.2.1.3. Czech Republic

            11.2.1.4. Romania

            11.2.1.5. Rest of Eastern Europe

        11.2.2. By Product Type

        11.2.3. By Material

    11.3. Market Attractiveness Analysis

        11.3.1. By Country

        11.3.2. By Product Type

        11.3.3. By Material

    11.4. Key Takeaways

12. South Asia and Pacific Market Analysis 2019 to 2023 and Forecast 2024 to 2034, By Country

    12.1. Historical Market Size Value (US$ Million) & Volume (Units) Trend Analysis By Market Taxonomy, 2019 to 2023

    12.2. Market Size Value (US$ Million) & Volume (Units) Forecast By Market Taxonomy, 2024 to 2034

        12.2.1. By Country

            12.2.1.1. India

            12.2.1.2. Bangladesh

            12.2.1.3. Australia

            12.2.1.4. New Zealand

            12.2.1.5. Rest of South Asia and Pacific

        12.2.2. By Product Type

        12.2.3. By Material

    12.3. Market Attractiveness Analysis

        12.3.1. By Country

        12.3.2. By Product Type

        12.3.3. By Material

    12.4. Key Takeaways

13. East Asia Market Analysis 2019 to 2023 and Forecast 2024 to 2034, By Country

    13.1. Historical Market Size Value (US$ Million) & Volume (Units) Trend Analysis By Market Taxonomy, 2019 to 2023

    13.2. Market Size Value (US$ Million) & Volume (Units) Forecast By Market Taxonomy, 2024 to 2034

        13.2.1. By Country

            13.2.1.1. China

            13.2.1.2. Japan

            13.2.1.3. South Korea

        13.2.2. By Product Type

        13.2.3. By Material

    13.3. Market Attractiveness Analysis

        13.3.1. By Country

        13.3.2. By Product Type

        13.3.3. By Material

    13.4. Key Takeaways

14. Middle East and Africa Market Analysis 2019 to 2023 and Forecast 2024 to 2034, By Country

    14.1. Historical Market Size Value (US$ Million) & Volume (Units) Trend Analysis By Market Taxonomy, 2019 to 2023

    14.2. Market Size Value (US$ Million) & Volume (Units) Forecast By Market Taxonomy, 2024 to 2034

        14.2.1. By Country

            14.2.1.1. GCC Countries

            14.2.1.2. South Africa

            14.2.1.3. Israel

            14.2.1.4. Rest of MEA

        14.2.2. By Product Type

        14.2.3. By Material

    14.3. Market Attractiveness Analysis

        14.3.1. By Country

        14.3.2. By Product Type

        14.3.3. By Material

    14.4. Key Takeaways

15. Key Countries Market Analysis

    15.1. USA

        15.1.1. Pricing Analysis

        15.1.2. Market Share Analysis, 2023

            15.1.2.1. By Product Type

            15.1.2.2. By Material

    15.2. Canada

        15.2.1. Pricing Analysis

        15.2.2. Market Share Analysis, 2023

            15.2.2.1. By Product Type

            15.2.2.2. By Material

    15.3. Brazil

        15.3.1. Pricing Analysis

        15.3.2. Market Share Analysis, 2023

            15.3.2.1. By Product Type

            15.3.2.2. By Material

    15.4. Mexico

        15.4.1. Pricing Analysis

        15.4.2. Market Share Analysis, 2023

            15.4.2.1. By Product Type

            15.4.2.2. By Material

    15.5. Germany

        15.5.1. Pricing Analysis

        15.5.2. Market Share Analysis, 2023

            15.5.2.1. By Product Type

            15.5.2.2. By Material

    15.6. UK

        15.6.1. Pricing Analysis

        15.6.2. Market Share Analysis, 2023

            15.6.2.1. By Product Type

            15.6.2.2. By Material

    15.7. France

        15.7.1. Pricing Analysis

        15.7.2. Market Share Analysis, 2023

            15.7.2.1. By Product Type

            15.7.2.2. By Material

    15.8. Spain

        15.8.1. Pricing Analysis

        15.8.2. Market Share Analysis, 2023

            15.8.2.1. By Product Type

            15.8.2.2. By Material

    15.9. Italy

        15.9.1. Pricing Analysis

        15.9.2. Market Share Analysis, 2023

            15.9.2.1. By Product Type

            15.9.2.2. By Material

    15.10. Poland

        15.10.1. Pricing Analysis

        15.10.2. Market Share Analysis, 2023

            15.10.2.1. By Product Type

            15.10.2.2. By Material

    15.11. Russia

        15.11.1. Pricing Analysis

        15.11.2. Market Share Analysis, 2023

            15.11.2.1. By Product Type

            15.11.2.2. By Material

    15.12. Czech Republic

        15.12.1. Pricing Analysis

        15.12.2. Market Share Analysis, 2023

            15.12.2.1. By Product Type

            15.12.2.2. By Material

    15.13. Romania

        15.13.1. Pricing Analysis

        15.13.2. Market Share Analysis, 2023

            15.13.2.1. By Product Type

            15.13.2.2. By Material

    15.14. India

        15.14.1. Pricing Analysis

        15.14.2. Market Share Analysis, 2023

            15.14.2.1. By Product Type

            15.14.2.2. By Material

    15.15. Bangladesh

        15.15.1. Pricing Analysis

        15.15.2. Market Share Analysis, 2023

            15.15.2.1. By Product Type

            15.15.2.2. By Material

    15.16. Australia

        15.16.1. Pricing Analysis

        15.16.2. Market Share Analysis, 2023

            15.16.2.1. By Product Type

            15.16.2.2. By Material

    15.17. New Zealand

        15.17.1. Pricing Analysis

        15.17.2. Market Share Analysis, 2023

            15.17.2.1. By Product Type

            15.17.2.2. By Material

    15.18. China

        15.18.1. Pricing Analysis

        15.18.2. Market Share Analysis, 2023

            15.18.2.1. By Product Type

            15.18.2.2. By Material

    15.19. Japan

        15.19.1. Pricing Analysis

        15.19.2. Market Share Analysis, 2023

            15.19.2.1. By Product Type

            15.19.2.2. By Material

    15.20. South Korea

        15.20.1. Pricing Analysis

        15.20.2. Market Share Analysis, 2023

            15.20.2.1. By Product Type

            15.20.2.2. By Material

    15.21. GCC Countries

        15.21.1. Pricing Analysis

        15.21.2. Market Share Analysis, 2023

            15.21.2.1. By Product Type

            15.21.2.2. By Material

    15.22. South Africa

        15.22.1. Pricing Analysis

        15.22.2. Market Share Analysis, 2023

            15.22.2.1. By Product Type

            15.22.2.2. By Material

    15.23. Israel

        15.23.1. Pricing Analysis

        15.23.2. Market Share Analysis, 2023

            15.23.2.1. By Product Type

            15.23.2.2. By Material

16. Market Structure Analysis

    16.1. Competition Dashboard

    16.2. Competition Benchmarking

    16.3. Market Share Analysis of Top Players

        16.3.1. By Regional

        16.3.2. By Product Type

        16.3.3. By Material

17. Competition Analysis

    17.1. Competition Deep Dive

        17.1.1. Maheshwari Handloom Works

            17.1.1.1. Overview

            17.1.1.2. Product Portfolio

            17.1.1.3. Profitability by Market Segments

            17.1.1.4. Sales Footprint

            17.1.1.5. Strategy Overview

                17.1.1.5.1. Marketing Strategy

                17.1.1.5.2. Product Strategy

                17.1.1.5.3. Channel Strategy

        17.1.2. GoCoop

            17.1.2.1. Overview

            17.1.2.2. Product Portfolio

            17.1.2.3. Profitability by Market Segments

            17.1.2.4. Sales Footprint

            17.1.2.5. Strategy Overview

                17.1.2.5.1. Marketing Strategy

                17.1.2.5.2. Product Strategy

                17.1.2.5.3. Channel Strategy

        17.1.3. Chandan Rugs

            17.1.3.1. Overview

            17.1.3.2. Product Portfolio

            17.1.3.3. Profitability by Market Segments

            17.1.3.4. Sales Footprint

            17.1.3.5. Strategy Overview

                17.1.3.5.1. Marketing Strategy

                17.1.3.5.2. Product Strategy

                17.1.3.5.3. Channel Strategy

        17.1.4. Sri LaxmiNarasimha Handloom Sarees

            17.1.4.1. Overview

            17.1.4.2. Product Portfolio

            17.1.4.3. Profitability by Market Segments

            17.1.4.4. Sales Footprint

            17.1.4.5. Strategy Overview

                17.1.4.5.1. Marketing Strategy

                17.1.4.5.2. Product Strategy

                17.1.4.5.3. Channel Strategy

        17.1.5. Manisha Silk Weaves

            17.1.5.1. Overview

            17.1.5.2. Product Portfolio

            17.1.5.3. Profitability by Market Segments

            17.1.5.4. Sales Footprint

            17.1.5.5. Strategy Overview

                17.1.5.5.1. Marketing Strategy

                17.1.5.5.2. Product Strategy

                17.1.5.5.3. Channel Strategy

        17.1.6. Medusa Exim

            17.1.6.1. Overview

            17.1.6.2. Product Portfolio

            17.1.6.3. Profitability by Market Segments

            17.1.6.4. Sales Footprint

            17.1.6.5. Strategy Overview

                17.1.6.5.1. Marketing Strategy

                17.1.6.5.2. Product Strategy

                17.1.6.5.3. Channel Strategy

        17.1.7. Dhananjay Creations

            17.1.7.1. Overview

            17.1.7.2. Product Portfolio

            17.1.7.3. Profitability by Market Segments

            17.1.7.4. Sales Footprint

            17.1.7.5. Strategy Overview

                17.1.7.5.1. Marketing Strategy

                17.1.7.5.2. Product Strategy

                17.1.7.5.3. Channel Strategy

        17.1.8. Shree Jee

            17.1.8.1. Overview

            17.1.8.2. Product Portfolio

            17.1.8.3. Profitability by Market Segments

            17.1.8.4. Sales Footprint

            17.1.8.5. Strategy Overview

                17.1.8.5.1. Marketing Strategy

                17.1.8.5.2. Product Strategy

                17.1.8.5.3. Channel Strategy

        17.1.9. Global Floor Furnishers

            17.1.9.1. Overview

            17.1.9.2. Product Portfolio

            17.1.9.3. Profitability by Market Segments

            17.1.9.4. Sales Footprint

            17.1.9.5. Strategy Overview

                17.1.9.5.1. Marketing Strategy

                17.1.9.5.2. Product Strategy

                17.1.9.5.3. Channel Strategy

        17.1.10. Dream Home Carpets Pvt. Ltd.

            17.1.10.1. Overview

            17.1.10.2. Product Portfolio

            17.1.10.3. Profitability by Market Segments

            17.1.10.4. Sales Footprint

            17.1.10.5. Strategy Overview

                17.1.10.5.1. Marketing Strategy

                17.1.10.5.2. Product Strategy

                17.1.10.5.3. Channel Strategy

18. Assumptions & Acronyms Used

19. Research Methodology

List of Tables

Table 1: Global Market Value (US$ Million) Forecast by Region, 2019 to 2034

Table 2: Global Market Volume (Units) Forecast by Region, 2019 to 2034

Table 3: Global Market Value (US$ Million) Forecast by Product Type, 2019 to 2034

Table 4: Global Market Volume (Units) Forecast by Product Type, 2019 to 2034

Table 5: Global Market Value (US$ Million) Forecast by Material, 2019 to 2034

Table 6: Global Market Volume (Units) Forecast by Material, 2019 to 2034

Table 7: North America Market Value (US$ Million) Forecast by Country, 2019 to 2034

Table 8: North America Market Volume (Units) Forecast by Country, 2019 to 2034

Table 9: North America Market Value (US$ Million) Forecast by Product Type, 2019 to 2034

Table 10: North America Market Volume (Units) Forecast by Product Type, 2019 to 2034

Table 11: North America Market Value (US$ Million) Forecast by Material, 2019 to 2034

Table 12: North America Market Volume (Units) Forecast by Material, 2019 to 2034

Table 13: Latin America Market Value (US$ Million) Forecast by Country, 2019 to 2034

Table 14: Latin America Market Volume (Units) Forecast by Country, 2019 to 2034

Table 15: Latin America Market Value (US$ Million) Forecast by Product Type, 2019 to 2034

Table 16: Latin America Market Volume (Units) Forecast by Product Type, 2019 to 2034

Table 17: Latin America Market Value (US$ Million) Forecast by Material, 2019 to 2034

Table 18: Latin America Market Volume (Units) Forecast by Material, 2019 to 2034

Table 19: Western Europe Market Value (US$ Million) Forecast by Country, 2019 to 2034

Table 20: Western Europe Market Volume (Units) Forecast by Country, 2019 to 2034

Table 21: Western Europe Market Value (US$ Million) Forecast by Product Type, 2019 to 2034

Table 22: Western Europe Market Volume (Units) Forecast by Product Type, 2019 to 2034

Table 23: Western Europe Market Value (US$ Million) Forecast by Material, 2019 to 2034

Table 24: Western Europe Market Volume (Units) Forecast by Material, 2019 to 2034

Table 25: Eastern Europe Market Value (US$ Million) Forecast by Country, 2019 to 2034

Table 26: Eastern Europe Market Volume (Units) Forecast by Country, 2019 to 2034

Table 27: Eastern Europe Market Value (US$ Million) Forecast by Product Type, 2019 to 2034

Table 28: Eastern Europe Market Volume (Units) Forecast by Product Type, 2019 to 2034

Table 29: Eastern Europe Market Value (US$ Million) Forecast by Material, 2019 to 2034

Table 30: Eastern Europe Market Volume (Units) Forecast by Material, 2019 to 2034

Table 31: South Asia and Pacific Market Value (US$ Million) Forecast by Country, 2019 to 2034

Table 32: South Asia and Pacific Market Volume (Units) Forecast by Country, 2019 to 2034

Table 33: South Asia and Pacific Market Value (US$ Million) Forecast by Product Type, 2019 to 2034

Table 34: South Asia and Pacific Market Volume (Units) Forecast by Product Type, 2019 to 2034

Table 35: South Asia and Pacific Market Value (US$ Million) Forecast by Material, 2019 to 2034

Table 36: South Asia and Pacific Market Volume (Units) Forecast by Material, 2019 to 2034

Table 37: East Asia Market Value (US$ Million) Forecast by Country, 2019 to 2034

Table 38: East Asia Market Volume (Units) Forecast by Country, 2019 to 2034

Table 39: East Asia Market Value (US$ Million) Forecast by Product Type, 2019 to 2034

Table 40: East Asia Market Volume (Units) Forecast by Product Type, 2019 to 2034

Table 41: East Asia Market Value (US$ Million) Forecast by Material, 2019 to 2034

Table 42: East Asia Market Volume (Units) Forecast by Material, 2019 to 2034

Table 43: Middle East and Africa Market Value (US$ Million) Forecast by Country, 2019 to 2034

Table 44: Middle East and Africa Market Volume (Units) Forecast by Country, 2019 to 2034

Table 45: Middle East and Africa Market Value (US$ Million) Forecast by Product Type, 2019 to 2034

Table 46: Middle East and Africa Market Volume (Units) Forecast by Product Type, 2019 to 2034

Table 47: Middle East and Africa Market Value (US$ Million) Forecast by Material, 2019 to 2034

Table 48: Middle East and Africa Market Volume (Units) Forecast by Material, 2019 to 2034

List of Charts

Figure 1: Global Market Value (US$ Million) by Product Type, 2024 to 2034

Figure 2: Global Market Value (US$ Million) by Material, 2024 to 2034

Figure 3: Global Market Value (US$ Million) by Region, 2024 to 2034

Figure 4: Global Market Value (US$ Million) Analysis by Region, 2019 to 2034

Figure 5: Global Market Volume (Units) Analysis by Region, 2019 to 2034

Figure 6: Global Market Value Share (%) and BPS Analysis by Region, 2024 to 2034

Figure 7: Global Market Y-o-Y Growth (%) Projections by Region, 2024 to 2034

Figure 8: Global Market Value (US$ Million) Analysis by Product Type, 2019 to 2034

Figure 9: Global Market Volume (Units) Analysis by Product Type, 2019 to 2034

Figure 10: Global Market Value Share (%) and BPS Analysis by Product Type, 2024 to 2034

Figure 11: Global Market Y-o-Y Growth (%) Projections by Product Type, 2024 to 2034

Figure 12: Global Market Value (US$ Million) Analysis by Material, 2019 to 2034

Figure 13: Global Market Volume (Units) Analysis by Material, 2019 to 2034

Figure 14: Global Market Value Share (%) and BPS Analysis by Material, 2024 to 2034

Figure 15: Global Market Y-o-Y Growth (%) Projections by Material, 2024 to 2034

Figure 16: Global Market Attractiveness by Product Type, 2024 to 2034

Figure 17: Global Market Attractiveness by Material, 2024 to 2034

Figure 18: Global Market Attractiveness by Region, 2024 to 2034

Figure 19: North America Market Value (US$ Million) by Product Type, 2024 to 2034

Figure 20: North America Market Value (US$ Million) by Material, 2024 to 2034

Figure 21: North America Market Value (US$ Million) by Country, 2024 to 2034

Figure 22: North America Market Value (US$ Million) Analysis by Country, 2019 to 2034

Figure 23: North America Market Volume (Units) Analysis by Country, 2019 to 2034

Figure 24: North America Market Value Share (%) and BPS Analysis by Country, 2024 to 2034

Figure 25: North America Market Y-o-Y Growth (%) Projections by Country, 2024 to 2034

Figure 26: North America Market Value (US$ Million) Analysis by Product Type, 2019 to 2034

Figure 27: North America Market Volume (Units) Analysis by Product Type, 2019 to 2034

Figure 28: North America Market Value Share (%) and BPS Analysis by Product Type, 2024 to 2034

Figure 29: North America Market Y-o-Y Growth (%) Projections by Product Type, 2024 to 2034

Figure 30: North America Market Value (US$ Million) Analysis by Material, 2019 to 2034

Figure 31: North America Market Volume (Units) Analysis by Material, 2019 to 2034

Figure 32: North America Market Value Share (%) and BPS Analysis by Material, 2024 to 2034

Figure 33: North America Market Y-o-Y Growth (%) Projections by Material, 2024 to 2034

Figure 34: North America Market Attractiveness by Product Type, 2024 to 2034

Figure 35: North America Market Attractiveness by Material, 2024 to 2034

Figure 36: North America Market Attractiveness by Country, 2024 to 2034

Figure 37: Latin America Market Value (US$ Million) by Product Type, 2024 to 2034

Figure 38: Latin America Market Value (US$ Million) by Material, 2024 to 2034

Figure 39: Latin America Market Value (US$ Million) by Country, 2024 to 2034

Figure 40: Latin America Market Value (US$ Million) Analysis by Country, 2019 to 2034

Figure 41: Latin America Market Volume (Units) Analysis by Country, 2019 to 2034

Figure 42: Latin America Market Value Share (%) and BPS Analysis by Country, 2024 to 2034

Figure 43: Latin America Market Y-o-Y Growth (%) Projections by Country, 2024 to 2034

Figure 44: Latin America Market Value (US$ Million) Analysis by Product Type, 2019 to 2034

Figure 45: Latin America Market Volume (Units) Analysis by Product Type, 2019 to 2034

Figure 46: Latin America Market Value Share (%) and BPS Analysis by Product Type, 2024 to 2034

Figure 47: Latin America Market Y-o-Y Growth (%) Projections by Product Type, 2024 to 2034

Figure 48: Latin America Market Value (US$ Million) Analysis by Material, 2019 to 2034

Figure 49: Latin America Market Volume (Units) Analysis by Material, 2019 to 2034

Figure 50: Latin America Market Value Share (%) and BPS Analysis by Material, 2024 to 2034

Figure 51: Latin America Market Y-o-Y Growth (%) Projections by Material, 2024 to 2034

Figure 52: Latin America Market Attractiveness by Product Type, 2024 to 2034

Figure 53: Latin America Market Attractiveness by Material, 2024 to 2034

Figure 54: Latin America Market Attractiveness by Country, 2024 to 2034

Figure 55: Western Europe Market Value (US$ Million) by Product Type, 2024 to 2034

Figure 56: Western Europe Market Value (US$ Million) by Material, 2024 to 2034

Figure 57: Western Europe Market Value (US$ Million) by Country, 2024 to 2034

Figure 58: Western Europe Market Value (US$ Million) Analysis by Country, 2019 to 2034

Figure 59: Western Europe Market Volume (Units) Analysis by Country, 2019 to 2034

Figure 60: Western Europe Market Value Share (%) and BPS Analysis by Country, 2024 to 2034

Figure 61: Western Europe Market Y-o-Y Growth (%) Projections by Country, 2024 to 2034

Figure 62: Western Europe Market Value (US$ Million) Analysis by Product Type, 2019 to 2034

Figure 63: Western Europe Market Volume (Units) Analysis by Product Type, 2019 to 2034

Figure 64: Western Europe Market Value Share (%) and BPS Analysis by Product Type, 2024 to 2034

Figure 65: Western Europe Market Y-o-Y Growth (%) Projections by Product Type, 2024 to 2034

Figure 66: Western Europe Market Value (US$ Million) Analysis by Material, 2019 to 2034

Figure 67: Western Europe Market Volume (Units) Analysis by Material, 2019 to 2034

Figure 68: Western Europe Market Value Share (%) and BPS Analysis by Material, 2024 to 2034

Figure 69: Western Europe Market Y-o-Y Growth (%) Projections by Material, 2024 to 2034

Figure 70: Western Europe Market Attractiveness by Product Type, 2024 to 2034

Figure 71: Western Europe Market Attractiveness by Material, 2024 to 2034

Figure 72: Western Europe Market Attractiveness by Country, 2024 to 2034

Figure 73: Eastern Europe Market Value (US$ Million) by Product Type, 2024 to 2034

Figure 74: Eastern Europe Market Value (US$ Million) by Material, 2024 to 2034

Figure 75: Eastern Europe Market Value (US$ Million) by Country, 2024 to 2034

Figure 76: Eastern Europe Market Value (US$ Million) Analysis by Country, 2019 to 2034

Figure 77: Eastern Europe Market Volume (Units) Analysis by Country, 2019 to 2034

Figure 78: Eastern Europe Market Value Share (%) and BPS Analysis by Country, 2024 to 2034

Figure 79: Eastern Europe Market Y-o-Y Growth (%) Projections by Country, 2024 to 2034

Figure 80: Eastern Europe Market Value (US$ Million) Analysis by Product Type, 2019 to 2034

Figure 81: Eastern Europe Market Volume (Units) Analysis by Product Type, 2019 to 2034

Figure 82: Eastern Europe Market Value Share (%) and BPS Analysis by Product Type, 2024 to 2034

Figure 83: Eastern Europe Market Y-o-Y Growth (%) Projections by Product Type, 2024 to 2034

Figure 84: Eastern Europe Market Value (US$ Million) Analysis by Material, 2019 to 2034

Figure 85: Eastern Europe Market Volume (Units) Analysis by Material, 2019 to 2034

Figure 86: Eastern Europe Market Value Share (%) and BPS Analysis by Material, 2024 to 2034

Figure 87: Eastern Europe Market Y-o-Y Growth (%) Projections by Material, 2024 to 2034

Figure 88: Eastern Europe Market Attractiveness by Product Type, 2024 to 2034

Figure 89: Eastern Europe Market Attractiveness by Material, 2024 to 2034

Figure 90: Eastern Europe Market Attractiveness by Country, 2024 to 2034

Figure 91: South Asia and Pacific Market Value (US$ Million) by Product Type, 2024 to 2034

Figure 92: South Asia and Pacific Market Value (US$ Million) by Material, 2024 to 2034

Figure 93: South Asia and Pacific Market Value (US$ Million) by Country, 2024 to 2034

Figure 94: South Asia and Pacific Market Value (US$ Million) Analysis by Country, 2019 to 2034

Figure 95: South Asia and Pacific Market Volume (Units) Analysis by Country, 2019 to 2034

Figure 96: South Asia and Pacific Market Value Share (%) and BPS Analysis by Country, 2024 to 2034

Figure 97: South Asia and Pacific Market Y-o-Y Growth (%) Projections by Country, 2024 to 2034

Figure 98: South Asia and Pacific Market Value (US$ Million) Analysis by Product Type, 2019 to 2034

Figure 99: South Asia and Pacific Market Volume (Units) Analysis by Product Type, 2019 to 2034

Figure 100: South Asia and Pacific Market Value Share (%) and BPS Analysis by Product Type, 2024 to 2034

Figure 101: South Asia and Pacific Market Y-o-Y Growth (%) Projections by Product Type, 2024 to 2034

Figure 102: South Asia and Pacific Market Value (US$ Million) Analysis by Material, 2019 to 2034

Figure 103: South Asia and Pacific Market Volume (Units) Analysis by Material, 2019 to 2034

Figure 104: South Asia and Pacific Market Value Share (%) and BPS Analysis by Material, 2024 to 2034

Figure 105: South Asia and Pacific Market Y-o-Y Growth (%) Projections by Material, 2024 to 2034

Figure 106: South Asia and Pacific Market Attractiveness by Product Type, 2024 to 2034

Figure 107: South Asia and Pacific Market Attractiveness by Material, 2024 to 2034

Figure 108: South Asia and Pacific Market Attractiveness by Country, 2024 to 2034

Figure 109: East Asia Market Value (US$ Million) by Product Type, 2024 to 2034

Figure 110: East Asia Market Value (US$ Million) by Material, 2024 to 2034

Figure 111: East Asia Market Value (US$ Million) by Country, 2024 to 2034

Figure 112: East Asia Market Value (US$ Million) Analysis by Country, 2019 to 2034

Figure 113: East Asia Market Volume (Units) Analysis by Country, 2019 to 2034

Figure 114: East Asia Market Value Share (%) and BPS Analysis by Country, 2024 to 2034

Figure 115: East Asia Market Y-o-Y Growth (%) Projections by Country, 2024 to 2034

Figure 116: East Asia Market Value (US$ Million) Analysis by Product Type, 2019 to 2034

Figure 117: East Asia Market Volume (Units) Analysis by Product Type, 2019 to 2034

Figure 118: East Asia Market Value Share (%) and BPS Analysis by Product Type, 2024 to 2034

Figure 119: East Asia Market Y-o-Y Growth (%) Projections by Product Type, 2024 to 2034

Figure 120: East Asia Market Value (US$ Million) Analysis by Material, 2019 to 2034

Figure 121: East Asia Market Volume (Units) Analysis by Material, 2019 to 2034

Figure 122: East Asia Market Value Share (%) and BPS Analysis by Material, 2024 to 2034

Figure 123: East Asia Market Y-o-Y Growth (%) Projections by Material, 2024 to 2034

Figure 124: East Asia Market Attractiveness by Product Type, 2024 to 2034

Figure 125: East Asia Market Attractiveness by Material, 2024 to 2034

Figure 126: East Asia Market Attractiveness by Country, 2024 to 2034

Figure 127: Middle East and Africa Market Value (US$ Million) by Product Type, 2024 to 2034

Figure 128: Middle East and Africa Market Value (US$ Million) by Material, 2024 to 2034

Figure 129: Middle East and Africa Market Value (US$ Million) by Country, 2024 to 2034

Figure 130: Middle East and Africa Market Value (US$ Million) Analysis by Country, 2019 to 2034

Figure 131: Middle East and Africa Market Volume (Units) Analysis by Country, 2019 to 2034

Figure 132: Middle East and Africa Market Value Share (%) and BPS Analysis by Country, 2024 to 2034

Figure 133: Middle East and Africa Market Y-o-Y Growth (%) Projections by Country, 2024 to 2034

Figure 134: Middle East and Africa Market Value (US$ Million) Analysis by Product Type, 2019 to 2034

Figure 135: Middle East and Africa Market Volume (Units) Analysis by Product Type, 2019 to 2034

Figure 136: Middle East and Africa Market Value Share (%) and BPS Analysis by Product Type, 2024 to 2034

Figure 137: Middle East and Africa Market Y-o-Y Growth (%) Projections by Product Type, 2024 to 2034

Figure 138: Middle East and Africa Market Value (US$ Million) Analysis by Material, 2019 to 2034

Figure 139: Middle East and Africa Market Volume (Units) Analysis by Material, 2019 to 2034

Figure 140: Middle East and Africa Market Value Share (%) and BPS Analysis by Material, 2024 to 2034

Figure 141: Middle East and Africa Market Y-o-Y Growth (%) Projections by Material, 2024 to 2034

Figure 142: Middle East and Africa Market Attractiveness by Product Type, 2024 to 2034

Figure 143: Middle East and Africa Market Attractiveness by Material, 2024 to 2034

Figure 144: Middle East and Africa Market Attractiveness by Country, 2024 to 2034

Recommendations

Consumer Product

Vegan Clothing Market

Published : May 2023

Consumer Product

Custom T-Shirt Printing Market

Published : March 2023

Explore Consumer Product Insights

View Reports