Product Design Verification And Validation Solution Market Overview (2022 to 2032)

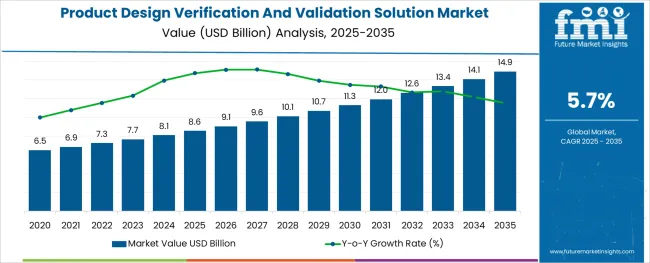
The Product Design Verification And Validation Solution Marketis growing at a promising CAGR and is expected to uphold its pace during the forecast period.

Sales of product design verification and validation solutionare expected to rise globally. There is a growing demand for more efficient and higher-quality design products. In addition to this,demand for product design verification and validation solutionsis rising in the healthcare, retail, manufacturing, and industrial sectors. There is an increase in the creation and adoption of smart gadgets and automated equipment.

Increasing manufacturing industry growth is also projected to contribute to the growth of the Product design verification and validation solution market share.

Some of the keyproduct design verification and validation solution markettrends promoting thedemand for product design verification and validation solutioninclude how these solutions incorporate advanced technology such as machine learning, big data, and artificial intelligence.

They are also using solutions that verify product quality in accordance with customer requirements in order to maximize productivity and reduce latency. The requirement for product design verification and validation solutions is expected to rise as a result.

Lack of awareness across industries about the value of these solutions in developing markets like India, Brazil, and China are some of the factors limiting the growth of the product design verification and validation solution market.

What are the Key Contributors to the Product Design Verification And Validation Solution Market Share?

Thedemand for product design verification and validation solutionsis anticipated to increase at a robust pace over the forecast period (2022 to 2032). Growth in the market is attributed to the increasing need for efficient and improved design quality products worldwide.

Verification and validation of products are two separate procedures extensively used by end-users to cross-check the quality of products and services. The expansion of manufacturing and retail sectors is increasing the need for improved quality of products.

To cater to the growing system requirements, industries are increasing the adoption andsales of product design verification and validation solutions. Evaluation of product's design and quality on the basis of specific development, design requirement, and conditions.

With the growing need for advanced products and customized requirements, especially in IT & telecom, healthcare, and manufacturing industries, key companies are developing advanced solutions for verifying and validating the design and quality of the product.

Thesales of product design verification and validation solutionswitnessed an uptick through 2021 amid growing demand for specific COVID-19 medicines and vaccination. Leading healthcare companies implemented advanced verification and validation solutions for efficient medicines to adhere to the surgingdemand for product design verification and validation solution.

Besides this, rapid digitization and automation in the public and manufacturing sector are also propelling the demand for product design verification, and validation solutions are slated to rise over the coming years.

Growing production and adoption ofsmart devicesand automated equipment in healthcare, retail, manufacturing, and industrial sectors are the major factors driving thedemand for product design verification and validation solutions.

Additionally, the integration of advanced technology such asmachine learning, big data, and artificial intelligence in these solutions is increasing sales in the market. With the surging expansion of the manufacturing industry and the development of industrial automated equipment, end users are implementing verification process solutions to determine the quality of the products.

They are also adopting solutions that verify the product quality as per the consumer's requirement to improve efficiency and reduce latency. This is projected to fuel thesales of product design verification and validation solutions.
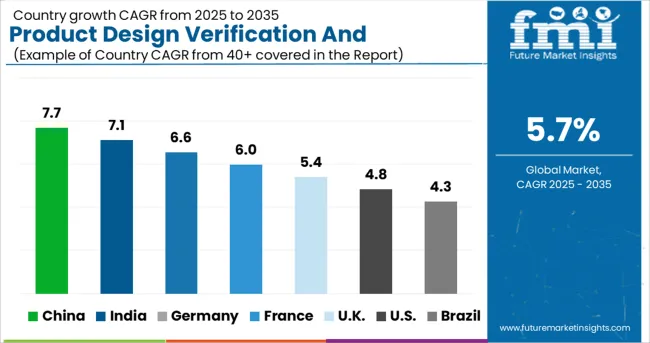
Which Region holds the Highest Growth Potential in the Product Design Verification And Validation Solution Market?

As per Future Market Insights (FMI), Asia Pacific is expected to emerge as the most lucrativeproduct design verification and validation solution market.Rapid development in the manufacturing and healthcare industries, especially across India and China, will fuel thedemand for product design verification and validation solution.

The expansion of the retail sector and booming commercial industryin India is propelling the demand for improved quality products with specific requirements. Consumers are becoming increasingly aware of the products they require, enabling the increasedsales of product design verification and validation solutions.

Backed by these factors, the Asia Pacificdemand for product design verification and validation solutionsis slated to witness growth at a significant rate during the assessment period.

According to FMI, the North Americansales of product design verification and validation solution areprojected to account for the lion’s share between 2022 and 2032.

Ongoing advances in the manufacturing, transportation and IT sectors are driving thedemand for product design verification and validation solutions.

Increasing demand for automation in these sectors and the need for efficient products will promote growth in North America.Demand for product design verification and validation solutionsis expected to increase with a heavy presence of industries and key players in the USA.

As per the study, the USA is projected to spearhead the growth in North Americanproduct design verification and validation solutions sales.
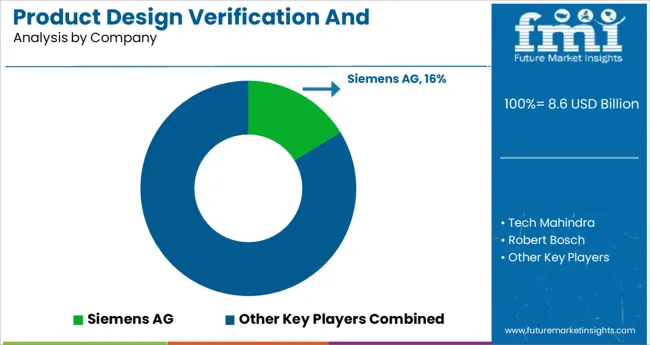
How is the Competitive Landscape in the Product Design Verification and Validation Solution Market?

Some of the key participants present in the globalproduct design verification and validation solution marketinclude Igate Patni Ltd., MathWorks Inc., Tech Mahindra Ltd., Intent Design Pvt Ltd., The RealTime Group Inc., and IVT Network Limited, among others.

According to the study, the market is projected to be highly competitive due to the rise indemand for product design verification and validation solutions withnumerous leading players. Key players are collaborating with end users to cater to the surgingdemand for product design verification and validation solutionfor these solutions.

Some of the players are adopting strategies such as mergers & acquisitions and product development to increase theirsales of product design verification and validation solution. They are also integrating advanced technologies such as big data science and real-time analytics to improve the efficiency of the products.

Scope of Report

Report Attributes Details
Base year for estimation 2021
Historical data 2015 to 2020
Forecast period 2022 to 2032
Quantitative units Revenue in USD Million, volume in kilotons, and CAGR from 2022 to 2032
Report coverage Revenue forecast, volume forecast, company ranking, competitive landscape, growth factors, and trends, Pricing Analysis
Segments covered Component, Application, Verticals, Region
Regional scope North America; Western Europe; Eastern Europe; Middle East; Africa; ASEAN; South Asia; Rest of Asia
Country scope USA, Canada, Mexico, Germany, UK, France, Italy, Spain, Russia, Belgium, Poland, Czech Republic, China, India, Japan, Australia, Brazil, Argentina, Colombia, Saudi Arabia, UAE, Iran, South Africa
Key companies profiled The RealTime Group Inc.; MathWorks Inc.; IVT Network Limited; Intent Design Pvt Ltd.; Tech Mahindra Ltd.; and Igate Patni Ltd. among others
Customization scope Free report customization (equivalent to up to 8 analysts working days) with purchase. Addition or alteration to country, regional & segment scope.
Pricing and purchase options Avail customized purchase options to meet your exact research needs.

Key segments covered in Product Design Verification and Validation Solution (PDVVS) market report

By Component:

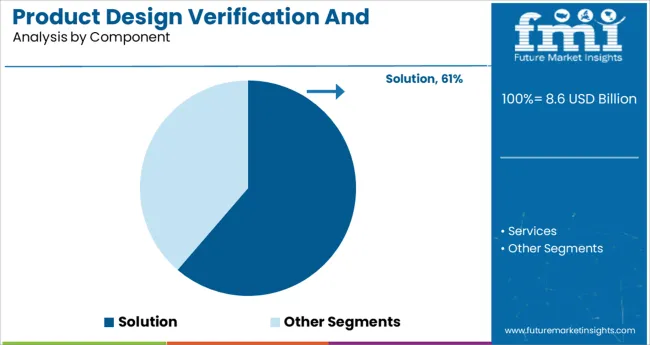
  • Solution
  • Services

By Application:

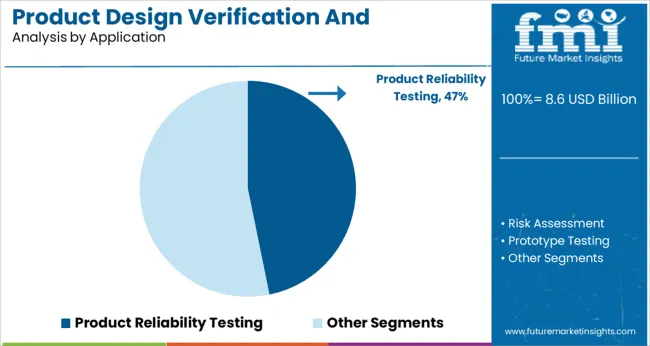
  • Product Reliability Testing
  • Risk Assessment
  • Prototype Testing
  • Environment Testing

By Verticals:

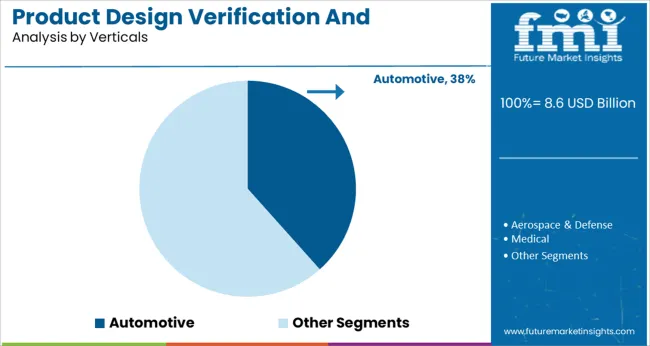
  • Aerospace & Defense
  • Automotive
  • Medical
  • Industrial Automation
  • IT & Telecom

By Region:

  • USA
  • UK
  • India
  • China
  • Japan

Table of Content

  • 1. Executive Summary
  • 2. Market Overview
  • 3. Market Background
  • 4. Global Product Design Verification and Validation Solution Market Analysis 2017 to 2021 and Forecast 2022 to 2032
  • 5. Global Product Design Verification and Validation Solution Market Analysis 2017 to 2021 and Forecast 2022 to 2032, By Component
    • 5.1. Platform/Solution
    • 5.2. Services
  • 6. Global Product Design Verification and Validation Solution Market Analysis 2017 to 2021 and Forecast 2022 to 2032, By Application
    • 6.1. Product Reliability Testing
    • 6.2. Risk Assessment
    • 6.3. Prototype Testing
    • 6.4. Environment Testing
    • 6.5. Hardware-in-Loop Testing
    • 6.6. Graphics Interface Testing
    • 6.7. Others
  • 7. Global Product Design Verification and Validation Solution Market Analysis 2017 to 2021 and Forecast 2022 to 2032, By End Use Industry
    • 7.1. Aerospace & Defense
    • 7.2. Automotive
    • 7.3. Medical
    • 7.4. Industrial Automation
    • 7.5. IT & Telecom
    • 7.6. Energy & Utilities
    • 7.7. Others
  • 8. Global Product Design Verification and Validation Solution Market Analysis 2017 to 2021 and Forecast 2022 to 2032, By Region
    • 8.1. North America
    • 8.2. Latin America
    • 8.3. Europe
    • 8.4. East Asia
    • 8.5. South Asia & Pacific
    • 8.6. MEA
  • 9. North America Product Design Verification and Validation Solution Market Analysis 2017 to 2021 and Forecast 2022 to 2032, By Country
  • 10. Latin America Product Design Verification and Validation Solution Market Analysis 2017 to 2021 and Forecast 2022 to 2032, By Country
  • 11. Europe Product Design Verification and Validation Solution Market Analysis 2017 to 2021 and Forecast 2022 to 2032, By Country
  • 12. East Asia Product Design Verification and Validation Solution Market Analysis 2017 to 2021 and Forecast 2022 to 2032, By Country
  • 13. South Asia & Pacific Product Design Verification and Validation Solution Market Analysis 2017 to 2021 and Forecast 2022 to 2032, By Country
  • 14. MEA Product Design Verification and Validation Solution Market Analysis 2017 to 2021 and Forecast 2022 to 2032, By Country
  • 15. Key Countries Product Design Verification and Validation Solution Market Analysis
  • 16. Market Structure Analysis
  • 17. Competition Analysis
    • 17.1. Tech Mahindra
    • 17.2. Siemens AG
    • 17.3. Robert Bosch
    • 17.4. Igate Patni Ltd.
    • 17.5. Intent Design Pvt Ltd.
    • 17.6. Trident Infosol
    • 17.7. L&T Technology Services Limited
    • 17.8. Sasken Technologies Ltd.
    • 17.9. Capgemini
    • 17.10. Mistral Solutions Pvt. Ltd.
    • 17.11. IVT Network Limited
    • 17.12. MathWorks Inc.
  • 18. Assumptions & Acronyms Used
  • 19. Research Methodology

List of Tables

Table 1: Global Product Design Verification And Validation Solution Market Value (US$ Mn) Forecast by Region, 2017-2032

Table 2: Global Product Design Verification And Validation Solution Market Value (US$ Mn) Forecast by Component, 2017-2032

Table 3: Global Product Design Verification And Validation Solution Market Value (US$ Mn) Forecast by Application, 2017-2032

Table 4: Global Product Design Verification And Validation Solution Market Value (US$ Mn) Forecast by End Use Industry, 2017-2032

Table 5: North America Product Design Verification And Validation Solution Market Value (US$ Mn) Forecast by Country, 2017-2032

Table 6: North America Product Design Verification And Validation Solution Market Value (US$ Mn) Forecast by Component, 2017-2032

Table 7: North America Product Design Verification And Validation Solution Market Value (US$ Mn) Forecast by Application, 2017-2032

Table 8: North America Product Design Verification And Validation Solution Market Value (US$ Mn) Forecast by End Use Industry, 2017-2032

Table 9: Latin America Product Design Verification And Validation Solution Market Value (US$ Mn) Forecast by Country, 2017-2032

Table 10: Latin America Product Design Verification And Validation Solution Market Value (US$ Mn) Forecast by Component, 2017-2032

Table 11: Latin America Product Design Verification And Validation Solution Market Value (US$ Mn) Forecast by Application, 2017-2032

Table 12: Latin America Product Design Verification And Validation Solution Market Value (US$ Mn) Forecast by End Use Industry, 2017-2032

Table 13: Europe Product Design Verification And Validation Solution Market Value (US$ Mn) Forecast by Country, 2017-2032

Table 14: Europe Product Design Verification And Validation Solution Market Value (US$ Mn) Forecast by Component, 2017-2032

Table 15: Europe Product Design Verification And Validation Solution Market Value (US$ Mn) Forecast by Application, 2017-2032

Table 16: Europe Product Design Verification And Validation Solution Market Value (US$ Mn) Forecast by End Use Industry, 2017-2032

Table 17: East Asia Product Design Verification And Validation Solution Market Value (US$ Mn) Forecast by Country, 2017-2032

Table 18: East Asia Product Design Verification And Validation Solution Market Value (US$ Mn) Forecast by Component, 2017-2032

Table 19: East Asia Product Design Verification And Validation Solution Market Value (US$ Mn) Forecast by Application, 2017-2032

Table 20: East Asia Product Design Verification And Validation Solution Market Value (US$ Mn) Forecast by End Use Industry, 2017-2032

Table 21: South Asia & Pacific Product Design Verification And Validation Solution Market Value (US$ Mn) Forecast by Country, 2017-2032

Table 22: South Asia & Pacific Product Design Verification And Validation Solution Market Value (US$ Mn) Forecast by Component, 2017-2032

Table 23: South Asia & Pacific Product Design Verification And Validation Solution Market Value (US$ Mn) Forecast by Application, 2017-2032

Table 24: South Asia & Pacific Product Design Verification And Validation Solution Market Value (US$ Mn) Forecast by End Use Industry, 2017-2032

Table 25: MEA Product Design Verification And Validation Solution Market Value (US$ Mn) Forecast by Country, 2017-2032

Table 26: MEA Product Design Verification And Validation Solution Market Value (US$ Mn) Forecast by Component, 2017-2032

Table 27: MEA Product Design Verification And Validation Solution Market Value (US$ Mn) Forecast by Application, 2017-2032

Table 28: MEA Product Design Verification And Validation Solution Market Value (US$ Mn) Forecast by End Use Industry, 2017-2032

List of Figures

Figure 1: Global Product Design Verification And Validation Solution Market Value (US$ Mn) by Component, 2022-2032

Figure 2: Global Product Design Verification And Validation Solution Market Value (US$ Mn) by Application, 2022-2032

Figure 3: Global Product Design Verification And Validation Solution Market Value (US$ Mn) by End Use Industry, 2022-2032

Figure 4: Global Product Design Verification And Validation Solution Market Value (US$ Mn) by Region, 2022-2032

Figure 5: Global Product Design Verification And Validation Solution Market Value (US$ Mn) Analysis by Region, 2017-2032

Figure 6: Global Product Design Verification And Validation Solution Market Value Share (%) and BPS Analysis by Region, 2022-2032

Figure 7: Global Product Design Verification And Validation Solution Market Y-o-Y Growth (%) Projections by Region, 2022-2032

Figure 8: Global Product Design Verification And Validation Solution Market Value (US$ Mn) Analysis by Component, 2017-2032

Figure 9: Global Product Design Verification And Validation Solution Market Value Share (%) and BPS Analysis by Component, 2022-2032

Figure 10: Global Product Design Verification And Validation Solution Market Y-o-Y Growth (%) Projections by Component, 2022-2032

Figure 11: Global Product Design Verification And Validation Solution Market Value (US$ Mn) Analysis by Application, 2017-2032

Figure 12: Global Product Design Verification And Validation Solution Market Value Share (%) and BPS Analysis by Application, 2022-2032

Figure 13: Global Product Design Verification And Validation Solution Market Y-o-Y Growth (%) Projections by Application, 2022-2032

Figure 14: Global Product Design Verification And Validation Solution Market Value (US$ Mn) Analysis by End Use Industry, 2017-2032

Figure 15: Global Product Design Verification And Validation Solution Market Value Share (%) and BPS Analysis by End Use Industry, 2022-2032

Figure 16: Global Product Design Verification And Validation Solution Market Y-o-Y Growth (%) Projections by End Use Industry, 2022-2032

Figure 17: Global Product Design Verification And Validation Solution Market Attractiveness by Component, 2022-2032

Figure 18: Global Product Design Verification And Validation Solution Market Attractiveness by Application, 2022-2032

Figure 19: Global Product Design Verification And Validation Solution Market Attractiveness by End Use Industry, 2022-2032

Figure 20: Global Product Design Verification And Validation Solution Market Attractiveness by Region, 2022-2032

Figure 21: North America Product Design Verification And Validation Solution Market Value (US$ Mn) by Component, 2022-2032

Figure 22: North America Product Design Verification And Validation Solution Market Value (US$ Mn) by Application, 2022-2032

Figure 23: North America Product Design Verification And Validation Solution Market Value (US$ Mn) by End Use Industry, 2022-2032

Figure 24: North America Product Design Verification And Validation Solution Market Value (US$ Mn) by Country, 2022-2032

Figure 25: North America Product Design Verification And Validation Solution Market Value (US$ Mn) Analysis by Country, 2017-2032

Figure 26: North America Product Design Verification And Validation Solution Market Value Share (%) and BPS Analysis by Country, 2022-2032

Figure 27: North America Product Design Verification And Validation Solution Market Y-o-Y Growth (%) Projections by Country, 2022-2032

Figure 28: North America Product Design Verification And Validation Solution Market Value (US$ Mn) Analysis by Component, 2017-2032

Figure 29: North America Product Design Verification And Validation Solution Market Value Share (%) and BPS Analysis by Component, 2022-2032

Figure 30: North America Product Design Verification And Validation Solution Market Y-o-Y Growth (%) Projections by Component, 2022-2032

Figure 31: North America Product Design Verification And Validation Solution Market Value (US$ Mn) Analysis by Application, 2017-2032

Figure 32: North America Product Design Verification And Validation Solution Market Value Share (%) and BPS Analysis by Application, 2022-2032

Figure 33: North America Product Design Verification And Validation Solution Market Y-o-Y Growth (%) Projections by Application, 2022-2032

Figure 34: North America Product Design Verification And Validation Solution Market Value (US$ Mn) Analysis by End Use Industry, 2017-2032

Figure 35: North America Product Design Verification And Validation Solution Market Value Share (%) and BPS Analysis by End Use Industry, 2022-2032

Figure 36: North America Product Design Verification And Validation Solution Market Y-o-Y Growth (%) Projections by End Use Industry, 2022-2032

Figure 37: North America Product Design Verification And Validation Solution Market Attractiveness by Component, 2022-2032

Figure 38: North America Product Design Verification And Validation Solution Market Attractiveness by Application, 2022-2032

Figure 39: North America Product Design Verification And Validation Solution Market Attractiveness by End Use Industry, 2022-2032

Figure 40: North America Product Design Verification And Validation Solution Market Attractiveness by Country, 2022-2032

Figure 41: Latin America Product Design Verification And Validation Solution Market Value (US$ Mn) by Component, 2022-2032

Figure 42: Latin America Product Design Verification And Validation Solution Market Value (US$ Mn) by Application, 2022-2032

Figure 43: Latin America Product Design Verification And Validation Solution Market Value (US$ Mn) by End Use Industry, 2022-2032

Figure 44: Latin America Product Design Verification And Validation Solution Market Value (US$ Mn) by Country, 2022-2032

Figure 45: Latin America Product Design Verification And Validation Solution Market Value (US$ Mn) Analysis by Country, 2017-2032

Figure 46: Latin America Product Design Verification And Validation Solution Market Value Share (%) and BPS Analysis by Country, 2022-2032

Figure 47: Latin America Product Design Verification And Validation Solution Market Y-o-Y Growth (%) Projections by Country, 2022-2032

Figure 48: Latin America Product Design Verification And Validation Solution Market Value (US$ Mn) Analysis by Component, 2017-2032

Figure 49: Latin America Product Design Verification And Validation Solution Market Value Share (%) and BPS Analysis by Component, 2022-2032

Figure 50: Latin America Product Design Verification And Validation Solution Market Y-o-Y Growth (%) Projections by Component, 2022-2032

Figure 51: Latin America Product Design Verification And Validation Solution Market Value (US$ Mn) Analysis by Application, 2017-2032

Figure 52: Latin America Product Design Verification And Validation Solution Market Value Share (%) and BPS Analysis by Application, 2022-2032

Figure 53: Latin America Product Design Verification And Validation Solution Market Y-o-Y Growth (%) Projections by Application, 2022-2032

Figure 54: Latin America Product Design Verification And Validation Solution Market Value (US$ Mn) Analysis by End Use Industry, 2017-2032

Figure 55: Latin America Product Design Verification And Validation Solution Market Value Share (%) and BPS Analysis by End Use Industry, 2022-2032

Figure 56: Latin America Product Design Verification And Validation Solution Market Y-o-Y Growth (%) Projections by End Use Industry, 2022-2032

Figure 57: Latin America Product Design Verification And Validation Solution Market Attractiveness by Component, 2022-2032

Figure 58: Latin America Product Design Verification And Validation Solution Market Attractiveness by Application, 2022-2032

Figure 59: Latin America Product Design Verification And Validation Solution Market Attractiveness by End Use Industry, 2022-2032

Figure 60: Latin America Product Design Verification And Validation Solution Market Attractiveness by Country, 2022-2032

Figure 61: Europe Product Design Verification And Validation Solution Market Value (US$ Mn) by Component, 2022-2032

Figure 62: Europe Product Design Verification And Validation Solution Market Value (US$ Mn) by Application, 2022-2032

Figure 63: Europe Product Design Verification And Validation Solution Market Value (US$ Mn) by End Use Industry, 2022-2032

Figure 64: Europe Product Design Verification And Validation Solution Market Value (US$ Mn) by Country, 2022-2032

Figure 65: Europe Product Design Verification And Validation Solution Market Value (US$ Mn) Analysis by Country, 2017-2032

Figure 66: Europe Product Design Verification And Validation Solution Market Value Share (%) and BPS Analysis by Country, 2022-2032

Figure 67: Europe Product Design Verification And Validation Solution Market Y-o-Y Growth (%) Projections by Country, 2022-2032

Figure 68: Europe Product Design Verification And Validation Solution Market Value (US$ Mn) Analysis by Component, 2017-2032

Figure 69: Europe Product Design Verification And Validation Solution Market Value Share (%) and BPS Analysis by Component, 2022-2032

Figure 70: Europe Product Design Verification And Validation Solution Market Y-o-Y Growth (%) Projections by Component, 2022-2032

Figure 71: Europe Product Design Verification And Validation Solution Market Value (US$ Mn) Analysis by Application, 2017-2032

Figure 72: Europe Product Design Verification And Validation Solution Market Value Share (%) and BPS Analysis by Application, 2022-2032

Figure 73: Europe Product Design Verification And Validation Solution Market Y-o-Y Growth (%) Projections by Application, 2022-2032

Figure 74: Europe Product Design Verification And Validation Solution Market Value (US$ Mn) Analysis by End Use Industry, 2017-2032

Figure 75: Europe Product Design Verification And Validation Solution Market Value Share (%) and BPS Analysis by End Use Industry, 2022-2032

Figure 76: Europe Product Design Verification And Validation Solution Market Y-o-Y Growth (%) Projections by End Use Industry, 2022-2032

Figure 77: Europe Product Design Verification And Validation Solution Market Attractiveness by Component, 2022-2032

Figure 78: Europe Product Design Verification And Validation Solution Market Attractiveness by Application, 2022-2032

Figure 79: Europe Product Design Verification And Validation Solution Market Attractiveness by End Use Industry, 2022-2032

Figure 80: Europe Product Design Verification And Validation Solution Market Attractiveness by Country, 2022-2032

Figure 81: East Asia Product Design Verification And Validation Solution Market Value (US$ Mn) by Component, 2022-2032

Figure 82: East Asia Product Design Verification And Validation Solution Market Value (US$ Mn) by Application, 2022-2032

Figure 83: East Asia Product Design Verification And Validation Solution Market Value (US$ Mn) by End Use Industry, 2022-2032

Figure 84: East Asia Product Design Verification And Validation Solution Market Value (US$ Mn) by Country, 2022-2032

Figure 85: East Asia Product Design Verification And Validation Solution Market Value (US$ Mn) Analysis by Country, 2017-2032

Figure 86: East Asia Product Design Verification And Validation Solution Market Value Share (%) and BPS Analysis by Country, 2022-2032

Figure 87: East Asia Product Design Verification And Validation Solution Market Y-o-Y Growth (%) Projections by Country, 2022-2032

Figure 88: East Asia Product Design Verification And Validation Solution Market Value (US$ Mn) Analysis by Component, 2017-2032

Figure 89: East Asia Product Design Verification And Validation Solution Market Value Share (%) and BPS Analysis by Component, 2022-2032

Figure 90: East Asia Product Design Verification And Validation Solution Market Y-o-Y Growth (%) Projections by Component, 2022-2032

Figure 91: East Asia Product Design Verification And Validation Solution Market Value (US$ Mn) Analysis by Application, 2017-2032

Figure 92: East Asia Product Design Verification And Validation Solution Market Value Share (%) and BPS Analysis by Application, 2022-2032

Figure 93: East Asia Product Design Verification And Validation Solution Market Y-o-Y Growth (%) Projections by Application, 2022-2032

Figure 94: East Asia Product Design Verification And Validation Solution Market Value (US$ Mn) Analysis by End Use Industry, 2017-2032

Figure 95: East Asia Product Design Verification And Validation Solution Market Value Share (%) and BPS Analysis by End Use Industry, 2022-2032

Figure 96: East Asia Product Design Verification And Validation Solution Market Y-o-Y Growth (%) Projections by End Use Industry, 2022-2032

Figure 97: East Asia Product Design Verification And Validation Solution Market Attractiveness by Component, 2022-2032

Figure 98: East Asia Product Design Verification And Validation Solution Market Attractiveness by Application, 2022-2032

Figure 99: East Asia Product Design Verification And Validation Solution Market Attractiveness by End Use Industry, 2022-2032

Figure 100: East Asia Product Design Verification And Validation Solution Market Attractiveness by Country, 2022-2032

Figure 101: South Asia & Pacific Product Design Verification And Validation Solution Market Value (US$ Mn) by Component, 2022-2032

Figure 102: South Asia & Pacific Product Design Verification And Validation Solution Market Value (US$ Mn) by Application, 2022-2032

Figure 103: South Asia & Pacific Product Design Verification And Validation Solution Market Value (US$ Mn) by End Use Industry, 2022-2032

Figure 104: South Asia & Pacific Product Design Verification And Validation Solution Market Value (US$ Mn) by Country, 2022-2032

Figure 105: South Asia & Pacific Product Design Verification And Validation Solution Market Value (US$ Mn) Analysis by Country, 2017-2032

Figure 106: South Asia & Pacific Product Design Verification And Validation Solution Market Value Share (%) and BPS Analysis by Country, 2022-2032

Figure 107: South Asia & Pacific Product Design Verification And Validation Solution Market Y-o-Y Growth (%) Projections by Country, 2022-2032

Figure 108: South Asia & Pacific Product Design Verification And Validation Solution Market Value (US$ Mn) Analysis by Component, 2017-2032

Figure 109: South Asia & Pacific Product Design Verification And Validation Solution Market Value Share (%) and BPS Analysis by Component, 2022-2032

Figure 110: South Asia & Pacific Product Design Verification And Validation Solution Market Y-o-Y Growth (%) Projections by Component, 2022-2032

Figure 111: South Asia & Pacific Product Design Verification And Validation Solution Market Value (US$ Mn) Analysis by Application, 2017-2032

Figure 112: South Asia & Pacific Product Design Verification And Validation Solution Market Value Share (%) and BPS Analysis by Application, 2022-2032

Figure 113: South Asia & Pacific Product Design Verification And Validation Solution Market Y-o-Y Growth (%) Projections by Application, 2022-2032

Figure 114: South Asia & Pacific Product Design Verification And Validation Solution Market Value (US$ Mn) Analysis by End Use Industry, 2017-2032

Figure 115: South Asia & Pacific Product Design Verification And Validation Solution Market Value Share (%) and BPS Analysis by End Use Industry, 2022-2032

Figure 116: South Asia & Pacific Product Design Verification And Validation Solution Market Y-o-Y Growth (%) Projections by End Use Industry, 2022-2032

Figure 117: South Asia & Pacific Product Design Verification And Validation Solution Market Attractiveness by Component, 2022-2032

Figure 118: South Asia & Pacific Product Design Verification And Validation Solution Market Attractiveness by Application, 2022-2032

Figure 119: South Asia & Pacific Product Design Verification And Validation Solution Market Attractiveness by End Use Industry, 2022-2032

Figure 120: South Asia & Pacific Product Design Verification And Validation Solution Market Attractiveness by Country, 2022-2032

Figure 121: MEA Product Design Verification And Validation Solution Market Value (US$ Mn) by Component, 2022-2032

Figure 122: MEA Product Design Verification And Validation Solution Market Value (US$ Mn) by Application, 2022-2032

Figure 123: MEA Product Design Verification And Validation Solution Market Value (US$ Mn) by End Use Industry, 2022-2032

Figure 124: MEA Product Design Verification And Validation Solution Market Value (US$ Mn) by Country, 2022-2032

Figure 125: MEA Product Design Verification And Validation Solution Market Value (US$ Mn) Analysis by Country, 2017-2032

Figure 126: MEA Product Design Verification And Validation Solution Market Value Share (%) and BPS Analysis by Country, 2022-2032

Figure 127: MEA Product Design Verification And Validation Solution Market Y-o-Y Growth (%) Projections by Country, 2022-2032

Figure 128: MEA Product Design Verification And Validation Solution Market Value (US$ Mn) Analysis by Component, 2017-2032

Figure 129: MEA Product Design Verification And Validation Solution Market Value Share (%) and BPS Analysis by Component, 2022-2032

Figure 130: MEA Product Design Verification And Validation Solution Market Y-o-Y Growth (%) Projections by Component, 2022-2032

Figure 131: MEA Product Design Verification And Validation Solution Market Value (US$ Mn) Analysis by Application, 2017-2032

Figure 132: MEA Product Design Verification And Validation Solution Market Value Share (%) and BPS Analysis by Application, 2022-2032

Figure 133: MEA Product Design Verification And Validation Solution Market Y-o-Y Growth (%) Projections by Application, 2022-2032

Figure 134: MEA Product Design Verification And Validation Solution Market Value (US$ Mn) Analysis by End Use Industry, 2017-2032

Figure 135: MEA Product Design Verification And Validation Solution Market Value Share (%) and BPS Analysis by End Use Industry, 2022-2032

Figure 136: MEA Product Design Verification And Validation Solution Market Y-o-Y Growth (%) Projections by End Use Industry, 2022-2032

Figure 137: MEA Product Design Verification And Validation Solution Market Attractiveness by Component, 2022-2032

Figure 138: MEA Product Design Verification And Validation Solution Market Attractiveness by Application, 2022-2032

Figure 139: MEA Product Design Verification And Validation Solution Market Attractiveness by End Use Industry, 2022-2032

Figure 140: MEA Product Design Verification And Validation Solution Market Attractiveness by Country, 2022-2032

Frequently Asked Questions

Who are the Key Players in the Product Design Verification and Validation Solution Market?

Key players holding substantial product design verification and validation solution market share include The RealTime Group Inc., MathWorks Inc., IVT Network Limited, Intent Design Pvt Ltd., Tech Mahindra Ltd., and Igate Patni Ltd. among others.

Which are the Key Restraints in the Product Design Verification and Validation Solution Market?

Demand for product design verification and validation solution is likely to be hindered due to lack of awareness across industries regarding the benefits of these solutions in developing economies such as India, Brazil, and China.

Explore Similar Insights

Future Market Insights

Product Design Verification And Validation Solution Market