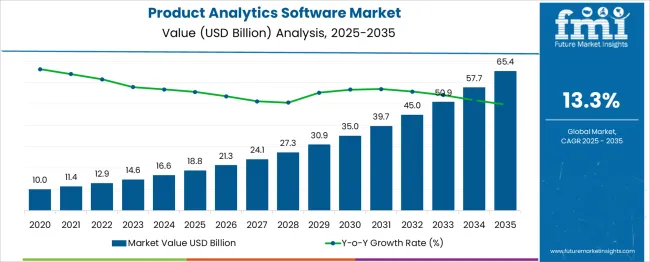
The global product analytics software market garnered USD 11.2 Billion in 2021 and is likely to exhibit a Y-o-Y increase of 15.2% to be valued at USD 12.9 Billion in 2022. Owing to the growing support from various governmental organizations, the market is likely to propel to USD 45.2 Billion by 2032. The trade is projected at a 13.3% CAGR during the forecast period.
Increasing concerns with respect to improving customer behavior management to deliver personalized recommendations of products to ensure market competitiveness, which will benefit the market in the forecast period.
Attributes | Details |
---|---|
Global Product Analytics Software Market CAGR (2022 to 2032) | 13.3% |
Global Product Analytics Software Market (2032) | USD 45.2 Billion |
Global Product Analytics Software Market Attraction | Increasing adoption of big data and other related technologies is expected to drive the adoption of product analytics solutions and services in the forecast period. |
Rising Demand for Cloud-Based Analytical Solutions to Boost the Market in coming years
The rising penetration of big data technologies, cloud computing, and other advanced technologies has prompted product analytics software providers to transform services to a whole new level. As per market research FMI, the market for product analytics software witnessed a staggering 15.6% CAGR from 2015 to 2021.
As enterprises strive to attain a competitive edge, product analytics software is a necessity. Demand for cloud analytics is the next big thing coming in the product analytics market and extends the enormous opportunity for product analytics software. The advent of cloud computing has pushed the sells planning to a new level and is expected to have a long-term impact on the product analytics market.
The presence of Data Breaching and Malware Attacks due to Enhanced Technological Infrastructure is expected to be the key factor hampering the market growth in the forecast period.
Also, expenses associated with product analytics are likely to discourage the entrance of new players into the market, thereby, limiting the market growth. Moreover, the availability of low-cost alternative services is further speculated to hinder trade growth during the forecast period.
One more challenge faced by market players is the lack of skilled professionals understanding data analysis and inadequate capital which is projected to limit the growth through the forecast period.
As per the analysis, the deployment type sector is anticipated to hold remunerative opportunities for the global product analytics software market. The adoption of technologies like machine learning, and AI by product-specific industries like manufacturing is driving the demand for the product analytics software market.
As product analytics software provides critical information to optimize performance, diagnose problems, and correlate customer activity with long-term value, increases its demand in different industries such as Manufacturing, Automotive, Healthcare, Energy & Utility, Government, and Retail. For instance, in 2020 the Department of Health and Human Services (HHS), the Department of Veterans Affairs, and the Department of Energy (DOE) announced a new big data analytics initiative to coordinate and share COVID-19 information.
The increasing need for organizations for monitoring competitiveness is driving the product analytics software market globally. The increasing demand for cloud-based analytical solutions is fueling the demand of the industry. In addition, technological developments and favorable government plans create promising economic opportunities in the market.
Demand for Product Analytics Software to be Maximum by Offering
As per the analysis, by offerings, the software segment is likely to dominate the market in the forecast period. The software segment is anticipated to expand at a CAGR of 13.2% during the forecast period.
Growth can be attributed to the increasing demand for advanced analytics tools to ensure market competitiveness and the growing adoption of big data and other related technologies.
Will Cloud-based Product Analytics Software remain Preferred?
By deployment type, cloud-based product analytics software is projected to dominate the market during the forecast period. The segment is expected to grow at a 12.7% CAGR in the assessment period.
Many organizations nowadays deploy cloud-based solutions due to scalability, flexibility in capacity, enhanced collaboration, and cost-efficiency. The Cloud-based product analytics software offers a centralized way to integrate the system and its components with web and mobile applications and helps organizations boost their sales performance.
North America to be a Lucrative Market for Product Analytics Software
North America is anticipated to lead the global product analytics software market during the forecast period. The market is likely to garner USD 15.7 Billion while exhibiting a CAGR of 13.1% from 2022 to 2032. Product analytics software sales in the USA are projected to offer lucrative opportunities for revenue generation over the forecast period.
The dominance of North America is attributed to the increased demand for product analytics outsourcing from sectors including BFSI, retail, telecommunication, and healthcare.
Burgeoning technological advancements in the region are key factors favoring the growth of the product analytics market. The presence of leading players such as International Business Machines (IBM) and Oracle Corporation, to name a few will continue driving sales in the country. The increasing number of product analytics players across regions is expected to further drive market growth.
Asia Pacific to be another Opportunistic Geography for Investment
Asia Pacific is anticipated to be the fastest-growing region during the forecast period. China is likely to make the most significant contribution to developing the market. China is estimated at USD 3.4 Billion, expanding at a 12.8% CAGR during the forecast period. China is expected to be the leading market due to the growing introduction of advanced technologies in the region.
The growth of the market can be attributed to the presence of evolving countries such as; India, China, Japan, and others. Also, strategic initiatives by key market players and government initiatives undertaken in the country drive the growth of the market in forecasting years.
In addition, Japan has been recognized as another potent player in the region. According to the analysis, the country is anticipated at USD 2.8 Billion while recording a CAGR of 12.0% in the forecast period. The development of the regional market can be credited to the rapid development in the concerned field, while South Korea is expected to be estimated at USD 1.6 Billion.
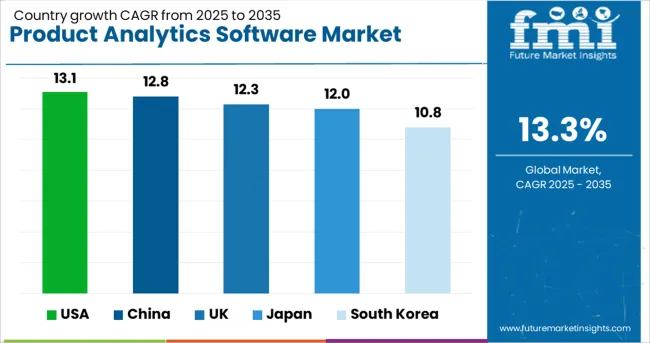
Countries | Estimated CAGR |
---|---|
USA | 13.1% |
China | 12.8% |
UK | 12.3% |
Japan | 12.0% |
South Korea | 10.8% |
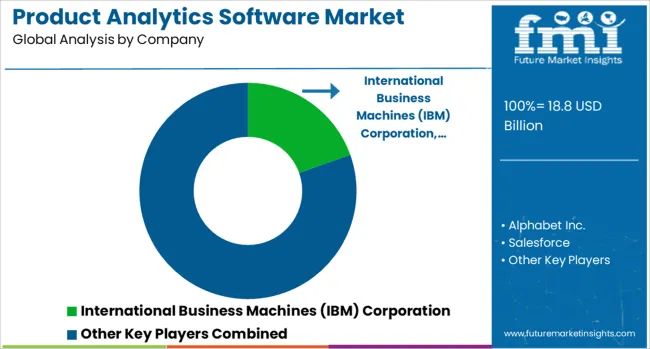
Eminent players in the global product analytics software market include International Business Machines (IBM) Corporation, Alphabet Inc., Salesforce, Oracle Corporation, and SAP SE among others. Recent key developments among players include:
Table 1: Global Market Value (US$ Million), By End-User, 2015 to 2021
Table 2: Global Market Value (US$ Million), By End-User, 2022 to 2032
Table 3: Global Market Value (US$ Million), By Offering, 2015 to 2021
Table 4: Global Market Value (US$ Million), By Offering, 2022 to 2032
Table 5: Global Market Value (US$ Million), By Deployment Type, 2015 to 2021
Table 6: Global Market Value (US$ Million), By Deployment Type, 2022 to 2032
Table 7: Global Market Value (US$ Million), By Solution, 2015 to 2021
Table 8: Global Market Value (US$ Million), By Solution, 2022 to 2032
Table 9: Global Market Value (US$ Million), By Enterprise Size, 2015 to 2021
Table 10: Global Market Value (US$ Million), By Enterprise Size, 2022 to 2032
Table 11: Global Market Value (US$ Million), By Industry, 2015 to 2021
Table 12: Global Market Value (US$ Million), By Industry, 2022 to 2032
Table 13: Global Market, By Region, 2015 to 2021
Table 14: Global Market, By Region, 2022 to 2032
Table 15: North America Market Value (US$ Million), By End-User, 2015 to 2021
Table 16: North America Market Value (US$ Million), By End-User, 2022 to 2032
Table 17: North America Market Value (US$ Million), By Offering, 2015 to 2021
Table 18: North America Market Value (US$ Million), By Offering, 2022 to 2032
Table 19: North America Market Value (US$ Million), By Deployment Type, 2015 to 2021
Table 20: North America Market Value (US$ Million), By Deployment Type, 2022 to 2032
Table 21: North America Market Value (US$ Million), By Solution, 2015 to 2021
Table 22: North America Market Value (US$ Million), By Solution, 2022 to 2032
Table 23: North America Market Value (US$ Million), By Enterprise Size, 2015 to 2021
Table 24: North America Market Value (US$ Million), By Enterprise Size, 2022 to 2032
Table 25: North America Market Value (US$ Million), By Industry, 2015 to 2021
Table 26: North America Market Value (US$ Million), By Industry, 2022 to 2032
Table 27: North America Market, By Country, 2015 to 2021
Table 28: North America Market, By Country, 2022 to 2032
Table 29: Latin America Market Value (US$ Million), By End-User, 2015 to 2021
Table 30: Latin America Market Value (US$ Million), By End-User, 2022 to 2032
Table 31: Latin America Market Value (US$ Million), By Offering, 2015 to 2021
Table 32: Latin America Market Value (US$ Million), By Offering, 2022 to 2032
Table 33: Latin America Market Value (US$ Million), By Deployment Type, 2015 to 2021
Table 34: Latin America Market Value (US$ Million), By Deployment Type, 2022 to 2032
Table 35: Latin America Market Value (US$ Million), By Solution, 2015 to 2021
Table 36: Latin America Market Value (US$ Million), By Solution, 2022 to 2032
Table 37: Latin America Market Value (US$ Million), By Enterprise Size, 2015 to 2021
Table 38: Latin America Market Value (US$ Million), By Enterprise Size, 2022 to 2032
Table 39: Latin America Market Value (US$ Million), By Industry, 2015 to 2021
Table 40: Latin America Market Value (US$ Million), By Industry, 2022 to 2032
Table 41: Latin America Market, By Country, 2015 to 2021
Table 42: Latin America Market, By Country, 2022 to 2032
Table 43: Europe Market Value (US$ Million), By End-User, 2015 to 2021
Table 44: Europe Market Value (US$ Million), By End-User, 2022 to 2032
Table 45: Europe Market Value (US$ Million), By Offering, 2015 to 2021
Table 46: Europe Market Value (US$ Million), By Offering, 2022 to 2032
Table 47: Europe Market Value (US$ Million), By Deployment Type, 2015 to 2021
Table 48: Europe Market Value (US$ Million), By Deployment Type, 2022 to 2032
Table 49: Europe Market Value (US$ Million), By Solution, 2015 to 2021
Table 50: Europe Market Value (US$ Million), By Solution, 2022 to 2032
Table 51: Europe Market Value (US$ Million), By Enterprise Size, 2015 to 2021
Table 52: Europe Market Value (US$ Million), By Enterprise Size, 2022 to 2032
Table 53: Europe Market Value (US$ Million), By Industry, 2015 to 2021
Table 54: Europe Market Value (US$ Million), By Industry, 2022 to 2032
Table 55: Europe Market, By Country, 2015 to 2021
Table 56: Europe Market, By Country, 2022 to 2032
Table 57: Asia Pacific Market Value (US$ Million), By End-User, 2015 to 2021
Table 58: Asia Pacific Market Value (US$ Million), By End-User, 2022 to 2032
Table 59: Asia Pacific Market Value (US$ Million), By Offering, 2015 to 2021
Table 60: Asia Pacific Market Value (US$ Million), By Offering, 2022 to 2032
Table 61: Asia Pacific Market Value (US$ Million), By Deployment Type, 2015 to 2021
Table 62: Asia Pacific Market Value (US$ Million), By Deployment Type, 2022 to 2032
Table 63: Asia Pacific Market Value (US$ Million), By Solution, 2015 to 2021
Table 64: Asia Pacific Market Value (US$ Million), By Solution, 2022 to 2032
Table 65: Asia Pacific Market Value (US$ Million), By Enterprise Size, 2015 to 2021
Table 66: Asia Pacific Market Value (US$ Million), By Enterprise Size, 2022 to 2032
Table 67: Asia Pacific Market Value (US$ Million), By Industry, 2015 to 2021
Table 68: Asia Pacific Market Value (US$ Million), By Industry, 2022 to 2032
Table 69: Asia Pacific Market, By Country, 2015 to 2021
Table 70: Asia Pacific Market, By Country, 2022 to 2032
Table 71: MEA Market Value (US$ Million), By End-User, 2015 to 2021
Table 72: MEA Market Value (US$ Million), By End-User, 2022 to 2032
Table 73: MEA Market Value (US$ Million), By Offering, 2015 to 2021
Table 74: MEA Market Value (US$ Million), By Offering, 2022 to 2032
Table 75: MEA Market Value (US$ Million), By Deployment Type, 2015 to 2021
Table 76: MEA Market Value (US$ Million), By Deployment Type, 2022 to 2032
Table 77: MEA Market Value (US$ Million), By Solution, 2015 to 2021
Table 78: MEA Market Value (US$ Million), By Solution, 2022 to 2032
Table 79: MEA Market Value (US$ Million), By Enterprise Size, 2015 to 2021
Table 80: MEA Market Value (US$ Million), By Enterprise Size, 2022 to 2032
Table 81: MEA Market Value (US$ Million), By Industry, 2015 to 2021
Table 82: MEA Market Value (US$ Million), By Industry, 2022 to 2032
Table 83: MEA Market, By Country, 2015 to 2021
Table 84: MEA Market, By Country, 2022 to 2032
Figure 1: Global Market Value (US$ Million) and Year-on-Year Growth, 2015 to 2032
Figure 2: Global Market Absolute $ Historical Gain (2015 to 2021) and Opportunity (2022 to 2032), US$ Million
Figure 3: Global Market Share, By End-User, 2022 & 2032
Figure 4: Global Market Y-o-Y Growth Projections, By End-User - 2022 to 2032
Figure 5: Global Market Attractiveness Index, By End-User - 2022 to 2032
Figure 6: Global Market Share, By Offering, 2022 & 2032
Figure 7: Global Market Y-o-Y Growth Projections, By Offering - 2022 to 2032
Figure 8: Global Market Attractiveness Index, By Offering - 2022 to 2032
Figure 9: Global Market Share, By Solution, 2022 & 2032
Figure 10: Global Market Y-o-Y Growth Projections, By Solution - 2022 to 2032
Figure 11: Global Market Attractiveness Index, By Solution - 2022 to 2032
Figure 12: Global Market Share, By Industry, 2022 & 2032
Figure 13: Global Market Y-o-Y Growth Projections, By Industry - 2022 to 2032
Figure 14: Global Market Attractiveness Index, By Industry - 2022 to 2032
Figure 15: Global Market Share, By Deployment Type, 2022 & 2032
Figure 16: Global Market Y-o-Y Growth Projections, By Deployment Type - 2022 to 2032
Figure 17: Global Market Attractiveness Index, By Deployment Type - 2022 to 2032
Figure 18: Global Market Share, By Enterprise Size, 2022 & 2032
Figure 19: Global Market Y-o-Y Growth Projections, By Enterprise Size - 2022 to 2032
Figure 20: Global Market Attractiveness Index, By Enterprise Size - 2022 to 2032
Figure 21: Global Market Share, By Region, 2022 & 2032
Figure 22: Global Market Y-o-Y Growth Projections, By Region - 2022 to 2032
Figure 23: Global Market Attractiveness Index, By Region - 2022 to 2032
Figure 24: North America Market Value (US$ Million) and Year-on-Year Growth, 2015 to 2032
Figure 25: North America Market Absolute $ Historical Gain (2015 to 2021) and Opportunity (2022 to 2032), US$ Million
Figure 26: North America Market Share, By End-User, 2022 & 2032
Figure 27: North America Market Y-o-Y Growth Projections, By End-User - 2022 to 2032
Figure 28: North America Market Attractiveness Index, By End-User - 2022 to 2032
Figure 29: North America Market Share, By Offering, 2022 & 2032
Figure 30: North America Market Y-o-Y Growth Projections, By Offering - 2022 to 2032
Figure 31: North America Market Attractiveness Index, By Offering - 2022 to 2032
Figure 32: North America Market Share, By Solution, 2022 & 2032
Figure 33: North America Market Y-o-Y Growth Projections, By Solution - 2022 to 2032
Figure 34: North America Market Attractiveness Index, By Solution - 2022 to 2032
Figure 35: North America Market Share, By Deployment Type, 2022 & 2032
Figure 36: North America Market Y-o-Y Growth Projections, By Deployment Type - 2022 to 2032
Figure 37: North America Market Attractiveness Index, By Deployment Type - 2022 to 2032
Figure 38: North America Market Share, By Enterprise Size, 2022 & 2032
Figure 39: North America Market Y-o-Y Growth Projections, By Enterprise Size - 2022 to 2032
Figure 40: North America Market Attractiveness Index, By Enterprise Size - 2022 to 2032
Figure 41: North America Market Share, By Industry, 2022 & 2032
Figure 42: North America Market Y-o-Y Growth Projections, By Industry - 2022 to 2032
Figure 43: North America Market Attractiveness Index, By Industry - 2022 to 2032
Figure 44: North America Market Share, By Country, 2022 & 2032
Figure 45: North America Market Y-o-Y Growth Projections, By Country - 2022 to 2032
Figure 46: North America Market Attractiveness Index, By Country - 2022 to 2032
Figure 47: Latin America Market Value (US$ Million) and Year-on-Year Growth, 2015 to 2032
Figure 48: Latin America Market Absolute $ Historical Gain (2015 to 2021) and Opportunity (2022 to 2032), US$ Million
Figure 49: Latin America Market Share, By End-User, 2022 & 2032
Figure 50: Latin America Market Y-o-Y Growth Projections, By End-User - 2022 to 2032
Figure 51: Latin America Market Attractiveness Index, By End-User - 2022 to 2032
Figure 52: Latin America Market Share, By Offering, 2022 & 2032
Figure 53: Latin America Market Y-o-Y Growth Projections, By Offering - 2022 to 2032
Figure 54: Latin America Market Attractiveness Index, By Offering - 2022 to 2032
Figure 55: Latin America Market Share, By Solution, 2022 & 2032
Figure 56: Latin America Market Y-o-Y Growth Projections, By Solution - 2022 to 2032
Figure 57: Latin America Market Attractiveness Index, By Solution - 2022 to 2032
Figure 58: Latin America Market Share, By Deployment Type, 2022 & 2032
Figure 59: Latin America Market Y-o-Y Growth Projections, By Deployment Type - 2022 to 2032
Figure 60: Latin America Market Attractiveness Index, By Deployment Type - 2022 to 2032
Figure 61: Latin America Market Share, By Enterprise Size, 2022 & 2032
Figure 62: Latin America Market Y-o-Y Growth Projections, By Enterprise Size - 2022 to 2032
Figure 63: Latin America Market Attractiveness Index, By Enterprise Size - 2022 to 2032
Figure 64: Latin America Market Share, By Industry, 2022 & 2032
Figure 65: Latin America Market Y-o-Y Growth Projections, By Industry - 2022 to 2032
Figure 66: Latin America Market Attractiveness Index, By Industry - 2022 to 2032
Figure 67: Latin America Market Share, By Country, 2022 & 2032
Figure 68: Latin America Market Y-o-Y Growth Projections, By Country - 2022 to 2032
Figure 69: Latin America Market Attractiveness Index, By Country - 2022 to 2032
Figure 70: Europe Market Value (US$ Million) and Year-on-Year Growth, 2015 to 2032
Figure 71: Europe Market Absolute $ Historical Gain (2015 to 2021) and Opportunity (2022 to 2032), US$ Million
Figure 72: Europe Market Share, By End-User, 2022 & 2032
Figure 73: Europe Market Y-o-Y Growth Projections, By End-User - 2022 to 2032
Figure 74: Europe Market Attractiveness Index, By End-User - 2022 to 2032
Figure 75: Europe Market Share, By Offering, 2022 & 2032
Figure 76: Europe Market Y-o-Y Growth Projections, By Offering - 2022 to 2032
Figure 77: Europe Market Attractiveness Index, By Offering - 2022 to 2032
Figure 78: Europe Market Share, By Solution, 2022 & 2032
Figure 79: Europe Market Y-o-Y Growth Projections, By Solution - 2022 to 2032
Figure 80: Europe Market Attractiveness Index, By Solution - 2022 to 2032
Figure 81: Europe Market Share, By Deployment Type, 2022 & 2032
Figure 82: Europe Market Y-o-Y Growth Projections, By Deployment Type - 2022 to 2032
Figure 83: Europe Market Attractiveness Index, By Deployment Type - 2022 to 2032
Figure 84: Europe Market Share, By Enterprise Size, 2022 & 2032
Figure 85: Europe Market Y-o-Y Growth Projections, By Enterprise Size - 2022 to 2032
Figure 86: Europe Market Attractiveness Index, By Enterprise Size - 2022 to 2032
Figure 87: Europe Market Share, By Industry, 2022 & 2032
Figure 88: Europe Market Y-o-Y Growth Projections, By Industry - 2022 to 2032
Figure 89: Europe Market Attractiveness Index, By Industry - 2022 to 2032
Figure 90: Europe Market Share, By Country, 2022 & 2032
Figure 91: Europe Market Y-o-Y Growth Projections, By Country - 2022 to 2032
Figure 92: Europe Market Attractiveness Index, By Country - 2022 to 2032
Figure 93: Asia Pacific Market Value (US$ Million) and Year-on-Year Growth, 2015 to 2032
Figure 94: Asia Pacific Market Absolute $ Historical Gain (2015 to 2021) and Opportunity (2022 to 2032), US$ Million
Figure 95: Asia Pacific Market Share, By End-User, 2022 & 2032
Figure 96: Asia Pacific Market Y-o-Y Growth Projections, By End-User - 2022 to 2032
Figure 97: Asia Pacific Market Attractiveness Index, By End-User - 2022 to 2032
Figure 98: Asia Pacific Market Share, By Offering, 2022 & 2032
Figure 99: Asia Pacific Market Y-o-Y Growth Projections, By Offering - 2022 to 2032
Figure 100: Asia Pacific Market Attractiveness Index, By Offering - 2022 to 2032
Figure 101: Asia Pacific Market Share, By Solution, 2022 & 2032
Figure 102: Asia Pacific Market Y-o-Y Growth Projections, By Solution - 2022 to 2032
Figure 103: Asia Pacific Market Attractiveness Index, By Solution - 2022 to 2032
Figure 104: Asia Pacific Market Share, By Deployment Type, 2022 & 2032
Figure 105: Asia Pacific Market Y-o-Y Growth Projections, By Deployment Type - 2022 to 2032
Figure 106: Asia Pacific Market Attractiveness Index, By Deployment Type - 2022 to 2032
Figure 107: Asia Pacific Market Share, By Enterprise Size, 2022 & 2032
Figure 108: Asia Pacific Market Y-o-Y Growth Projections, By Enterprise Size - 2022 to 2032
Figure 109: Asia Pacific Market Attractiveness Index, By Enterprise Size - 2022 to 2032
Figure 110: Asia Pacific Market Share, By Industry, 2022 & 2032
Figure 111: Asia Pacific Market Y-o-Y Growth Projections, By Industry - 2022 to 2032
Figure 112: Asia Pacific Market Attractiveness Index, By Industry - 2022 to 2032
Figure 113: Asia Pacific Market Share, By Country, 2022 & 2032
Figure 114: Asia Pacific Market Y-o-Y Growth Projections, By Country - 2022 to 2032
Figure 115: Asia Pacific Market Attractiveness Index, By Country - 2022 to 2032
Figure 116: MEA Market Value (US$ Million) and Year-on-Year Growth, 2015 to 2032
Figure 117: MEA Market Absolute $ Historical Gain (2015 to 2021) and Opportunity (2022 to 2032), US$ Million
Figure 118: MEA Market Share, By End-User, 2022 & 2032
Figure 119: MEA Market Y-o-Y Growth Projections, By End-User - 2022 to 2032
Figure 120: MEA Market Attractiveness Index, By End-User - 2022 to 2032
Figure 121: MEA Market Share, By Offering, 2022 & 2032
Figure 122: MEA Market Y-o-Y Growth Projections, By Offering - 2022 to 2032
Figure 123: MEA Market Attractiveness Index, By Offering - 2022 to 2032
Figure 124: MEA Market Share, By Solution, 2022 & 2032
Figure 125: MEA Market Y-o-Y Growth Projections, By Solution - 2022 to 2032
Figure 126: MEA Market Attractiveness Index, By Solution - 2022 to 2032
Figure 127: MEA Market Share, By Deployment Type, 2022 & 2032
Figure 128: MEA Market Y-o-Y Growth Projections, By Deployment Type - 2022 to 2032
Figure 129: MEA Market Attractiveness Index, By Deployment Type - 2022 to 2032
Figure 130: MEA Market Share, By Enterprise Size, 2022 & 2032
Figure 131: MEA Market Y-o-Y Growth Projections, By Enterprise Size - 2022 to 2032
Figure 132: MEA Market Attractiveness Index, By Enterprise Size - 2022 to 2032
Figure 133: MEA Market Share, By Industry, 2022 & 2032
Figure 134: MEA Market Y-o-Y Growth Projections, By Industry - 2022 to 2032
Figure 135: MEA Market Attractiveness Index, By Industry - 2022 to 2032
Figure 136: MEA Market Share, By Country, 2022 & 2032
Figure 137: MEA Market Y-o-Y Growth Projections, By Country - 2022 to 2032
Figure 138: MEA Market Attractiveness Index, By Country - 2022 to 2032
The global product analytics software market is likely to value at USD 11.2 Billion in 2021.
The global product analytics software market is estimated to grow at a CAGR of 13.3% from 2022 to 2032.
The global product analytics software market is predicted to procure USD 45.2 Billion from 2022 to 2032.
The software segment is projected to expand at a 13.2% CAGR during the forecast period.
The cloud-based segment is likely to exhibit a 12.7% CAGR from 2022 to 2032.
The USA market is expected to garner USD 15.7 Billion while expanding at a 13.1% CAGR from 2022 to 2032
Explore Similar Insights
Thank you!
You will receive an email from our Business Development Manager. Please be sure to check your SPAM/JUNK folder too.