Dairy Products Packaging Market
Dairy Products packaging Market By Type (Bags and Wraps, Bottles, Cans, Cartons & Boxes, Cups, Films & Wraps, Pouches, Tubes, and Others), Application (Milk, Cheese, Frozen Products, Yogurt, Cream, Butter and Ghee, Ice-cream, Cultured Products, and Others), Material (Glass, Metal, Paperboard & Paper, Plastic, and Others),Distribution Channel (E-Commerce, Specialty Retailers, Supermarkets & Hypermarkets, and Others) & Region for 2022 - 2030
Market Insights on Dairy Products Packaging covering sales outlook, demand forecast and up-to-date key trends
Dairy Products Packaging Market Outlook (2022-2030)
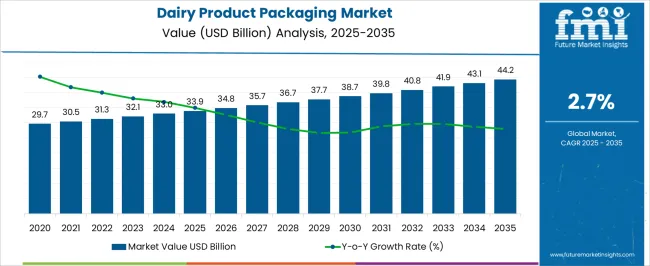
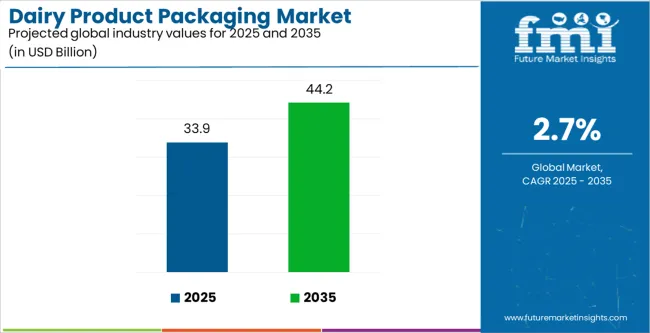
[196 Pages Report] The global dairy products packaging market is likely to progress at a CAGR of 4.5% between 2022 and 2030, reaching US$ 43.6 Bn by the year 2030.
Attribute | Details |
---|---|
Dairy Products Packaging Market Size (2022) | US$ 30.3 Billion |
Projected Market Value (2030) | US$ 43.6 Billion |
Global Market Growth Rate (2022 to 2029) | 4.5% CAGR |
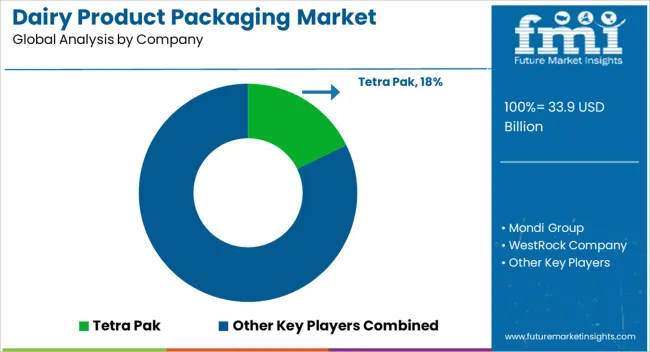
Collective Value Share: Top 5 Companies (2022E) | 13% |
The global dairy product packaging market has seen a volatile market growth during the last few years due to sluggish growth on the part of global dairy production and unbalanced supply & demand. Due to the large inventory of milk in powdered form keeping overall profitability margins low, producers are reluctant to make fresh investments.
Recent trends in global dairy market show that producers are trying to achieve product differentiation through packaging. Eye catching, chick design, and aseptic features are common in present-day dairy products packaging formats. The fierce competition in major markets like Japan and the rest of Asia-Pacific, Western Europe, and North America have led the end users to invest in creative dairy products packaging solutions.
Manufacturers of dairy products packaging are focusing on these changing dynamics of dairy industry and launching innovative packaging products. Demand for flexible packaging is rising worldwide. The stringent regulations related to dairy products packaging & labelling in regions such as European Union, U.S., and Japan is acting as a major restraint to global dairy products packaging market.
Global dairy industry follows seasonality and cyclicity. Dairy product packaging across the globe is majorly divided into seven types of products or packaging formats named liquid cartons, bottles & jars, pouches, cans & jerry cans, cups & tubs, folding cartons, films & wraps, and the other packaging formats.
Don't pay for what you don't need
Customize your report by selecting specific countries or regions and save 30%!
How The Market Progressed Till June 2022?
Particula\rs | Details |
---|---|
H1 2021 | 4.0% |
H1 2022 Projected | 4.2% |
H1 2022 Expected | 4.7% |
BPS Change - H1, 2022 (O) – H1, 2022 (P) | (+) 50 ↑ |
BPS Change – H1, 2022 (O) – H1, 2021 | (+) 70 ↑ |
Future Market Insights predict a comparison and review analysis of the dynamics of the dairy products packaging market, which is principally subjected to an array of industry factors along with a few definite influences concerning hazardous effects of plastics and other non-biodegradable packaging materials is likely to hinder the market growth.
The development that has taken place in the market includes the use of green packaging which is biodegradable and sustainable. In April 2022, Berry Global launched its iconic pot made with recycled plastic for mayonnaise.
The market for dairy product packaging is expected to rise by 70 basis share points (BPS) in H1-2022 (O) against comparison with H1-2021, according to an FMI analysis. However, when comparing the H1-2022 projected and H1-2022 outlook period, a surge in BPS change by 50 BPS has been noticed.
The reasons for the surge in the market are due to its properties such as a high barrier to moisture, light & oxygen, which avoids food from getting contaminated.
Despite these prospects, increasing consumption of dairy products owing to the rising awareness regarding a healthy lifestyle is further expected to fuel market demand for dairy products packaging.
Dairy Products Packaging Demand Analysis (2015 to 2021) Vs Market Outlook (2022 to 2030)
Rising demand for aseptic packaging across the globe is the major factor driving the overall global dairy products packaging market. Innovative aseptic packaging helps to increase the shelf-life of a number of dairy products including liquid dairy products.
Consumers across the globe are increasingly focusing on food safety and enhanced shelf life of dairy products. Increasing demand for sustainable aseptic packaging all over is increasing the share of flexible packaging in global dairy products packaging market. Aseptic packaging formats can range from liquid carton, pouches, cups, bottles, jars, metal, plastic and composite cans and others.
Rising penetration of modern retail such as supermarkets, hypermarkets, convenience stores, discounters and others all over is increasing the penetration of packaging in dairy and other food products. This is subsequently increasing the demand for dairy product packaging. Revenue generated from sales of dairy product packaging is estimated to be worth US$ 30.3 Bn and is expected to expand at a CAGR of 4.5% during the forecast period.
What’s with Choice of Packaging?
Flexible Packaging to be preferred
Though rigid packaging has its advantages like high resistance to oxygen, moisture, and light, flexible packaging is preferred due to lightweight and compact packaging. Superlative performance provided by retortable packages are expected to witness the highest demand for dairy products packaging in the forecast period. Out of the two, flexible packaging is subject to maximum innovations.
Plastic or Paperboard?
Plastic: The Present, Paperboard: The Future
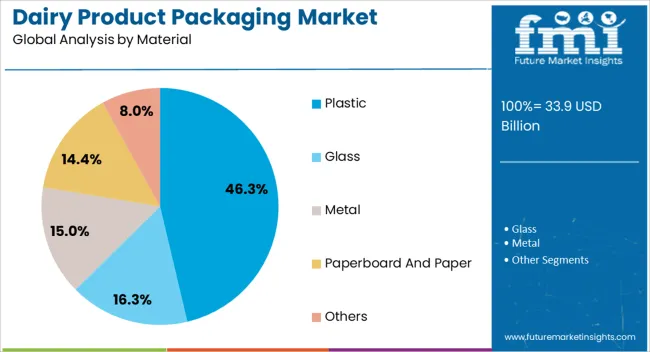
Plastic had been the most preferred raw material for dairy products packaging till recently. As of now 30 diverse kinds of plastics are being made use of for packaging. However, looking at hazards to the environment, the key players are resorting to recyclable plastic packaging. Along these lines, Lett (a Brazil-based brand), in April 2019, did adopt one-liter PET bottles for its Lettico A2 (fermented milk product brand). Thus, diversion from HPDE bottles did happened.
The future belongs to paper and paperboard. Tetra Pak carton packages consist of a few layers of polyethylene and paperboard and aluminium foil. The printing surface gets smooth with addition of paperboard content to these cartons. Aluminium content renders protection against oxygen and light, so as maintain flavors and nutrition of food.
How about Flavored milk and Yogurt?
Flavored Milk and Yogurt to lead from the front
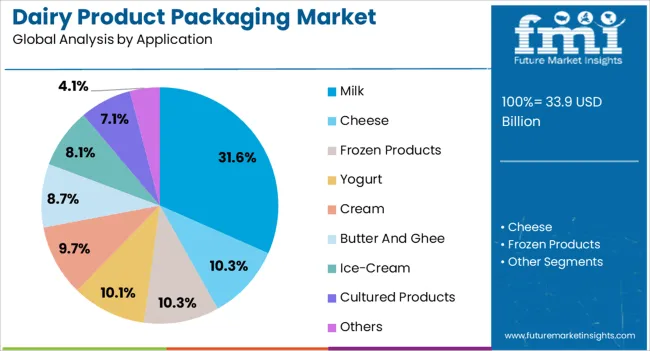
Milk packaging is expected to lead due to rising consumption of milk-based drinks like protein shake, hot chocolate, coffee, and tea. It’s a known fact that milk is rich in calcium, and hence good for bones. Coming to yogurt, the flavoured version is in great demand due to the texture, taste, and aromas associated with it. These flavors include chocolate, mint, coffee, vanilla, and likewise.
Get the data you need at a Fraction of the cost
Personalize your report by choosing insights you need
and save 40%!
Category-wise Insights
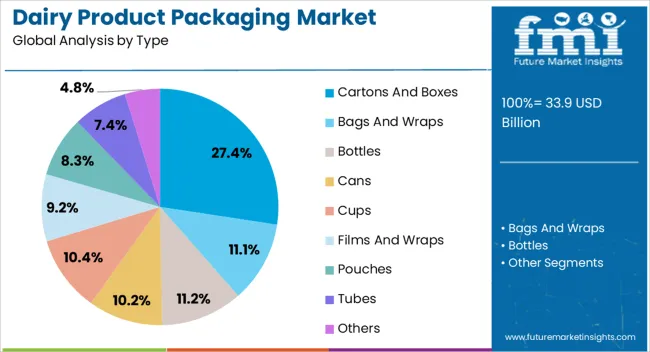
The global market for dairy products packaging is segmented on the basis of product type, material type, and application. On the basis of product type, the global market for dairy product packaging market is categorised into liquid cartons, bottles & jars, pouches, cans & jerry cans, cups & tubs, folding cartons, films & wraps, and others.
Liquid cartons account for the largest market share. On the basis of material type, the global dairy products packaging market is segmented into plastic, paper and paperboard, glass, and metal. The plastic segment is further sub-segmented into polyethylene (PE), polypropylene (PP), polyamide (PA), polyethylene terephthalate (PET) and others such as ethyl vinyl alcohol (EVOH).
Based on application, the global dairy product packaging market is segmented into milk, cheese, cream, butter/ ghee, yogurt, ice cream, and others. Milk and cheese are anticipated to maintain their dominance throughout the forecast period.
Region-wise Insights
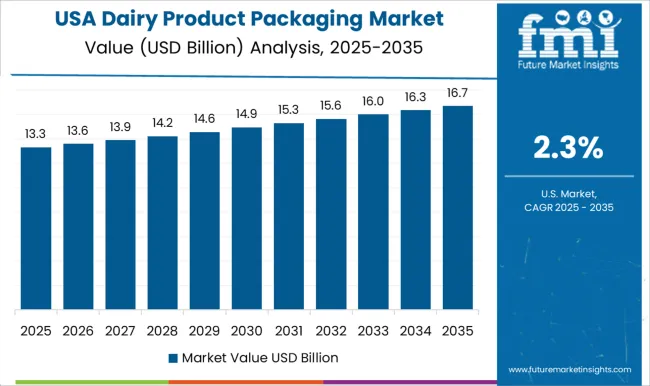
North America holds more than 30% of the market share. This could be credited to growing preference for dairy products like flavoured low-fat yogurt and flavoured milk by the US population. Also, inclination towards cheese is on the rise, especially the Italian varieties like parmesan, mozzarella, and provolone.
Packaged cheese slices are also being consumed at a large scale. Europe is second seeded on the similar grounds. However, the Asia-pacific is expected to grow on an exorbitant note in the dairy products packaging market going forward due to the Gen Z preferring dairy products, cheese and paneer in particular.
How has Covid-19 impacted the Dairy Products Packaging Market?
The outbreak of Covid-19 had definitely applied brakes to the manufacturing industry. However, milk and milk products fall in the category of essential commodities. As such, their production as well as consumption hasn’t stopped. In fact, it has increased manifold as consumers are playing safe with packaged milk products. The risk of contamination is minimal.
Competitive Landscape
The leading players in dairy products packaging market are harping on innovation of products to keep the interest of consumers going.
- Stanpac Inc. has unleashed bio-based polyethylene resin coating (sourced from sugarcane) as a barrier to moisture and vapour constituting recycled fiber in huge concentration.
Report Scope
Attribute | Details |
---|---|
Forecast Period | 2022 to 2030 |
Historical Data Available for | 2015 to 2021 |
Market Analysis | US$ Million/Billion for Value |
Key Regions Covered | North America, Latin America, Europe, South Asia, East Asia, Oceania, and the Middle East & Africa |
Key Countries Covered | USA, Canada, Brazil, Mexico, Germany, UK, France, Italy, Spain, Benelux, Russia, China, Japan, South Korea, India, Thailand, Indonesia, Malaysia, Singapore, China, Japan, South Korea, Australia, New Zealand, Turkey, Egypt, North Africa, South Africa, and GCC Countries |
Key Market Segments Covered | Type, Application, Material, Distribution Channel, and Region |
Key Companies Profiled |
|
Pricing | Available upon Request |
Key Segments Covered in Dairy Products Packaging Industry Research
By Type :
- Bags and Wraps
- Bottles
- Cans
- Cartons & Boxes
- Cups
- Films & Wraps
- Pouches
- Tubes
- Others
By Application :
- Milk
- Cheese
- Frozen Products
- Yogurt
- Cream
- Butter and Ghee
- Ice-cream
- Cultured Products
- Others
By Material :
- Glass
- Metal
- Paperboard & Paper
- Plastic
- Others
By Distribution Channel :
- E-Commerce
- Specialty Retailers
- Supermarkets & Hypermarkets
- Others
By Region :
- North America Dairy Products Packaging Market
- Latin America Dairy Products Packaging Market
- Europe Dairy Products Packaging Market
- East Asia Dairy Products Packaging Market
- South Asia Dairy Products Packaging Market
- Oceania Dairy Products Packaging Market
- Middle East & Africa (MEA) Dairy Products Packaging Market
Frequently Asked Questions
How much is the Dairy Products Packaging market currently worth?
The global Dairy Products Packaging market is expected to be worth US$ 30.3 Bn in the year 2022.
What is the sales forecast for Dairy Products Packaging through 2030?
The market for Dairy Products Packaging is expected to reach US$ 43.6 Bn by 2030, expanding at a CAGR of 4.5%.
What was last 6-year market CAGR for the sales of Dairy Products Packaging?
For 2015-2021, Dairy Products Packaging’ sales expanded at the rate of 3.2%.
Who are the key manufacturing companies for Dairy Products Packaging?
Mondi Group, WestRock Company, Bemis Company Inc., CKS Packaging, Sealed Air Corporation, Barry-Wehmiller Companies, Nampak Ltd., Airlite Plastics, ELOPAK, CLONDALKIN Group Holdings, Saint-Gobain S.A., Saudi Basic Industries Corporation, Stora Enso Oyj, Evergreen Packaging, Ahlstrom, Rexam, Huhtamaki Group, International Paper Company, Consolidated Container Company LLC, Tetra Pak.
What’s with “paper & paperboard”?
Paper & paperboard hold 37.7% of the market share.
Table of Content
1. Executive Summary 1.1. Global Market Outlook 1.2. Demand Side Trends 1.3. Supply Side Trends 1.4. Product Evolution Analysis 1.5. Analysis and Recommendations 2. Market Overview 2.1. Market Taxonomy 2.2. Market Definition 3. Key Market Trends 3.1. Key Trends In the Market 3.1.1. Trend of Growing Consciousness About Grooming Among Consumers 3.1.2. Product Premiumization 3.1.3. Consumers Selecting for At-home Services, Using e-Commerce 3.1.4. Rise in Dairy Trial Ups Consumption 3.1.5. Changing Retail landscape 3.1.6. Packaging, A Key To Brand Differentiation For Dairy 3.1.7. Globalization Impacting Lifestyles 3.2. Product Innovation Trends 3.2.1. Companies Increasingly Spending on R&D and Stepping Up Innovation 3.2.2. Growing Consumer Interest in Multifunctional Products 3.2.3. Prominent Players are Now Diversifying Into other Profitable Segments 3.2.4. Evolution in Product Design 3.3. Future Prospects of Dairy Industry 3.3.1. Factors Fuelling Growth 3.3.2. Influx of Brands 3.3.3. Innovative Distribution & Marketing Strategies 4. Risk and Opportunities in The Market 4.1. Associated Risk 4.1.1. Regulatory Landscape Associated Risk 4.1.2. Standard & Certification Risk 4.1.3. Risk of Alternatives & Advanced Technology 4.2. Opportunities 4.2.1. Niche Within The Existing Product Line 4.2.2. Opportunities In New Product Categories 4.2.3. Latent Opportunities In Established Market 4.3. Key Regulations & Industrial Standards 4.3.1. Rules & Regulations By Countries 4.3.2. Natural Ingredients Overview 4.3.3. Pre-Market Approval 4.3.4. Regulations With Respect To Imports 4.3.5. Labelling Aspects for Dairy 5. Impact of Covid-19 on The Market 5.1. Covid-19 The Situation Now 5.2. The Effects of National Lockdown on Various Countries 5.3. Scenarios For The Economic Impact of The Covid-19 Crisis 5.4. Industries Affected By Coronavirus Outbreak Worldwide 5.5. Projected Recovery for Hardest Hit Sectors 5.6. Coronavirus Impact on The World of Work 5.7. Impact of Covid-19 on Manufacturing Industry 5.8. Manufacturing Purchasing Managers Index, 2022 5.9. Impact of Covid-19 on Supply Chain Worldwide 5.10. Planning & Managing During Covid-19 Pandemic 5.11. Upcoming Pointers Business Leaders Should Focus On 6. Impact of Covid-19 on Dairy Products Packaging Market 6.1. Impact of Covid-19 on Dairy Industry 6.2. Covid-19 Impact v/s Value of Dairy Products Packaging Market, by Country 2022 6.3. Dairy Products Packaging Sales Projection, Q1-Q4 2022 During Covid-19 Pandemic 6.4. Pre Covid-19 Market Forecast v/s Post covid-19 Market Forecast 7. Global Dairy Products Packaging Market Demand Analysis 2015-2021 and Forecast, 2022-2030 7.1. Historical Market Volume (‘000 Tons) Analysis, 2015-2021 7.2. Current and Future Market Volume Projections, 2022-2030 7.2.1. Y-o-Y Growth Trend Analysis 7.2.2. Absolute $ Opportunity Analysis 8. Global Dairy Products Packaging Market - Pricing Analysis 8.1. Regional Pricing Analysis By Product Type 8.2. Pricing Break-up 8.2.1. Manufacturer Level Pricing 8.2.2. Distributor Level Pricing 8.3. Global Average Pricing Analysis Benchmark 9. Global Dairy Products Packaging Market Demand (in Value or Size in US$ Mn) Analysis 2015-2021 and Forecast, 2022-2030 9.1. Historical Market Value (US$ Mn) Analysis, 2015-2021 9.2. Current and Future Market Value (US$ Mn) Projections, 2022-2030 9.2.1. Y-o-Y Growth Trend Analysis 9.2.2. Absolute $ Opportunity Analysis 10. Market Background 10.1. Dairy Industry Overview 10.1.1. Global Dairy Products Consumption Analysis 10.1.2. Top Global Player In Dairy 10.1.3. Import & Export Scenario 10.1.4. Revolution in Dairy Industry 10.2. Generations At A Glance 10.2.1. Silent Generation 10.2.2. Baby Boomers 10.2.3. Gen X 10.2.4. Gen Z 10.2.5. Millennials 10.2.6. Gen 2022 10.3. Macro-Economic Factors 10.3.1. Global GDP Growth Outlook 10.3.2. Global Industry Value Added 10.3.3. Global Consumer Spending Outlook 10.3.4. Global Manufacturing Industry Outlook 10.3.5. Dairy Industry Contribution to GDP Outlook 10.3.6. GDP Growth Rate Analysis 10.3.7. Global E-Commerce Industry Outlook 10.3.8. Per Capita Disposable Income 10.3.9. Global Dairy Industry Outlook 10.4. Forecast Factors - Relevance & Impact 10.4.1. Top Companies Historical Growth 10.4.2. Global Population Growth Outlook 10.4.3. Global Dairy Market Outlook 10.4.4. Global Retail Sales Outlook 10.4.5. Urbanization Growth Outlook 10.5. Industry Value and Supply Chain Analysis 10.5.1. Profit Margin Analysis at each sales point 10.5.2. List & role of key participants 10.5.2.1. Manufacturers 10.5.2.2. Distributors/Retailers 10.6. PESTLE Analysis of Dairy Products Packaging Market 10.7. Porter’s Five Force 10.8. Investment Feasibility Matrix of Dairy Products Packaging Market 10.9. Market Dynamics 10.9.1. Drivers 10.9.2. Restraints 10.9.3. Opportunity Analysis 11. Global Dairy Products Packaging Market Analysis 2015-2021 and Forecast 2022-2030, by Type 11.1. Introduction / Key Findings 11.2. Historical Market Size (US$ Mn) and Volume (‘000 Tons) Analysis By Type, 2015 - 2021 11.3. Current and Future Market Size (US$ Mn) and Volume (‘000 Tons) Analysis and Forecast By Type, 2022 - 2030 11.3.1. Bags and Wraps 11.3.2. Bottles 11.3.3. Cans 11.3.4. Cartons and Boxes 11.3.5. Cups 11.3.6. Films & Wraps 11.3.7. Pouches 11.3.8. Tubes 11.3.9. Other Package Types 11.4. Market Attractiveness Analysis By Type 12. Global Dairy Products Packaging Market Analysis 2015-2021 and Forecast 2022-2030, by Application 12.1. Introduction / Key Findings 12.2. Historical Market Size (US$ Mn) and Volume (‘000 Tons) Analysis By Application, 2015 - 2021 12.3. Current and Future Market Size (US$ Mn) and Volume (‘000 Tons) Analysis and Forecast By Application, 2022 - 2030 12.3.1. Milk 12.3.2. Cheese 12.3.3. Frozen Products 12.3.4. Yogurt 12.3.5. Cream 12.3.6. Butter and ghee 12.3.7. Ice-cream 12.3.8. Cultured Products 12.3.9. Other Applications 12.4. Market Attractiveness Analysis By Application 13. Global Dairy Products Packaging Market Analysis 2015-2021 and Forecast 2022-2030, by Material 13.1. Introduction / Key Findings 13.2. Historical Market Size (US$ Mn) and Volume (‘000 Tons) Analysis By Material, 2015 - 2021 13.3. Current and Future Market Size (US$ Mn) and Volume (‘000 Tons) Analysis and Forecast By Material, 2022 - 2030 13.3.1. Glass 13.3.2. Metal 13.3.3. Paperboard & Paper 13.3.4. Plactic 13.3.5. Other Materials 13.4. Market Attractiveness Analysis By Material 14. Global Dairy Products Packaging Market Analysis 2015-2021 and Forecast 2022-2030, by Distribution Channel 14.1. Introduction / Key Findings 14.2. Historical Market Size (US$ Mn) and Volume (‘000 Tons) Analysis By Distribution Channel, 2015 - 2021 14.3. Current and Future Market Size (US$ Mn) and Volume (‘000 Tons) Analysis and Forecast By Distribution Channel, 2022 - 2030 14.3.1. E-Commerce 14.3.2. Specialty Retailers 14.3.3. Supermarket & Hypermarket 14.3.4. Other 14.4. Market Attractiveness Analysis By Distribution Channel 15. Global Dairy Products Packaging Market Analysis 2015-2021 and Forecast 2022-2030, by Region 15.1. Introduction 15.2. Historical Market Size (US$ Mn) and Volume (‘000 Tons) Analysis By Region, 2015 - 2021 15.3. Current Market Size (US$ Mn) and Volume (‘000 Tons) Analysis and Forecast By Region, 2022 - 2030 15.3.1. North America 15.3.2. Latin America 15.3.3. Europe 15.3.4. South Asia & Pacific 15.3.5. East Asia 15.3.6. Middle East & Africa 15.4. Market Attractiveness Analysis By Region 16. North America Dairy Products Packaging Market Analysis 2015-2021 and Forecast 2022-2030 16.1. Introduction 16.2. Pricing Analysis 16.3. Historical Market Size (US$ Mn) and Volume Trend Analysis By Market Taxonomy, 2015 - 2021 16.4. Market Size (US$ Mn) and Volume Forecast By Market Taxonomy, 2022 - 2030 16.4.1. By Country 16.4.1.1. U.S. 16.4.1.2. Canada 16.4.2. By Type 16.4.3. By Application 16.4.4. By Material 16.4.5. By Distribution Channel 16.5. Market Attractiveness Analysis 16.5.1. By Country 16.5.1. By Type 16.5.2. By Application 16.5.3. By Material 16.5.4. By Distribution Channel 16.6. Market Trends 16.7. Key Market Participants - Intensity Mapping 17. Latin America Dairy Products Packaging Market Analysis 2015-2021 and Forecast 2022-2030 17.1. Introduction 17.2. Pricing Analysis 17.3. Historical Market Size (US$ Mn) and Volume Trend Analysis By Market Taxonomy, 2015 - 2021 17.4. Market Size (US$ Mn) and Volume Forecast By Market Taxonomy, 2022 - 2030 17.4.1. By Country 17.4.1.1. Brazil 17.4.1.2. Mexico 17.4.1.3. Rest of Latin America 17.4.2. By Type 17.4.3. By Application 17.4.4. By Material 17.4.5. By Distribution Channel 17.5. Market Attractiveness Analysis 17.5.1. By Country 17.5.2. By Type 17.5.3. By Application 17.5.4. By Material 17.5.5. By Distribution Channel 17.6. Market Trends 17.7. Key Market Participants - Intensity Mapping 18. Europe Dairy Products Packaging Market Analysis 2015-2021 and Forecast 2022-2030 18.1. Introduction 18.2. Pricing Analysis 18.3. Historical Market Size (US$ Mn) and Volume Trend Analysis By Market Taxonomy, 2015 - 2021 18.4. Market Size (US$ Mn) and Volume Forecast By Market Taxonomy, 2022 - 2030 18.4.1. By Country 18.4.1.1. Germany 18.4.1.2. Italy 18.4.1.3. France 18.4.1.4. U.K. 18.4.1.5. Spain 18.4.1.6. Rest of Europe 18.4.2. By Type 18.4.3. By Application 18.4.4. By Material 18.4.5. By Distribution Channel 18.5. Market Attractiveness Analysis 18.5.1. By Country 18.5.1. By Type 18.5.2. By Application 18.5.3. By Material 18.5.4. By Distribution Channel 18.6. Market Trends 18.7. Key Market Participants - Intensity Mapping 19. South Asia & Pacific Dairy Products Packaging Market Analysis 2015-2021 and Forecast 2022-2030 19.1. Introduction 19.2. Pricing Analysis 19.3. Historical Market Size (US$ Mn) and Volume Trend Analysis By Market Taxonomy, 2015 - 2021 19.4. Market Size (US$ Mn) and Volume Forecast By Market Taxonomy, 2022 - 2030 19.4.1. By Country 19.4.1.1. India 19.4.1.2. Thailand 19.4.1.3. Indonesia 19.4.1.4. Malaysia 19.4.1.5. Australia & New Zealand 19.4.1.6. Rest of South Asia 19.4.2. By Type 19.4.3. By Application 19.4.4. By Material 19.4.5. By Distribution Channel 19.5. Market Attractiveness Analysis 19.5.1. By Country 19.5.1. By Type 19.5.2. By Application 19.5.3. By Material 19.5.4. By Distribution Channel 19.6. Market Trends 19.7. Key Market Participants - Intensity Mapping 20. East Asia Dairy Products Packaging Market Analysis 2015-2021 and Forecast 2022-2030 20.1. Introduction 20.2. Pricing Analysis 20.3. Historical Market Size (US$ Mn) and Volume Trend Analysis By Market Taxonomy, 2015 - 2021 20.4. Market Size (US$ Mn) and Volume Forecast By Market Taxonomy, 2022 - 2030 20.4.1. By Country 20.4.1.1. China 20.4.1.2. Japan 20.4.1.3. South Korea 20.4.2. By Type 20.4.3. By Application 20.4.4. By Material 20.4.5. By Distribution Channel 20.5. Market Attractiveness Analysis 20.5.1. By Country 20.5.1. By Type 20.5.2. By Application 20.5.3. By Material 20.5.4. By Distribution Channel 20.6. Market Trends 20.7. Key Market Participants - Intensity Mapping 21. Middle East and Africa Dairy Products Packaging Market Analysis 2015-2021 and Forecast 2022-2030 21.1. Introduction 21.2. Pricing Analysis 21.3. Historical Market Size (US$ Mn) and Volume Trend Analysis By Market Taxonomy, 2015 - 2021 21.4. Market Size (US$ Mn) and Volume Forecast By Market Taxonomy, 2022 - 2030 21.4.1. By Country 21.4.1.1. GCC Countries 21.4.1.2. South Africa 21.4.1.3. Israel 21.4.1.4. Rest of Middle East and Africa 21.4.2. By Type 21.4.3. By Application 21.4.4. By Material 21.4.5. By Distribution Channel 21.5. Market Attractiveness Analysis 21.5.1. By Country 21.5.1. By Type 21.5.2. By Application 21.5.3. By Material 21.5.4. By Distribution Channel 21.6. Market Trends 21.7. Key Market Participants - Intensity Mapping 22. Market Structure Analysis 22.1. Market Analysis by Tier of Companies (Dairy Products Packaging) 22.2. Market Concentration 22.3. Market Share Analysis of Top Players 22.4. Market Presence Analysis 22.4.1. By Regional footprint of Players 22.4.2. Product foot print by Players 22.4.3. Channel Foot Print by Players 23. Competition Analysis 23.1. Competition Dashboard 23.2. Pricing Analysis by Competition 23.3. Competition Benchmarking 23.4. Competition Deep Dive 23.4.1. Mondi Group 23.4.1.1. Overview 23.4.1.2. Product Portfolio 23.4.1.3. Profitability by Market Segments (Product/Channel/Region) 23.4.1.4. Sales Footprint 23.4.1.5. Strategy Overview 23.4.1.5.1. Marketing Strategy 23.4.1.5.2. Product Strategy 23.4.1.5.3. Channel Strategy 23.4.2. WestRock Company 23.4.2.1. Overview 23.4.2.2. Product Portfolio 23.4.2.3. Profitability by Market Segments (Product/Channel/Region) 23.4.2.4. Sales Footprint 23.4.2.5. Strategy Overview 23.4.2.5.1. Marketing Strategy 23.4.2.5.2. Product Strategy 23.4.2.5.3. Channel Strategy 23.4.3. Bemis Company, Inc. 23.4.3.1. Overview 23.4.3.2. Product Portfolio 23.4.3.3. Profitability by Market Segments (Product/Channel/Region) 23.4.3.4. Sales Footprint 23.4.3.5. Strategy Overview 23.4.3.5.1. Marketing Strategy 23.4.3.5.2. Product Strategy 23.4.3.5.3. Channel Strategy 23.4.4. CKS PACKAGING 23.4.4.1. Overview 23.4.4.2. Product Portfolio 23.4.4.3. Profitability by Market Segments (Product/Channel/Region) 23.4.4.4. Sales Footprint 23.4.4.5. Strategy Overview 23.4.4.5.1. Marketing Strategy 23.4.4.5.2. Product Strategy 23.4.4.5.3. Channel Strategy 23.4.5. Barry-Wehmiller Companies 23.4.5.1. Overview 23.4.5.2. Product Portfolio 23.4.5.3. Profitability by Market Segments (Product/Channel/Region) 23.4.5.4. Sales Footprint 23.4.5.5. Strategy Overview 23.4.5.5.1. Marketing Strategy 23.4.5.5.2. Product Strategy 23.4.5.5.3. Channel Strategy 23.4.6. Sealed Air Corporation 23.4.6.1. Overview 23.4.6.2. Product Portfolio 23.4.6.3. Profitability by Market Segments (Product/Channel/Region) 23.4.6.4. Sales Footprint 23.4.6.5. Strategy Overview 23.4.6.5.1. Marketing Strategy 23.4.6.5.2. Product Strategy 23.4.6.5.3. Channel Strategy 23.4.7. Nampak Ltd. 23.4.7.1. Overview 23.4.7.2. Product Portfolio 23.4.7.3. Profitability by Market Segments (Product/Channel/Region) 23.4.7.4. Sales Footprint 23.4.7.5. Strategy Overview 23.4.7.5.1. Marketing Strategy 23.4.7.5.2. Product Strategy 23.4.7.5.3. Channel Strategy 23.4.8. Airlite Plastics 23.4.8.1. Overview 23.4.8.2. Product Portfolio 23.4.8.3. Profitability by Market Segments (Product/Channel/Region) 23.4.8.4. Sales Footprint 23.4.8.5. Strategy Overview 23.4.8.5.1. Marketing Strategy 23.4.8.5.2. Product Strategy 23.4.8.5.3. Channel Strategy 23.4.9. ELOPAK 23.4.9.1. Overview 23.4.9.2. Product Portfolio 23.4.9.3. Profitability by Market Segments (Product/Channel/Region) 23.4.9.4. Sales Footprint 23.4.9.5. Strategy Overview 23.4.9.5.1. Marketing Strategy 23.4.9.5.2. Product Strategy 23.4.9.5.3. Channel Strategy 23.4.10. CLONDALKIN GROUP HOLDINGS 23.4.10.1. Overview 23.4.10.2. Product Portfolio 23.4.10.3. Profitability by Market Segments (Product/Channel/Region) 23.4.10.4. Sales Footprint 23.4.10.5. Strategy Overview 23.4.10.5.1. Marketing Strategy 23.4.10.5.2. Product Strategy 23.4.10.5.3. Channel Strategy 23.4.11. Saint-Gobain S.A 23.4.11.1. Overview 23.4.11.2. Product Portfolio 23.4.11.3. Profitability by Market Segments (Product/Channel/Region) 23.4.11.4. Sales Footprint 23.4.11.5. Strategy Overview 23.4.11.5.1. Marketing Strategy 23.4.11.5.2. Product Strategy 23.4.11.5.3. Channel Strategy 23.4.12. Stora Enso Oyj 23.4.12.1. Overview 23.4.12.2. Product Portfolio 23.4.12.3. Profitability by Market Segments (Product/Channel/Region) 23.4.12.4. Sales Footprint 23.4.12.5. Strategy Overview 23.4.12.5.1. Marketing Strategy 23.4.12.5.2. Product Strategy 23.4.12.5.3. Channel Strategy 23.4.13. Saudi Basic Industries Corporation 23.4.13.1. Overview 23.4.13.2. Product Portfolio 23.4.13.3. Profitability by Market Segments (Product/Channel/Region) 23.4.13.4. Sales Footprint 23.4.13.5. Strategy Overview 23.4.13.5.1. Marketing Strategy 23.4.13.5.2. Product Strategy 23.4.13.5.3. Channel Strategy 23.4.14. Ahlstrom 23.4.14.1. Overview 23.4.14.2. Product Portfolio 23.4.14.3. Profitability by Market Segments (Product/Channel/Region) 23.4.14.4. Sales Footprint 23.4.14.5. Strategy Overview 23.4.14.5.1. Marketing Strategy 23.4.14.5.2. Product Strategy 23.4.14.5.3. Channel Strategy 23.4.15. EVERGREEN PACKAGING 23.4.15.1. Overview 23.4.15.2. Product Portfolio 23.4.15.3. Profitability by Market Segments (Product/Channel/Region) 23.4.15.4. Sales Footprint 23.4.15.5. Strategy Overview 23.4.15.5.1. Marketing Strategy 23.4.15.5.2. Product Strategy 23.4.15.5.3. Channel Strategy 23.4.16. Huhtamaki Group 23.4.16.1. Overview 23.4.16.2. Product Portfolio 23.4.16.3. Profitability by Market Segments (Product/Channel/Region) 23.4.16.4. Sales Footprint 23.4.16.5. Strategy Overview 23.4.16.5.1. Marketing Strategy 23.4.16.5.2. Product Strategy 23.4.16.5.3. Channel Strategy 23.4.17. Rexam 23.4.17.1. Overview 23.4.17.2. Product Portfolio 23.4.17.3. Profitability by Market Segments (Product/Channel/Region) 23.4.17.4. Sales Footprint 23.4.17.5. Strategy Overview 23.4.17.5.1. Marketing Strategy 23.4.17.5.2. Product Strategy 23.4.17.5.3. Channel Strategy 23.4.18. International Paper Company 23.4.18.1. Overview 23.4.18.2. Product Portfolio 23.4.18.3. Profitability by Market Segments (Product/Channel/Region) 23.4.18.4. Sales Footprint 23.4.18.5. Strategy Overview 23.4.18.5.1. Marketing Strategy 23.4.18.5.2. Product Strategy 23.4.18.5.3. Channel Strategy 23.4.19. Consolidated Container Company LLC 23.4.19.1. Overview 23.4.19.2. Product Portfolio 23.4.19.3. Profitability by Market Segments (Product/Channel/Region) 23.4.19.4. Sales Footprint 23.4.19.5. Strategy Overview 23.4.19.5.1. Marketing Strategy 23.4.19.5.2. Product Strategy 23.4.19.5.3. Channel Strategy 23.4.20. TETRA PAK 23.4.20.1. Overview 23.4.20.2. Product Portfolio 23.4.20.3. Profitability by Market Segments (Product/Channel/Region) 23.4.20.4. Sales Footprint 23.4.20.5. Strategy Overview 23.4.20.5.1. Marketing Strategy 23.4.20.5.2. Product Strategy 23.4.20.5.3. Channel Strategy 23.4.21. Others (As Per Request) 24. Assumptions and Acronyms Used 25. Research Methodology
Don't pay for what you don't need
Customize your report by selecting specific countries or regions and save 30%!
List of Tables
Table 1: Global Dairy Products Packaging Market Value (US$ Mn) Forecast, By Type, 2015–2030 Table 2: Global Dairy Products Packaging Market Volume (‘000 Tons) Forecast, By Type, 2015–2030 Table 3: Global Dairy Products Packaging Market Value (US$ Mn) Forecast, By Application, 2015–2030 Table 4: Global Dairy Products Packaging Market Volume (‘000 Tons) Forecast, By Application, 2015–2030 Table 5: Global Dairy Products Packaging Market Value (US$ Mn) Forecast, By Material, 2015–2030 Table 6: Global Dairy Products Packaging Market Volume (‘000 Tons) Forecast, By Material, 2015–2030 Table 7: Global Dairy Products Packaging Market Value (US$ Mn) Forecast, By Distribution Channel, 2015–2030 Table 8: Global Dairy Products Packaging Market Volume (‘000 Tons) Forecast, By Distribution Channel, 2015–2030 Table 9: Global Dairy Products Packaging Market Value (US$ Mn) Forecast, By Region, 2015–2030 Table 10: Global Dairy Products Packaging Market Volume (‘000 Tons) Forecast, By Region, 2015–2030 Table 11: North America Dairy Products Packaging Market Value (US$ Mn) Forecast, By Type, 2015–2030 Table 12: North America Dairy Products Packaging Market Volume (‘000 Tons) Forecast, By Type, 2015–2030 Table 13: North America Dairy Products Packaging Market Value (US$ Mn) Forecast, By Application, 2015–2030 Table 14: North America Dairy Products Packaging Market Volume (‘000 Tons) Forecast, By Application, 2015–2030 Table 15: North America Dairy Products Packaging Market Value (US$ Mn) Forecast, By Material, 2015–2030 Table 16: North America Dairy Products Packaging Market Volume (‘000 Tons) Forecast, By Material, 2015–2030 Table 17: North America Dairy Products Packaging Market Value (US$ Mn) Forecast, By Distribution Channel, 2015–2030 Table 18: North America Dairy Products Packaging Market Volume (‘000 Tons) Forecast, By Distribution Channel, 2015–2030 Table 19: North America Dairy Products Packaging Market Value (US$ Mn) Forecast, By Region, 2015–2030 Table 20: North America Dairy Products Packaging Market Volume (‘000 Tons) Forecast, By Region, 2015–2030 Table 21: Latin America Dairy Products Packaging Market Value (US$ Mn) Forecast, By Type, 2015–2030 Table 22: Latin America Dairy Products Packaging Market Volume (‘000 Tons) Forecast, By Type, 2015–2030 Table 23: Latin America Dairy Products Packaging Market Value (US$ Mn) Forecast, By Application, 2015–2030 Table 24: Latin America Dairy Products Packaging Market Volume (‘000 Tons) Forecast, By Application, 2015–2030 Table 25: Latin America Dairy Products Packaging Market Value (US$ Mn) Forecast, By Material, 2015–2030 Table 26: Latin America Dairy Products Packaging Market Volume (‘000 Tons) Forecast, By Material, 2015–2030 Table 27: Latin America Dairy Products Packaging Market Value (US$ Mn) Forecast, By Distribution Channel, 2015–2030 Table 28: Latin America Dairy Products Packaging Market Volume (‘000 Tons) Forecast, By Distribution Channel, 2015–2030 Table 29: Latin America Dairy Products Packaging Market Value (US$ Mn) Forecast, By Region, 2015–2030 Table 30: Latin America Dairy Products Packaging Market Volume (‘000 Tons) Forecast, By Region, 2015–2030 Table 31: Europe Dairy Products Packaging Market Value (US$ Mn) Forecast, By Type, 2015–2030 Table 32: Europe Dairy Products Packaging Market Volume (‘000 Tons) Forecast, By Type, 2015–2030 Table 33: Europe Dairy Products Packaging Market Value (US$ Mn) Forecast, By Application, 2015–2030 Table 34: Europe Dairy Products Packaging Market Volume (‘000 Tons) Forecast, By Application, 2015–2030 Table 35: Europe Dairy Products Packaging Market Value (US$ Mn) Forecast, By Material, 2015–2030 Table 36: Europe Dairy Products Packaging Market Volume (‘000 Tons) Forecast, By Material, 2015–2030 Table 37: Europe Dairy Products Packaging Market Value (US$ Mn) Forecast, By Distribution Channel, 2015–2030 Table 38: Europe Dairy Products Packaging Market Volume (‘000 Tons) Forecast, By Distribution Channel, 2015–2030 Table 39: Europe Dairy Products Packaging Market Value (US$ Mn) Forecast, By Region, 2015–2030 Table 40: Europe Dairy Products Packaging Market Volume (‘000 Tons) Forecast, By Region, 2015–2030 Table 41: East Asia Dairy Products Packaging Market Value (US$ Mn) Forecast, By Type, 2015–2030 Table 42: East Asia Dairy Products Packaging Market Volume (‘000 Tons) Forecast, By Type, 2015–2030 Table 43: East Asia Dairy Products Packaging Market Value (US$ Mn) Forecast, By Application, 2015–2030 Table 44: East Asia Dairy Products Packaging Market Volume (‘000 Tons) Forecast, By Application, 2015–2030 Table 45: East Asia Dairy Products Packaging Market Value (US$ Mn) Forecast, By Material, 2015–2030 Table 46: East Asia Dairy Products Packaging Market Volume (‘000 Tons) Forecast, By Material, 2015–2030 Table 47: East Asia Dairy Products Packaging Market Value (US$ Mn) Forecast, By Distribution Channel, 2015–2030 Table 48: East Asia Dairy Products Packaging Market Volume (‘000 Tons) Forecast, By Distribution Channel, 2015–2030 Table 49: East Asia Dairy Products Packaging Market Value (US$ Mn) Forecast, By Region, 2015–2030 Table 50: East Asia Dairy Products Packaging Market Volume (‘000 Tons) Forecast, By Region, 2015–2030 Table 51: South Asia Dairy Products Packaging Market Value (US$ Mn) Forecast, By Type, 2015–2030 Table 52: South Asia Dairy Products Packaging Market Volume (‘000 Tons) Forecast, By Type, 2015–2030 Table 53: South Asia Dairy Products Packaging Market Value (US$ Mn) Forecast, By Application, 2015–2030 Table 54: South Asia Dairy Products Packaging Market Volume (‘000 Tons) Forecast, By Application, 2015–2030 Table 55: South Asia Dairy Products Packaging Market Value (US$ Mn) Forecast, By Material, 2015–2030 Table 56: South Asia Dairy Products Packaging Market Volume (‘000 Tons) Forecast, By Material, 2015–2030 Table 57: South Asia Dairy Products Packaging Market Value (US$ Mn) Forecast, By Distribution Channel, 2015–2030 Table 58: South Asia Dairy Products Packaging Market Volume (‘000 Tons) Forecast, By Distribution Channel, 2015–2030 Table 59: South Asia Dairy Products Packaging Market Value (US$ Mn) Forecast, By Region, 2015–2030 Table 60: South Asia Dairy Products Packaging Market Volume (‘000 Tons) Forecast, By Region, 2015–2030 Table 61: Middle East Africa Dairy Products Packaging Market Value (US$ Mn) Forecast, By Type, 2015–2030 Table 62: Middle East Africa Dairy Products Packaging Market Volume (‘000 Tons) Forecast, By Type, 2015–2030 Table 63: Middle East Africa Dairy Products Packaging Market Value (US$ Mn) Forecast, By Application, 2015–2030 Table 64: Middle East Africa Dairy Products Packaging Market Volume (‘000 Tons) Forecast, By Application, 2015–2030 Table 65: Middle East Africa Dairy Products Packaging Market Value (US$ Mn) Forecast, By Material, 2015–2030 Table 66: Middle East Africa Dairy Products Packaging Market Volume (‘000 Tons) Forecast, By Material, 2015–2030 Table 67: Middle East Africa Dairy Products Packaging Market Value (US$ Mn) Forecast, By Distribution Channel, 2015–2030 Table 68: Middle East Africa Dairy Products Packaging Market Volume (‘000 Tons) Forecast, By Distribution Channel, 2015–2030 Table 69: Middle East Africa Dairy Products Packaging Market Value (US$ Mn) Forecast, By Region, 2015–2030 Table 70: Middle East Africa Dairy Products Packaging Market Volume (‘000 Tons) Forecast, By Region, 2015–2030
List of Charts
Figure 1: Global Dairy Products Packaging Market Value (US$ Mn) and Volume (‘000 Tons) Analysis, 2015-2021 Figure 2: Global Dairy Products Packaging Market Value (US$ Mn) and Volume (‘000 Tons) Forecast, 2022-2030 Figure 3: Global Dairy Products Packaging Market Value (US$ Mn) Analysis, 2015-2021 Figure 4: Global Dairy Products Packaging Market Value (US$ Mn) Forecast, 2022-2030 Figure 5: Global Dairy Products Packaging Market Absolute $ Opportunity Value (US$ Mn), 2022-2030 Figure 6: Global Dairy Products Packaging Market Value (US$ Mn) Analysis, By Type 2015-2030 Figure 7: Global Dairy Products Packaging Market Volume (‘000 Tons) Analysis, By Type 2015-2030 Figure 8: Global Dairy Products Packaging Market Y-o-Y Growth (%) Projections, By Type 2022-2030 Figure 9: Global Dairy Products Packaging Market Attractiveness, By Type 2022-2030 Figure 10: Global Dairy Products Packaging Market Value (US$ Mn) Analysis, By Application 2015-2030 Figure 11: Global Dairy Products Packaging Market Volume (‘000 Tons) Analysis, By Application 2015-2030 Figure 12: Global Dairy Products Packaging Market Y-o-Y Growth (%) Projections, By Application 2022-2030 Figure 13: Global Dairy Products Packaging Market Attractiveness, By Application 2022-2030 Figure 14: Global Dairy Products Packaging Market Value (US$ Mn) Analysis, By Material 2015-2030 Figure 15: Global Dairy Products Packaging Market Volume (‘000 Tons) Analysis, By Material 2015-2030 Figure 16: Global Dairy Products Packaging Market Y-o-Y Growth (%) Projections, By Material 2022-2030 Figure 17: Global Dairy Products Packaging Market Attractiveness, By Material 2022-2030 Figure 18: Global Dairy Products Packaging Market Value (US$ Mn) Analysis, By Distribution Channel 2015-2030 Figure 19: Global Dairy Products Packaging Market Volume (‘000 Tons) Analysis, By Distribution Channel 2015-2030 Figure 20: Global Dairy Products Packaging Market Y-o-Y Growth (%) Projections, By Distribution Channel 2022-2030 Figure 21: Global Dairy Products Packaging Market Attractiveness, By Distribution Channel 2022-2030 Figure 22: Global Dairy Products Packaging Market Value (US$ Mn) Analysis, By Region 2015-2030 Figure 23: Global Dairy Products Packaging Market Volume (‘000 Tons) Analysis, By Region 2015-2030 Figure 24: Global Dairy Products Packaging Market Y-o-Y Growth (%) Projections, By Region 2022-2030 Figure 25: Global Dairy Products Packaging Market Attractiveness, By Region 2022-2030 Figure 26: North America Dairy Products Packaging Market Value (US$ Mn) Analysis, By Type 2015-2030 Figure 27: North America Dairy Products Packaging Market Volume (‘000 Tons) Analysis, By Type 2015-2030 Figure 28: North America Dairy Products Packaging Market Y-o-Y Growth (%) Projections, By Type 2022-2030 Figure 29: North America Dairy Products Packaging Market Attractiveness, By Type 2022-2030 Figure 30: North America Dairy Products Packaging Market Value (US$ Mn) Analysis, By Application 2015-2030 Figure 31: North America Dairy Products Packaging Market Volume (‘000 Tons) Analysis, By Application 2015-2030 Figure 32: North America Dairy Products Packaging Market Y-o-Y Growth (%) Projections, By Application 2022-2030 Figure 33: North America Dairy Products Packaging Market Attractiveness, By Application 2022-2030 Figure 34: North America Dairy Products Packaging Market Value (US$ Mn) Analysis, By Material 2015-2030 Figure 35: North America Dairy Products Packaging Market Volume (‘000 Tons) Analysis, By Material 2015-2030 Figure 36: North America Dairy Products Packaging Market Y-o-Y Growth (%) Projections, By Material 2022-2030 Figure 37: North America Dairy Products Packaging Market Attractiveness, By Material 2022-2030 Figure 38: North America Dairy Products Packaging Market Value (US$ Mn) Analysis, By Distribution Channel 2015-2030 Figure 39: North America Dairy Products Packaging Market Volume (‘000 Tons) Analysis, By Distribution Channel 2015-2030 Figure 40: North America Dairy Products Packaging Market Y-o-Y Growth (%) Projections, By Distribution Channel 2022-2030 Figure 41: North America Dairy Products Packaging Market Attractiveness, By Distribution Channel 2022-2030 Figure 42: North America Dairy Products Packaging Market Value (US$ Mn) Analysis, By Region 2015-2030 Figure 43: North America Dairy Products Packaging Market Volume (‘000 Tons) Analysis, By Region 2015-2030 Figure 44: North America Dairy Products Packaging Market Y-o-Y Growth (%) Projections, By Region 2022-2030 Figure 45: North America Dairy Products Packaging Market Attractiveness, By Region 2022-2030 Figure 46: Latin America Dairy Products Packaging Market Value (US$ Mn) Analysis, By Type 2015-2030 Figure 47: Latin America Dairy Products Packaging Market Volume (‘000 Tons) Analysis, By Type 2015-2030 Figure 48: Latin America Dairy Products Packaging Market Y-o-Y Growth (%) Projections, By Type 2022-2030 Figure 49: Latin America Dairy Products Packaging Market Attractiveness, By Type 2022-2030 Figure 50: Latin America Dairy Products Packaging Market Value (US$ Mn) Analysis, By Application 2015-2030 Figure 51: Latin America Dairy Products Packaging Market Volume (‘000 Tons) Analysis, By Application 2015-2030 Figure 52: Latin America Dairy Products Packaging Market Y-o-Y Growth (%) Projections, By Application 2022-2030 Figure 53: Latin America Dairy Products Packaging Market Attractiveness, By Application 2022-2030 Figure 54: Latin America Dairy Products Packaging Market Value (US$ Mn) Analysis, By Material 2015-2030 Figure 55: Latin America Dairy Products Packaging Market Volume (‘000 Tons) Analysis, By Material 2015-2030 Figure 56: Latin America Dairy Products Packaging Market Y-o-Y Growth (%) Projections, By Material 2022-2030 Figure 57: Latin America Dairy Products Packaging Market Attractiveness, By Material 2022-2030 Figure 58: Latin America Dairy Products Packaging Market Value (US$ Mn) Analysis, By Distribution Channel 2015-2030 Figure 59: Latin America Dairy Products Packaging Market Volume (‘000 Tons) Analysis, By Distribution Channel 2015-2030 Figure 60: Latin America Dairy Products Packaging Market Y-o-Y Growth (%) Projections, By Distribution Channel 2022-2030 Figure 61: Latin America Dairy Products Packaging Market Attractiveness, By Distribution Channel 2022-2030 Figure 62: Latin America Dairy Products Packaging Market Value (US$ Mn) Analysis, By Region 2015-2030 Figure 63: Latin America Dairy Products Packaging Market Volume (‘000 Tons) Analysis, By Region 2015-2030 Figure 64: Latin America Dairy Products Packaging Market Y-o-Y Growth (%) Projections, By Region 2022-2030 Figure 65: Latin America Dairy Products Packaging Market Attractiveness, By Region 2022-2030 Figure 66: Europe Dairy Products Packaging Market Value (US$ Mn) Analysis, By Type 2015-2030 Figure 67: Europe Dairy Products Packaging Market Volume (‘000 Tons) Analysis, By Type 2015-2030 Figure 68: Europe Dairy Products Packaging Market Y-o-Y Growth (%) Projections, By Type 2022-2030 Figure 69: Europe Dairy Products Packaging Market Attractiveness, By Type 2022-2030 Figure 70: Europe Dairy Products Packaging Market Value (US$ Mn) Analysis, By Application 2015-2030 Figure 71: Europe Dairy Products Packaging Market Volume (‘000 Tons) Analysis, By Application 2015-2030 Figure 72: Europe Dairy Products Packaging Market Y-o-Y Growth (%) Projections, By Application 2022-2030 Figure 73: Europe Dairy Products Packaging Market Attractiveness, By Application 2022-2030 Figure 74: Europe Dairy Products Packaging Market Value (US$ Mn) Analysis, By Material 2015-2030 Figure 75: Europe Dairy Products Packaging Market Volume (‘000 Tons) Analysis, By Material 2015-2030 Figure 76: Europe Dairy Products Packaging Market Y-o-Y Growth (%) Projections, By Material 2022-2030 Figure 77: Europe Dairy Products Packaging Market Attractiveness, By Material 2022-2030 Figure 78: Europe Dairy Products Packaging Market Value (US$ Mn) Analysis, By Distribution Channel 2015-2030 Figure 79: Europe Dairy Products Packaging Market Volume (‘000 Tons) Analysis, By Distribution Channel 2015-2030 Figure 80: Europe Dairy Products Packaging Market Y-o-Y Growth (%) Projections, By Distribution Channel 2022-2030 Figure 81: Europe Dairy Products Packaging Market Attractiveness, By Distribution Channel 2022-2030 Figure 82: Europe Dairy Products Packaging Market Value (US$ Mn) Analysis, By Region 2015-2030 Figure 83: Europe Dairy Products Packaging Market Volume (‘000 Tons) Analysis, By Region 2015-2030 Figure 84: Europe Dairy Products Packaging Market Y-o-Y Growth (%) Projections, By Region 2022-2030 Figure 85: Europe Dairy Products Packaging Market Attractiveness, By Region 2022-2030 Figure 86: South Asia & Pacific Dairy Products Packaging Market Value (US$ Mn) Analysis, By Type 2015-2030 Figure 87: South Asia & Pacific Dairy Products Packaging Market Volume (‘000 Tons) Analysis, By Type 2015-2030 Figure 88: South Asia & Pacific Dairy Products Packaging Market Y-o-Y Growth (%) Projections, By Type 2022-2030 Figure 89: South Asia & Pacific Dairy Products Packaging Market Attractiveness, By Type 2022-2030 Figure 90: South Asia & Pacific Dairy Products Packaging Market Value (US$ Mn) Analysis, By Application 2015-2030 Figure 91: South Asia & Pacific Dairy Products Packaging Market Volume (‘000 Tons) Analysis, By Application 2015-2030 Figure 92: South Asia & Pacific Dairy Products Packaging Market Y-o-Y Growth (%) Projections, By Application 2022-2030 Figure 93: South Asia & Pacific Dairy Products Packaging Market Attractiveness, By Application 2022-2030 Figure 94: South Asia & Pacific Dairy Products Packaging Market Value (US$ Mn) Analysis, By Material 2015-2030 Figure 95: South Asia & Pacific Dairy Products Packaging Market Volume (‘000 Tons) Analysis, By Material 2015-2030 Figure 96: South Asia & Pacific Dairy Products Packaging Market Y-o-Y Growth (%) Projections, By Material 2022-2030 Figure 97: South Asia & Pacific Dairy Products Packaging Market Attractiveness, By Material 2022-2030 Figure 98: South Asia & Pacific Dairy Products Packaging Market Value (US$ Mn) Analysis, By Distribution Channel 2015-2030 Figure 99: South Asia & Pacific Dairy Products Packaging Market Volume (‘000 Tons) Analysis, By Distribution Channel 2015-2030 Figure 100: South Asia & Pacific Dairy Products Packaging Market Y-o-Y Growth (%) Projections, By Distribution Channel 2022-2030 Figure 101: South Asia & Pacific Dairy Products Packaging Market Attractiveness, By Distribution Channel 2022-2030 Figure 102: South Asia & Pacific Dairy Products Packaging Market Value (US$ Mn) Analysis, By Region 2015-2030 Figure 103: South Asia & Pacific Dairy Products Packaging Market Volume (‘000 Tons) Analysis, By Region 2015-2030 Figure 104: South Asia & Pacific Dairy Products Packaging Market Y-o-Y Growth (%) Projections, By Region 2022-2030 Figure 105: South Asia & Pacific Dairy Products Packaging Market Attractiveness, By Region 2022-2030 Figure 106: East Asia Dairy Products Packaging Market Value (US$ Mn) Analysis, By Type 2015-2030 Figure 107: East Asia Dairy Products Packaging Market Volume (‘000 Tons) Analysis, By Type 2015-2030 Figure 108: East Asia Dairy Products Packaging Market Y-o-Y Growth (%) Projections, By Type 2022-2030 Figure 109: East Asia Dairy Products Packaging Market Attractiveness, By Type 2022-2030 Figure 110: East Asia Dairy Products Packaging Market Value (US$ Mn) Analysis, By Application 2015-2030 Figure 111: East Asia Dairy Products Packaging Market Volume (‘000 Tons) Analysis, By Application 2015-2030 Figure 112: East Asia Dairy Products Packaging Market Y-o-Y Growth (%) Projections, By Application 2022-2030 Figure 113: East Asia Dairy Products Packaging Market Attractiveness, By Application 2022-2030 Figure 114: East Asia Dairy Products Packaging Market Value (US$ Mn) Analysis, By Material 2015-2030 Figure 115: East Asia Dairy Products Packaging Market Volume (‘000 Tons) Analysis, By Material 2015-2030 Figure 116: East Asia Dairy Products Packaging Market Y-o-Y Growth (%) Projections, By Material 2022-2030 Figure 117: East Asia Dairy Products Packaging Market Attractiveness, By Material 2022-2030 Figure 118: East Asia Dairy Products Packaging Market Value (US$ Mn) Analysis, By Distribution Channel 2015-2030 Figure 119: East Asia Dairy Products Packaging Market Volume (‘000 Tons) Analysis, By Distribution Channel 2015-2030 Figure 120: East Asia Dairy Products Packaging Market Y-o-Y Growth (%) Projections, By Distribution Channel 2022-2030 Figure 121: East Asia Dairy Products Packaging Market Attractiveness, By Distribution Channel 2022-2030 Figure 122: East Asia Dairy Products Packaging Market Value (US$ Mn) Analysis, By Region 2015-2030 Figure 123: East Asia Dairy Products Packaging Market Volume (‘000 Tons) Analysis, By Region 2015-2030 Figure 124: East Asia Dairy Products Packaging Market Y-o-Y Growth (%) Projections, By Region 2022-2030 Figure 125: East Asia Dairy Products Packaging Market Attractiveness, By Region 2022-2030 Figure 126: MEA Dairy Products Packaging Market Value (US$ Mn) Analysis, By Type 2015-2030 Figure 127: MEA Dairy Products Packaging Market Volume (‘000 Tons) Analysis, By Type 2015-2030 Figure 128: MEA Dairy Products Packaging Market Y-o-Y Growth (%) Projections, By Type 2022-2030 Figure 129: MEA Dairy Products Packaging Market Attractiveness, By Type 2022-2030 Figure 130: MEA Dairy Products Packaging Market Value (US$ Mn) Analysis, By Application 2015-2030 Figure 131: MEA Dairy Products Packaging Market Volume (‘000 Tons) Analysis, By Application 2015-2030 Figure 132: MEA Dairy Products Packaging Market Y-o-Y Growth (%) Projections, By Application 2022-2030 Figure 133: MEA Dairy Products Packaging Market Attractiveness, By Application 2022-2030 Figure 134: MEA Dairy Products Packaging Market Value (US$ Mn) Analysis, By Material 2015-2030 Figure 135: MEA Dairy Products Packaging Market Volume (‘000 Tons) Analysis, By Material 2015-2030 Figure 136: MEA Dairy Products Packaging Market Y-o-Y Growth (%) Projections, By Material 2022-2030 Figure 137: MEA Dairy Products Packaging Market Attractiveness, By Material 2022-2030 Figure 138: MEA Dairy Products Packaging Market Value (US$ Mn) Analysis, By Distribution Channel 2015-2030 Figure 139: MEA Dairy Products Packaging Market Volume (‘000 Tons) Analysis, By Distribution Channel 2015-2030 Figure 140: MEA Dairy Products Packaging Market Y-o-Y Growth (%) Projections, By Distribution Channel 2022-2030 Figure 141: MEA Dairy Products Packaging Market Attractiveness, By Distribution Channel 2022-2030 Figure 142: MEA Dairy Products Packaging Market Value (US$ Mn) Analysis, By Region 2015-2030 Figure 143: MEA Dairy Products Packaging Market Volume (‘000 Tons) Analysis, By Region 2015-2030 Figure 144: MEA Dairy Products Packaging Market Y-o-Y Growth (%) Projections, By Region 2022-2030 Figure 145: MEA Dairy Products Packaging Market Attractiveness, By Region 2022-2030
Recommendations
Explore Packaging Insights
View Reports