Dairy-Free Smoothies Market Size and Share Forecast Outlook 2025 to 2035

The global dairy-free smoothies market is projected to be valued at USD 1.7 billion in 2025, and is expected to reach approximately USD 3.2 billion by 2035, expanding at a steady CAGR of 6.5% during the forecast period.
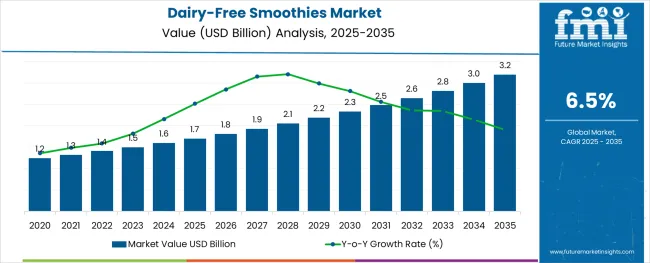
Quick Stats of Dairy-Free Smoothies Market

  • Market Value (2025): USD 1.7 billion
  • Projected Value (2035): USD 3.2 billion
  • Forecast CAGR (2025 to 2035): 6.5%
  • Leading Segment (2025): Indirect (B2C) (71% share)
  • Key Growth Region: Asia Pacific (China, 8.5% CAGR)
  • Key Players: Life Force Beverages LLC, Tasti D-Lite LLC, Golden State Foods Corporation, Naked Juice, WWF Operating Company, Beaming Wellness, Inc

Dairy Free Smoothies Market

This growth is being fueled by an escalating global shift toward plant-based and functional beverages. As consumers become more health-conscious and environmentally aware, the demand for dairy-free alternatives has accelerated, especially in categories that traditionally rely on dairy, such as smoothies. This shift is not only consumer-driven but also supported by advancements in food technology, formulation capabilities, and investments in production methods that align with both wellness trends and climate-conscious consumption.

The industry registers an estimated 6-8% share within the broader dairy alternatives market, which includes products like plant-based milk, yogurt, cheese, and ice cream. Within the functional beverages market, its share is comparatively smaller at around 2-3%, as this category encompasses a wide range of drinks like energy beverages, fortified waters, and probiotic drinks. In the plant-based food and beverage market, dairy-free smoothies account for roughly 4-5%, reflecting their niche yet growing role in plant-based nutrition.

The market captures around 3% of the health and wellness food sector, with increasing traction among fitness and wellness enthusiasts. Within the RTD beverages market, it forms 1-2%, but is expanding rapidly due to rising demand for on-the-go, clean-label, nutrient-rich drinks.

The market involves a complex but increasingly streamlined value chain that begins with sourcing of plant-based raw materials, such as oats, almonds, coconuts, and soybeans, from certified organic farms. These raw materials are then processed into bases, often in specialized non-dairy processing facilities equipped to prevent cross-contamination. Smoothie manufacturing integrates fruit purées, botanical extracts, plant proteins, and functional additives into these bases, requiring a coordinated approach to formulation and quality control.

Post-production, companies invest in advanced cold-chain logistics and eco-friendly packaging solutions to ensure product freshness. Distribution spans online retail, supermarkets, cafés, and direct-to-consumer platforms, with marketing heavily reliant on wellness branding and social media engagement. As the market evolves, collaborative partnerships between ingredient suppliers, co-manufacturers, and retailers are becoming central to optimizing cost, ensuring traceability, and delivering consistently high-quality products to a global consumer base.

Analyzing Dairy-Free Smoothies Market by Top Investment Segments

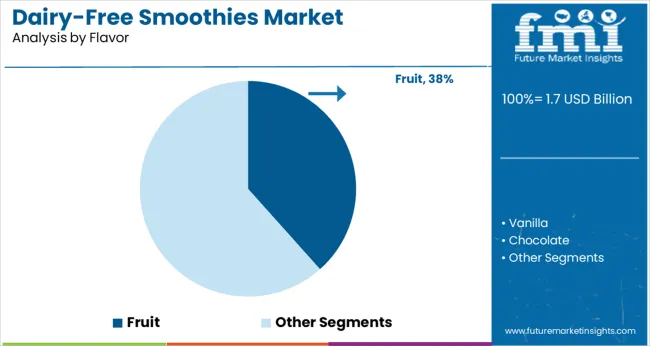
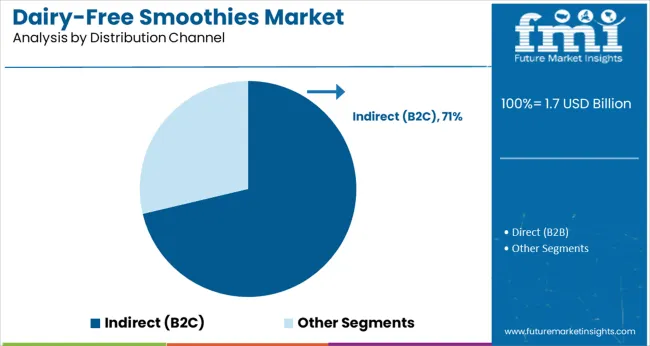
Water-based smoothies lead the dairy-free market with a 43% share in 2025, driven by demand for lighter, hydrating, and clean-label options. Fruit-flavored variants follow closely at 38%, appealing to consumers seeking natural sweetness and nutritional value. Indirect (B2C) distribution dominates with a 71% share, fueled by retail visibility, e-commerce growth, and strong consumer engagement.
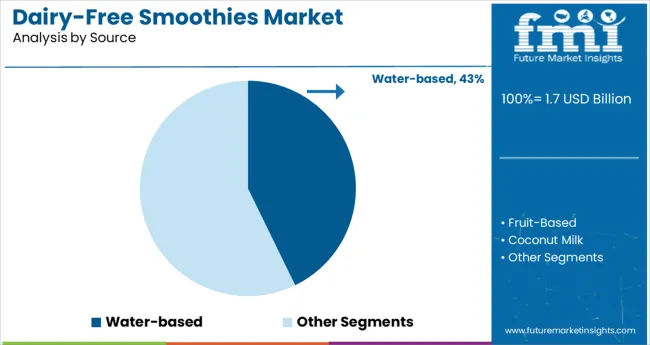
Hydration Reimagined, Water-Based Smoothies Lead the Way

Dairy Free Smoothies Market Analysis By Source

Water-based smoothies have emerged as the leading segment, capturing a dominant 43% market share in 2025. This segment’s rapid rise is rooted in evolving consumer preferences for lighter, more refreshing, and lower-calorie beverage options.
  • Unlike heavier nut or coconut milk bases, water-based formulations offer a clean and hydrating experience, allowing the natural taste of fruits and vegetables to shine through.
  • Consumers increasingly seek beverages that support wellness without weighing them down, water-based smoothies perfectly balance nutrition with refreshment.
  • The formulation flexibility, clean-label positioning, and reduced allergen concerns make them a preferred choice for both brands and health-conscious consumers.

The Rise of Fruit-Infused Smoothie Favorites

Dairy Free Smoothies Market Analysis By Flavor

In the flavor category, fruit-flavored dairy-free smoothies hold the leading position, accounting for 38% of the market share in 2025. This dominance is driven by consumers’ strong preference for naturally sweet, refreshing, and nutrient-rich options that align with clean-label and plant-based lifestyles.
  • Flavors like strawberry, banana, mango, and berry blends offer not only familiarity and sensory appeal but also perceived health benefits.
  • Unlike synthetic or dessert-inspired profiles, fruit flavors evoke freshness and authenticity, helping brands position their products as both indulgent and functional.
  • The vibrant colors and aromas of fruit-based smoothies create strong visual and emotional appeal in a retail setting, further boosting their popularity.

Indirect (B2C) Channels Lead Dairy-Free Smoothie Distribution

Dairy Free Smoothies Market Analysis By Distribution Channel

The indirect (B2C) distribution channel holds the dominant share of 71% in the dairy-free smoothies market as of 2025. This reflects the strong penetration of dairy-free beverages in retail environments such as supermarkets, health food stores, and especially online platforms.

  • The rising consumer demand for clean-label, plant-based, and ready-to-drink products is being met most effectively through these channels, where shelf visibility and digital marketing directly influence purchase behavior.
  • B2C distribution allows brands to create tailored experiences, highlight health benefits, and build emotional connections with health-conscious shoppers.
  • The surge in e-commerce has widened access to niche and premium smoothie products, further boosting the B2C segment’s influence.

Top Dairy-Free Smoothies Market Dynamics

Clean-label dairy-free smoothies with transparent, additive-free ingredients are gaining shelf space and turning over 1.8× faster, especially in the USA and Southeast Asia. Digestive wellness blends with probiotics and prebiotic fibers are driving up sales by 27% in markets like Japan and France.

Clean-Label Positioning Drives Shelf Preference

Retail buyers and consumers are showing strong alignment toward dairy-free smoothies with transparent, additive-free ingredient profiles. Brands emphasizing “no added sugar,” “all-natural,” and “plant-only” attributes are gaining traction across major B2C channels. In the USA and Germany, shelf placement of clean-label dairy-free smoothies increased by 22% in Q1 2025, with retailers reporting 1.8× faster turnover compared to conventional blends. Southeast Asian convenience chains now mandate QR-based ingredient traceability for new listings, pushing brands to adopt transparent sourcing narratives.

  • 22% rise in shelf space for clean-label SKUs reported by top retailers
  • 1.8× higher turnover for “plant-only” smoothies vs. blended-base products
  • Ingredient traceability mandates driving new packaging strategies

Digestive Wellness and Functional Ingredient Inclusion

Consumer demand for gut health and low-allergen nutrition is fueling the inclusion of digestive-friendly ingredients like plant-based probiotics, prebiotic fibers, and easily digestible fruit bases. Dairy-free smoothies formulated with banana, oat fiber, or turmeric are now gaining a foothold in wellness aisles. In Japan and France, smoothies containing inulin or fermented adaptogens saw a 27% increase in month-on-month sales during Q1 2025. Specialty health food retailers have begun favoring SKUs with on-pack gut health claims, nudging mainstream brands to follow suit.
  • 27% MoM sales growth for gut-friendly smoothies in Japan and France
  • Oat fiber, turmeric, and banana dominate digestive-friendly blends
  • Retail preference shifting to SKUs with digestive wellness labeling

Top Countries Shaping the Dairy-Free Smoothies Market

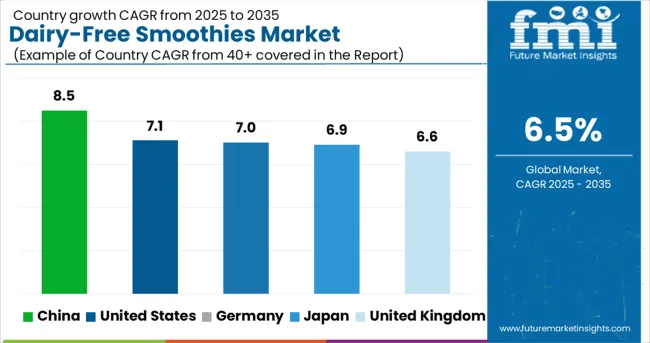
Dairy Free Smoothies Market CAGR Analysis By Country 2025-2035

Countries CAGR (2025 to 2035)
United States 7.1%
Germany 7.0%
United Kingdom 6.6%
China 8.5%
Japan 6.9%

With the global dairy-free smoothies market set to grow at a 6.5% CAGR through 2035, key BRICS and OECD markets are showing varied performance. China leads at 8.5%, well above the global average, fueled by demand for soy, almond, and coconut-based blends positioned as functional breakfast replacements. Urban health trends and e-commerce-driven distribution are accelerating penetration in tier-1 and tier-2 cities.

The United States, part of the OECD group, records 7.1%, supported by clean-label and growing retail shelf space for blended, low-sugar formats. Germany and Japan follow at 7.0% and 6.9% respectively, with product development focused on protein-enhanced variants and refrigerated grab-and-go formats. The United Kingdom posts 6.6%, just above the global average, with oat- and berry-based SKUs leading launches across private label and direct-to-consumer channels.

ASEAN markets such as Thailand and Indonesia are emerging players, with blended fruit-nut bases gaining traction among lactose-intolerant urban populations.

United States, Functional Wellness Reframes the Dairy-Free Smoothies Market

The USA dairy-free smoothies market expanded at a CAGR of 5.7% from 2020 and 2024, driven by vegan lifestyle adoption and the rise of plant-based beverage start-ups across metro hubs. Between 2025 and 2035, the market is expected to grow at a higher CAGR of 7.1%, supported by enhanced availability in B2C retail, clean-label trends, and the rise of protein-rich and fiber-fortified smoothies.

Functional health positioning and demand for allergen-free drinks are further accelerating refrigerated and cold-chain retail distribution. Online wellness platforms and gym-centric marketing campaigns are also contributing to premiumization and brand loyalty.

  • Plant-based beverage sales surpassed USD 2.5 Billion in the USA by the end of 2024
  • 34%+ of USA households consumed dairy-alternative smoothies regularly in 2023
  • Cold-chain smoothie SKUs grew 1.9× in e-commerce from 2022 to 2024

United Kingdom, Clean-Label Revolution Powers Dairy-Free Smoothies Uptake

The UK dairy-free smoothies market posted a CAGR of 4.8% from 2020 to 2024, restricted by high pricing and limited in-store variety. However, the growth outlook for 2025 to 2035 is stronger at 6.6% CAGR, slightly above the global average, supported by increased retail distribution, low-sugar recipes, and improved allergen transparency. Gen Z’s health habits and influencer-led promotions are reshaping consumption patterns across London, Manchester, and Birmingham. Expansion into organic chains and better flavor profiles are encouraging repeat purchases and driving shelf differentiation.

  • 29% of UK millennials will consume dairy-free beverages daily by 2024
  • Health food retailers increased smoothie shelf space by 2.1× from 2021 to 2024
  • Organic fruit blends reported 32% YoY growth in London and Manchester

Germany Dairy-Free Smoothies Market Outlook

The German dairy-free smoothies market expanded at a 5.1% CAGR from 2020 to 2024, propelled by growing awareness of lactose intolerance and strong clean-label demand. Looking ahead, the market is set to grow faster at a 7.0% CAGR from 2025 to 2035, spurred by policy support for organic labeling, the maturity of natural foods distribution, and widespread flexitarian dietary habits.

Retailers are prioritizing immune-boosting and antioxidant smoothies, while consumer trust in domestic certifications boosts repeat sales. Berlin and Hamburg remain hubs for dairy-free, influencing purchasing behavior across Western Europe.

  • 37% of new smoothie SKUs in 2024 included immune or fiber claims
  • Germany made up 18% of Western Europe’s dairy-free smoothie imports in 2023
  • Flexitarian lifestyle adoption rose from 16% in 2020 to 25% by 2024

In-Depth Analysis of Dairy-Free Smoothies Market in China

The China dairy-free smoothies market recorded a solid 6.2% CAGR from 2020 to 2024, led by cross-border e-commerce and rising urban health awareness. The outlook is even stronger for 2025 to 2035, with an estimated CAGR of 8.5%, as domestic players introduce fruit- and TCM-based formulations.

The fusion of wellness traditions with online retail, mini-program commerce, and livestream selling is boosting visibility and consumer education. Increasing lactose intolerance, combined with demand for functional convenience drinks, is catalyzing the expansion of local brands and new distribution channels.

  • Functional smoothie sales surged 41% YoY on Alibaba platforms in 2024
  • 52% of consumers under 35 consumed plant-based drinks weekly by 2023
  • TCM-infused smoothie SKUs grew 3.4× between 2021 and 2024

Sales Analysis of Dairy-Free Smoothies Market in Japan

The Japan dairy-free smoothies market registered a CAGR of 4.3% between 2020 and 2024, held back by traditional dairy habits and narrow product availability beyond Tokyo and Osaka. For 2025 to 2035, growth is projected at 6.9% CAGR, led by aging consumers embracing gut-friendly and beauty-enhancing drinks.

Plant-based smoothies with subtle taste profiles, natural sweeteners, and on-pack wellness claims are finding favor, especially in convenience stores and vending channels. Market traction is further supported by increasing female consumer interest in "beauty-from-within" nutrition and functional wellness positioning.
  • Over 45% of Japan’s 2024 dairy-free smoothie sales came from convenience stores
  • SKUs with “skin health” claims grew 38% YoY between 2023 and 2024
  • Tokyo and Yokohama generated 56% of national demand in 2024

Leading Companies Delivering Dairy-Free Smoothies Solutions

Dairy Free Smoothies Market Analysis By Company

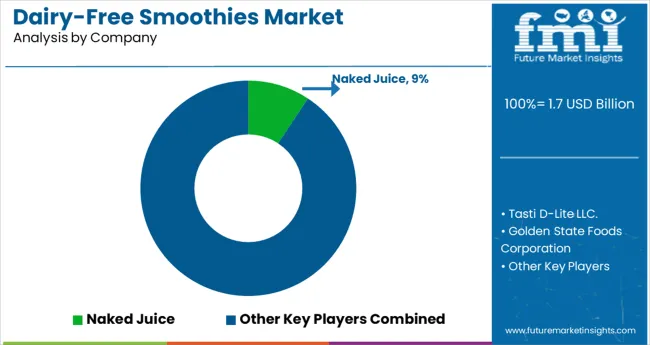
Leading Company - Naked Juice

Industry Share - ~9.3%

In the dairy-free smoothies market, leading players like Naked Juice, Innocent Drinks, Campbell Soup Company, and Beaming Wellness, Inc. are pursuing growth through wellness-driven formulations, clean-label transparency, and targeted retail expansion. Companies such as Life Force Beverages LLC, Tasti D-Lite LLC, and Maui Wowi Franchising, Inc. are leveraging cold-chain logistics and functional ingredients to tap into fitness-conscious and urban millennial segments. Their strategies revolve around low-sugar, high-protein, and allergen-free positioning, enabling premium placement across grocery, cafés, and online channels.

Ingredient-focused entities like Tate & Lyle plc. and Golden State Foods Corporation provide key back-end support, enhancing texture, flavor, and shelf-life stability. Retail Zoo Pty Ltd. and WWF Operating Company are expanding through co-branded smoothie bars and wellness cafés. As demand surges, competitive intensity remains high, with brands focusing on RTD, direct-to-consumer models, and regional ingredient partnerships.

Recent Industry News

In August 2024, Golden State Foods announced that Lindsay Goldberg, a family- and founder-focused private equity firm, acquired a controlling interest in the company while the founding Wetterau family retained a significant ownership stake.

Leading Players in Dairy-Free Smoothies Market

  • Life Force Beverages LLC
  • Tasti D-Lite LLC.
  • Golden State Foods Corporation
  • Naked Juice
  • WWF Operating Company
  • Beaming Wellness, Inc.
  • Maui Wowi Franchising, Inc.
  • Innocent Drinks
  • Tate & Lyle plc.
  • Campbell Soup Company
  • Retail Zoo Pty Ltd.

Research Coverage and Scope Summary

Report Attributes Details
Industry Size (2025) USD 1.7 billion
Projected Industry Size (2035) USD 3.2 billion
CAGR (2025 to 2035) 6.5%
Base Year for Estimation 2024
Historical Period 2020 to 2024
Projections Period 2025 to 2035
Quantitative Units USD billion for value and million units for volume
Source Analyzed (Segment 1) Fruit-Based, Water-Based, Coconut Milk, and Others.
Flavor Analyzed (Segment 2) Fruit, Vanilla, Chocolate, and Others.
Distribution Channel Analyzed (Segment 3) Direct (B2B) and Indirect (B2C).
Regions Covered North America, Latin America, Western Europe, Eastern Europe, East Asia, South Asia & Pacific
Countries Covered United States, Canada, Germany, United Kingdom, France, Italy, Spain, China, India, Japan, South Korea, Australia, Brazil, Mexico, Argentina, Saudi Arabia, UAE, South Africa
Key Players Life Force Beverages LLC, Tasti D-Lite LLC, Golden State Foods Corporation, Naked Juice, WWF Operating Company, Beaming Wellness, Inc., Maui Wowi Franchising, Inc., Innocent Drinks, Tate & Lyle plc, Campbell Soup Company, Retail Zoo Pty Ltd, Others.
Additional Attributes Dollar sales by base and flavor, market share by region and channel, growth drivers, B2C vs. B2B trends, pricing strategies, and competitive positioning.

Key Segments

By Source:

The industry includes fruit-based, water-based, coconut milk, and others.

By Flavor:

The industry is segmented into fruit, vanilla, chocolate, and others.

By Distribution Channel:

The segmentation covers direct (B2B) and indirect (B2C).

By Region:

The industry is segmented as North America, Latin America, Western Europe, Eastern Europe, East Asia, South Asia & Pacific.

Table of Content

  1. Executive Summary
    • Global Market Outlook
    • Demand-side Trends
    • Supply-side Trends
    • Technology Roadmap Analysis
    • Analysis and Recommendations
  2. Market Overview
    • Market Coverage / Taxonomy
    • Market Definition / Scope / Limitations
  3. Market Background
    • Market Dynamics
      • Drivers
      • Restraints
      • Opportunity
      • Trends
    • Scenario Forecast
      • Demand in Optimistic Scenario
      • Demand in Likely Scenario
      • Demand in Conservative Scenario
    • Opportunity Map Analysis
    • Product Life Cycle Analysis
    • Supply Chain Analysis
      • Supply Side Participants and their Roles
        • Producers
        • Mid-Level Participants (Traders/ Agents/ Brokers)
        • Wholesalers and Distributors
      • Value Added and Value Created at Node in the Supply Chain
      • List of Raw Material Suppliers
      • List of Existing and Potential Buyer’s
    • Investment Feasibility Matrix
    • Value Chain Analysis
      • Profit Margin Analysis
      • Wholesalers and Distributors
      • Retailers
    • PESTLE and Porter’s Analysis
    • Regulatory Landscape
      • By Key Regions
      • By Key Countries
    • Regional Parent Market Outlook
    • Production and Consumption Statistics
    • Import and Export Statistics
  4. Global Market Analysis 2020 to 2024 and Forecast, 2025 to 2035
    • Historical Market Size Value (USD Billion) & Volume (units) Analysis, 2020 to 2024
    • Current and Future Market Size Value (USD Billion) & Volume (units) Projections, 2025 to 2035
      • Y-o-Y Growth Trend Analysis
      • Absolute $ Opportunity Analysis
  5. Global Market Pricing Analysis 2020 to 2024 and Forecast 2025 to 2035
  6. Global Market Analysis 2020 to 2024 and Forecast 2025 to 2035, By Source
    • Introduction / Key Findings
    • Historical Market Size Value (USD Billion) & Volume (units) Analysis By Source, 2020 to 2024
    • Current and Future Market Size Value (USD Billion) & Volume (units) Analysis and Forecast By Source, 2025 to 2035
      • Fruit Based
      • Water Based
      • Coconut Milk
      • Others
    • Y-o-Y Growth Trend Analysis By Source, 2020 to 2024
    • Absolute $ Opportunity Analysis By Source, 2025 to 2035
  7. Global Market Analysis 2020 to 2024 and Forecast 2025 to 2035, By Flavor
    • Introduction / Key Findings
    • Historical Market Size Value (USD Billion) & Volume (units) Analysis By Flavor, 2020 to 2024
    • Current and Future Market Size Value (USD Billion) & Volume (units) Analysis and Forecast By Flavor, 2025 to 2035
      • Fruit
      • Vanilla
      • Chocolate
      • Other
    • Y-o-Y Growth Trend Analysis By Flavor, 2020 to 2024
    • Absolute $ Opportunity Analysis By Flavor, 2025 to 2035
  8. Global Market Analysis 2020 to 2024 and Forecast 2025 to 2035, By Distribution Channel
    • Introduction / Key Findings
    • Historical Market Size Value (USD Billion) & Volume (units) Analysis By Distribution Channel, 2020 to 2024
    • Current and Future Market Size Value (USD Billion) & Volume (units) Analysis and Forecast By Distribution Channel, 2025 to 2035
      • Direct (B2B)
      • Indirect (B2C)
    • Y-o-Y Growth Trend Analysis By Distribution Channel, 2020 to 2024
    • Absolute $ Opportunity Analysis By Distribution Channel, 2025 to 2035
  9. Global Market Analysis 2020 to 2024 and Forecast 2025 to 2035, By Region
    • Introduction
    • Historical Market Size Value (USD Billion) & Volume (units) Analysis By Region, 2020 to 2024
    • Current Market Size Value (USD Billion) & Volume (units) Analysis and Forecast By Region, 2025 to 2035
      • North America
      • Latin America
      • Western Europe
      • Eastern Europe
      • East Asia
      • South Asia & Pacific
      • Middle East and Africa
    • Market Attractiveness Analysis By Region
  10. North America Market Analysis 2020 to 2024 and Forecast 2025 to 2035, By Country
    • Historical Market Size Value (USD Billion) & Volume (units) Trend Analysis By Market Taxonomy, 2020 to 2024
    • Market Size Value (USD Billion) & Volume (units) Forecast By Market Taxonomy, 2025 to 2035
      • By Country
        • USA
        • Canada
        • Mexico
      • By Source
      • By Flavor
      • By Distribution Channel
    • Market Attractiveness Analysis
      • By Country
      • By Source
      • By Flavor
      • By Distribution Channel
    • Key Takeaways
  11. Latin America Market Analysis 2020 to 2024 and Forecast 2025 to 2035, By Country
    • Historical Market Size Value (USD Billion) & Volume (units) Trend Analysis By Market Taxonomy, 2020 to 2024
    • Market Size Value (USD Billion) & Volume (units) Forecast By Market Taxonomy, 2025 to 2035
      • By Country
        • Brazil
        • Argentina
        • Rest of LATAM
      • By Source
      • By Flavor
      • By Distribution Channel
    • Market Attractiveness Analysis
      • By Country
      • By Source
      • By Flavor
      • By Distribution Channel
    • Key Takeaways
  12. Western Europe Market Analysis 2020 to 2024 and Forecast 2025 to 2035, By Country
    • Historical Market Size Value (USD Billion) & Volume (units) Trend Analysis By Market Taxonomy, 2020 to 2024
    • Market Size Value (USD Billion) & Volume (units) Forecast By Market Taxonomy, 2025 to 2035
      • By Country
        • Germany
        • Italy
        • France
        • UK
        • Spain
        • BENELUX
        • Nordic
        • Rest of W.Europe
      • By Source
      • By Flavor
      • By Distribution Channel
    • Market Attractiveness Analysis
      • By Country
      • By Source
      • By Flavor
      • By Distribution Channel
    • Key Takeaways
  13. Eastern Europe Market Analysis 2020 to 2024 and Forecast 2025 to 2035, By Country
    • Historical Market Size Value (USD Billion) & Volume (units) Trend Analysis By Market Taxonomy, 2020 to 2024
    • Market Size Value (USD Billion) & Volume (units) Forecast By Market Taxonomy, 2025 to 2035
      • By Country
        • Russia
        • Hungary
        • Poland
        • Balkan & Baltics
        • Rest of E. Europe
      • By Source
      • By Flavor
      • By Distribution Channel
    • Market Attractiveness Analysis
      • By Country
      • By Source
      • By Flavor
      • By Distribution Channel
    • Key Takeaways
  14. East Asia Market Analysis 2020 to 2024 and Forecast 2025 to 2035, By Country
    • Historical Market Size Value (USD Billion) & Volume (units) Trend Analysis By Market Taxonomy, 2020 to 2024
    • Market Size Value (USD Billion) & Volume (units) Forecast By Market Taxonomy, 2025 to 2035
      • By Country
        • China
        • Japan
        • South Korea
      • By Source
      • By Flavor
      • By Distribution Channel
    • Market Attractiveness Analysis
      • By Country
      • By Source
      • By Flavor
      • By Distribution Channel
    • Key Takeaways
  15. South Asia & Pacific Market Analysis 2020 to 2024 and Forecast 2025 to 2035, By Country
    • Historical Market Size Value (USD Billion) & Volume (units) Trend Analysis By Market Taxonomy, 2020 to 2024
    • Market Size Value (USD Billion) & Volume (units) Forecast By Market Taxonomy, 2025 to 2035
      • By Country
        • India
        • Australia & New Zealand
        • ASEAN
        • Rest of SAP
      • By Source
      • By Flavor
      • By Distribution Channel
    • Market Attractiveness Analysis
      • By Country
      • By Source
      • By Flavor
      • By Distribution Channel
    • Key Takeaways
  16. Middle East and Africa Market Analysis 2020 to 2024 and Forecast 2025 to 2035, By Country
    • Historical Market Size Value (USD Billion) & Volume (units) Trend Analysis By Market Taxonomy, 2020 to 2024
    • Market Size Value (USD Billion) & Volume (units) Forecast By Market Taxonomy, 2025 to 2035
      • By Country
        • GCC Countries
        • Northern Africa
        • South Africa
        • Turkiye
        • Rest of MEA
      • By Source
      • By Flavor
      • By Distribution Channel
    • Market Attractiveness Analysis
      • By Country
      • By Source
      • By Flavor
      • By Distribution Channel
    • Key Takeaways
  17. Key Countries Market Analysis
    • USA
      • Pricing Analysis
      • Market Share Analysis, 2024
        • By Source
        • By Flavor
        • By Distribution Channel
    • Canada
      • Pricing Analysis
      • Market Share Analysis, 2024
        • By Source
        • By Flavor
        • By Distribution Channel
    • Brazil
      • Pricing Analysis
      • Market Share Analysis, 2024
        • By Source
        • By Flavor
        • By Distribution Channel
    • Mexico
      • Pricing Analysis
      • Market Share Analysis, 2024
        • By Source
        • By Flavor
        • By Distribution Channel
    • Argentina
      • Pricing Analysis
      • Market Share Analysis, 2024
        • By Source
        • By Flavor
        • By Distribution Channel
  18. Market Structure Analysis
    • Competition Dashboard
    • Competition Benchmarking
    • Market Share Analysis of Top Players
      • By Regional
      • By Source
      • By Flavor
      • By Distribution Channel
  19. Competition Analysis
    • Competition Deep Dive
      • Life Force Beverages LLC
        • Overview
        • Product Portfolio
        • Profitability by Market Segments (Product/Age /Sales Channel/Region)
        • Sales Footprint
        • Strategy Overview
          • Marketing Strategy
          • Product Strategy
          • Channel Strategy
      • Tasti D-Lite LLC.
        • Overview
        • Product Portfolio
        • Profitability by Market Segments (Product/Age /Sales Channel/Region)
        • Sales Footprint
        • Strategy Overview
          • Marketing Strategy
          • Product Strategy
          • Channel Strategy
      • Golden State Foods Corporation
        • Overview
        • Product Portfolio
        • Profitability by Market Segments (Product/Age /Sales Channel/Region)
        • Sales Footprint
        • Strategy Overview
          • Marketing Strategy
          • Product Strategy
          • Channel Strategy
      • Naked Juice
        • Overview
        • Product Portfolio
        • Profitability by Market Segments (Product/Age /Sales Channel/Region)
        • Sales Footprint
        • Strategy Overview
          • Marketing Strategy
          • Product Strategy
          • Channel Strategy
      • WWF Operating Company
        • Overview
        • Product Portfolio
        • Profitability by Market Segments (Product/Age /Sales Channel/Region)
        • Sales Footprint
        • Strategy Overview
          • Marketing Strategy
          • Product Strategy
          • Channel Strategy
      • Beaming Wellness, Inc.
        • Overview
        • Product Portfolio
        • Profitability by Market Segments (Product/Age /Sales Channel/Region)
        • Sales Footprint
        • Strategy Overview
          • Marketing Strategy
          • Product Strategy
          • Channel Strategy
      • Maui Wowi Franchising, Inc.
        • Overview
        • Product Portfolio
        • Profitability by Market Segments (Product/Age /Sales Channel/Region)
        • Sales Footprint
        • Strategy Overview
          • Marketing Strategy
          • Product Strategy
          • Channel Strategy
      • Innocent Drinks
        • Overview
        • Product Portfolio
        • Profitability by Market Segments (Product/Age /Sales Channel/Region)
        • Sales Footprint
        • Strategy Overview
          • Marketing Strategy
          • Product Strategy
          • Channel Strategy
      • Tate & Lyle plc.
        • Overview
        • Product Portfolio
        • Profitability by Market Segments (Product/Age /Sales Channel/Region)
        • Sales Footprint
        • Strategy Overview
          • Marketing Strategy
          • Product Strategy
          • Channel Strategy
      • Campbell Soup Company
        • Overview
        • Product Portfolio
        • Profitability by Market Segments (Product/Age /Sales Channel/Region)
        • Sales Footprint
        • Strategy Overview
          • Marketing Strategy
          • Product Strategy
          • Channel Strategy
      • Retail Zoo Pty Ltd.
        • Overview
        • Product Portfolio
        • Profitability by Market Segments (Product/Age /Sales Channel/Region)
        • Sales Footprint
        • Strategy Overview
          • Marketing Strategy
          • Product Strategy
          • Channel Strategy
      • Others
        • Overview
        • Product Portfolio
        • Profitability by Market Segments (Product/Age /Sales Channel/Region)
        • Sales Footprint
        • Strategy Overview
          • Marketing Strategy
          • Product Strategy
          • Channel Strategy
  20. Assumptions & Acronyms Used
  21. Research Methodology

List of Tables

  • Table 1: Global Market Value (USD Billion) Forecast by Region, 2020 to 2035
  • Table 2: Global Market Volume (units) Forecast by Region, 2020 to 2035
  • Table 3: Global Market Value (USD Billion) Forecast by Source, 2020 to 2035
  • Table 4: Global Market Volume (units) Forecast by Source, 2020 to 2035
  • Table 5: Global Market Value (USD Billion) Forecast by Flavor, 2020 to 2035
  • Table 6: Global Market Volume (units) Forecast by Flavor, 2020 to 2035
  • Table 7: Global Market Value (USD Billion) Forecast by Distribution Channel, 2020 to 2035
  • Table 8: Global Market Volume (units) Forecast by Distribution Channel, 2020 to 2035
  • Table 9: North America Market Value (USD Billion) Forecast by Country, 2020 to 2035
  • Table 10: North America Market Volume (units) Forecast by Country, 2020 to 2035
  • Table 11: North America Market Value (USD Billion) Forecast by Source, 2020 to 2035
  • Table 12: North America Market Volume (units) Forecast by Source, 2020 to 2035
  • Table 13: North America Market Value (USD Billion) Forecast by Flavor, 2020 to 2035
  • Table 14: North America Market Volume (units) Forecast by Flavor, 2020 to 2035
  • Table 15: North America Market Value (USD Billion) Forecast by Distribution Channel, 2020 to 2035
  • Table 16: North America Market Volume (units) Forecast by Distribution Channel, 2020 to 2035
  • Table 17: Latin America Market Value (USD Billion) Forecast by Country, 2020 to 2035
  • Table 18: Latin America Market Volume (units) Forecast by Country, 2020 to 2035
  • Table 19: Latin America Market Value (USD Billion) Forecast by Source, 2020 to 2035
  • Table 20: Latin America Market Volume (units) Forecast by Source, 2020 to 2035
  • Table 21: Latin America Market Value (USD Billion) Forecast by Flavor, 2020 to 2035
  • Table 22: Latin America Market Volume (units) Forecast by Flavor, 2020 to 2035
  • Table 23: Latin America Market Value (USD Billion) Forecast by Distribution Channel, 2020 to 2035
  • Table 24: Latin America Market Volume (units) Forecast by Distribution Channel, 2020 to 2035
  • Table 25: Western Europe Market Value (USD Billion) Forecast by Country, 2020 to 2035
  • Table 26: Western Europe Market Volume (units) Forecast by Country, 2020 to 2035
  • Table 27: Western Europe Market Value (USD Billion) Forecast by Source, 2020 to 2035
  • Table 28: Western Europe Market Volume (units) Forecast by Source, 2020 to 2035
  • Table 29: Western Europe Market Value (USD Billion) Forecast by Flavor, 2020 to 2035
  • Table 30: Western Europe Market Volume (units) Forecast by Flavor, 2020 to 2035
  • Table 31: Western Europe Market Value (USD Billion) Forecast by Distribution Channel, 2020 to 2035
  • Table 32: Western Europe Market Volume (units) Forecast by Distribution Channel, 2020 to 2035
  • Table 33: Eastern Europe Market Value (USD Billion) Forecast by Country, 2020 to 2035
  • Table 34: Eastern Europe Market Volume (units) Forecast by Country, 2020 to 2035
  • Table 35: Eastern Europe Market Value (USD Billion) Forecast by Source, 2020 to 2035
  • Table 36: Eastern Europe Market Volume (units) Forecast by Source, 2020 to 2035
  • Table 37: Eastern Europe Market Value (USD Billion) Forecast by Flavor, 2020 to 2035
  • Table 38: Eastern Europe Market Volume (units) Forecast by Flavor, 2020 to 2035
  • Table 39: Eastern Europe Market Value (USD Billion) Forecast by Distribution Channel, 2020 to 2035
  • Table 40: Eastern Europe Market Volume (units) Forecast by Distribution Channel, 2020 to 2035
  • Table 41: East Asia Market Value (USD Billion) Forecast by Country, 2020 to 2035
  • Table 42: East Asia Market Volume (units) Forecast by Country, 2020 to 2035
  • Table 43: East Asia Market Value (USD Billion) Forecast by Source, 2020 to 2035
  • Table 44: East Asia Market Volume (units) Forecast by Source, 2020 to 2035
  • Table 45: East Asia Market Value (USD Billion) Forecast by Flavor, 2020 to 2035
  • Table 46: East Asia Market Volume (units) Forecast by Flavor, 2020 to 2035
  • Table 47: East Asia Market Value (USD Billion) Forecast by Distribution Channel, 2020 to 2035
  • Table 48: East Asia Market Volume (units) Forecast by Distribution Channel, 2020 to 2035
  • Table 49: South Asia & Pacific Market Value (USD Billion) Forecast by Country, 2020 to 2035
  • Table 50: South Asia & Pacific Market Volume (units) Forecast by Country, 2020 to 2035
  • Table 51: South Asia & Pacific Market Value (USD Billion) Forecast by Source, 2020 to 2035
  • Table 52: South Asia & Pacific Market Volume (units) Forecast by Source, 2020 to 2035
  • Table 53: South Asia & Pacific Market Value (USD Billion) Forecast by Flavor, 2020 to 2035
  • Table 54: South Asia & Pacific Market Volume (units) Forecast by Flavor, 2020 to 2035
  • Table 55: South Asia & Pacific Market Value (USD Billion) Forecast by Distribution Channel, 2020 to 2035
  • Table 56: South Asia & Pacific Market Volume (units) Forecast by Distribution Channel, 2020 to 2035
  • Table 57: Middle East and Africa Market Value (USD Billion) Forecast by Country, 2020 to 2035
  • Table 58: Middle East and Africa Market Volume (units) Forecast by Country, 2020 to 2035
  • Table 59: Middle East and Africa Market Value (USD Billion) Forecast by Source, 2020 to 2035
  • Table 60: Middle East and Africa Market Volume (units) Forecast by Source, 2020 to 2035
  • Table 61: Middle East and Africa Market Value (USD Billion) Forecast by Flavor, 2020 to 2035
  • Table 62: Middle East and Africa Market Volume (units) Forecast by Flavor, 2020 to 2035
  • Table 63: Middle East and Africa Market Value (USD Billion) Forecast by Distribution Channel, 2020 to 2035
  • Table 64: Middle East and Africa Market Volume (units) Forecast by Distribution Channel, 2020 to 2035

List of Figures

  • Figure 1: Global Market Volume (units) Forecast 2020 to 2035
  • Figure 2: Global Market Pricing Analysis
  • Figure 3: Global Market Value (USD Billion) Forecast 2020 to 2035
  • Figure 4: Global Market Value Share and BPS Analysis by Source, 2025 and 2035
  • Figure 5: Global Market Y-o-Y Growth Comparison by Source, 2025 to 2035
  • Figure 6: Global Market Attractiveness Analysis by Source
  • Figure 7: Global Market Value Share and BPS Analysis by Flavor, 2025 and 2035
  • Figure 8: Global Market Y-o-Y Growth Comparison by Flavor, 2025 to 2035
  • Figure 9: Global Market Attractiveness Analysis by Flavor
  • Figure 10: Global Market Value Share and BPS Analysis by Distribution Channel, 2025 and 2035
  • Figure 11: Global Market Y-o-Y Growth Comparison by Distribution Channel, 2025 to 2035
  • Figure 12: Global Market Attractiveness Analysis by Distribution Channel
  • Figure 13: Global Market Value (USD Billion) Share and BPS Analysis by Region, 2025 and 2035
  • Figure 14: Global Market Y-o-Y Growth Comparison by Region, 2025 to 2035
  • Figure 15: Global Market Attractiveness Analysis by Region
  • Figure 16: North America Market Incremental $ Opportunity, 2025 to 2035
  • Figure 17: Latin America Market Incremental $ Opportunity, 2025 to 2035
  • Figure 18: Western Europe Market Incremental $ Opportunity, 2025 to 2035
  • Figure 19: Eastern Europe Market Incremental $ Opportunity, 2025 to 2035
  • Figure 20: East Asia Market Incremental $ Opportunity, 2025 to 2035
  • Figure 21: South Asia & Pacific Market Incremental $ Opportunity, 2025 to 2035
  • Figure 22: Middle East and Africa Market Incremental $ Opportunity, 2025 to 2035
  • Figure 23: North America Market Value Share and BPS Analysis by Country, 2025 and 2035
  • Figure 24: North America Market Value Share and BPS Analysis by Source, 2025 and 2035
  • Figure 25: North America Market Y-o-Y Growth Comparison by Source, 2025 to 2035
  • Figure 26: North America Market Attractiveness Analysis by Source
  • Figure 27: North America Market Value Share and BPS Analysis by Flavor, 2025 and 2035
  • Figure 28: North America Market Y-o-Y Growth Comparison by Flavor, 2025 to 2035
  • Figure 29: North America Market Attractiveness Analysis by Flavor
  • Figure 30: North America Market Value Share and BPS Analysis by Distribution Channel, 2025 and 2035
  • Figure 31: North America Market Y-o-Y Growth Comparison by Distribution Channel, 2025 to 2035
  • Figure 32: North America Market Attractiveness Analysis by Distribution Channel
  • Figure 33: Latin America Market Value Share and BPS Analysis by Country, 2025 and 2035
  • Figure 34: Latin America Market Value Share and BPS Analysis by Source, 2025 and 2035
  • Figure 35: Latin America Market Y-o-Y Growth Comparison by Source, 2025 to 2035
  • Figure 36: Latin America Market Attractiveness Analysis by Source
  • Figure 37: Latin America Market Value Share and BPS Analysis by Flavor, 2025 and 2035
  • Figure 38: Latin America Market Y-o-Y Growth Comparison by Flavor, 2025 to 2035
  • Figure 39: Latin America Market Attractiveness Analysis by Flavor
  • Figure 40: Latin America Market Value Share and BPS Analysis by Distribution Channel, 2025 and 2035
  • Figure 41: Latin America Market Y-o-Y Growth Comparison by Distribution Channel, 2025 to 2035
  • Figure 42: Latin America Market Attractiveness Analysis by Distribution Channel
  • Figure 43: Western Europe Market Value Share and BPS Analysis by Country, 2025 and 2035
  • Figure 44: Western Europe Market Value Share and BPS Analysis by Source, 2025 and 2035
  • Figure 45: Western Europe Market Y-o-Y Growth Comparison by Source, 2025 to 2035
  • Figure 46: Western Europe Market Attractiveness Analysis by Source
  • Figure 47: Western Europe Market Value Share and BPS Analysis by Flavor, 2025 and 2035
  • Figure 48: Western Europe Market Y-o-Y Growth Comparison by Flavor, 2025 to 2035
  • Figure 49: Western Europe Market Attractiveness Analysis by Flavor
  • Figure 50: Western Europe Market Value Share and BPS Analysis by Distribution Channel, 2025 and 2035
  • Figure 51: Western Europe Market Y-o-Y Growth Comparison by Distribution Channel, 2025 to 2035
  • Figure 52: Western Europe Market Attractiveness Analysis by Distribution Channel
  • Figure 53: Eastern Europe Market Value Share and BPS Analysis by Country, 2025 and 2035
  • Figure 54: Eastern Europe Market Value Share and BPS Analysis by Source, 2025 and 2035
  • Figure 55: Eastern Europe Market Y-o-Y Growth Comparison by Source, 2025 to 2035
  • Figure 56: Eastern Europe Market Attractiveness Analysis by Source
  • Figure 57: Eastern Europe Market Value Share and BPS Analysis by Flavor, 2025 and 2035
  • Figure 58: Eastern Europe Market Y-o-Y Growth Comparison by Flavor, 2025 to 2035
  • Figure 59: Eastern Europe Market Attractiveness Analysis by Flavor
  • Figure 60: Eastern Europe Market Value Share and BPS Analysis by Distribution Channel, 2025 and 2035
  • Figure 61: Eastern Europe Market Y-o-Y Growth Comparison by Distribution Channel, 2025 to 2035
  • Figure 62: Eastern Europe Market Attractiveness Analysis by Distribution Channel
  • Figure 63: East Asia Market Value Share and BPS Analysis by Country, 2025 and 2035
  • Figure 64: East Asia Market Value Share and BPS Analysis by Source, 2025 and 2035
  • Figure 65: East Asia Market Y-o-Y Growth Comparison by Source, 2025 to 2035
  • Figure 66: East Asia Market Attractiveness Analysis by Source
  • Figure 67: East Asia Market Value Share and BPS Analysis by Flavor, 2025 and 2035
  • Figure 68: East Asia Market Y-o-Y Growth Comparison by Flavor, 2025 to 2035
  • Figure 69: East Asia Market Attractiveness Analysis by Flavor
  • Figure 70: East Asia Market Value Share and BPS Analysis by Distribution Channel, 2025 and 2035
  • Figure 71: East Asia Market Y-o-Y Growth Comparison by Distribution Channel, 2025 to 2035
  • Figure 72: East Asia Market Attractiveness Analysis by Distribution Channel
  • Figure 73: South Asia & Pacific Market Value Share and BPS Analysis by Country, 2025 and 2035
  • Figure 74: South Asia & Pacific Market Value Share and BPS Analysis by Source, 2025 and 2035
  • Figure 75: South Asia & Pacific Market Y-o-Y Growth Comparison by Source, 2025 to 2035
  • Figure 76: South Asia & Pacific Market Attractiveness Analysis by Source
  • Figure 77: South Asia & Pacific Market Value Share and BPS Analysis by Flavor, 2025 and 2035
  • Figure 78: South Asia & Pacific Market Y-o-Y Growth Comparison by Flavor, 2025 to 2035
  • Figure 79: South Asia & Pacific Market Attractiveness Analysis by Flavor
  • Figure 80: South Asia & Pacific Market Value Share and BPS Analysis by Distribution Channel, 2025 and 2035
  • Figure 81: South Asia & Pacific Market Y-o-Y Growth Comparison by Distribution Channel, 2025 to 2035
  • Figure 82: South Asia & Pacific Market Attractiveness Analysis by Distribution Channel
  • Figure 83: Middle East and Africa Market Value Share and BPS Analysis by Country, 2025 and 2035
  • Figure 84: Middle East and Africa Market Value Share and BPS Analysis by Source, 2025 and 2035
  • Figure 85: Middle East and Africa Market Y-o-Y Growth Comparison by Source, 2025 to 2035
  • Figure 86: Middle East and Africa Market Attractiveness Analysis by Source
  • Figure 87: Middle East and Africa Market Value Share and BPS Analysis by Flavor, 2025 and 2035
  • Figure 88: Middle East and Africa Market Y-o-Y Growth Comparison by Flavor, 2025 to 2035
  • Figure 89: Middle East and Africa Market Attractiveness Analysis by Flavor
  • Figure 90: Middle East and Africa Market Value Share and BPS Analysis by Distribution Channel, 2025 and 2035
  • Figure 91: Middle East and Africa Market Y-o-Y Growth Comparison by Distribution Channel, 2025 to 2035
  • Figure 92: Middle East and Africa Market Attractiveness Analysis by Distribution Channel
  • Figure 93: Global Market - Tier Structure Analysis
  • Figure 94: Global Market - Company Share Analysis

Frequently Asked Questions

What is the estimated market size of the dairy-free smoothies industry in 2025?

The industry is valued at USD 1.7 billion in 2025.

What is the projected industry size of the dairy-free smoothies industry by 2035?

It is forecasted to reach USD 3.2 billion by 2035.

What is the expected CAGR for the dairy-free smoothies industry between 2025 and 2035?

The industry is anticipated to grow at a CAGR of 6.5% during this period.

Which segment is expected to lead the dairy-free smoothies market in 2025?

Indirect (B2C) Channels are projected to lead the market with a 71% share in 2025.

Which region is expected to witness the highest growth in the dairy-free smoothies market?

Asia Pacific, particularly China, is expected to be the key growth region with a projected growth rate of 8.5%.

Explore Similar Insights

Future Market Insights

Dairy-Free Smoothies Market