The global dairy testing services market is valued at USD 5.0 billion in 2025 and is projected to surpass USD 10.9 billion by 2035. This market is expected to grow at a CAGR of 8.1% over the forecast period. This significant market expansion reflects the increasing prioritization of food safety and quality assurance within the dairy industry.
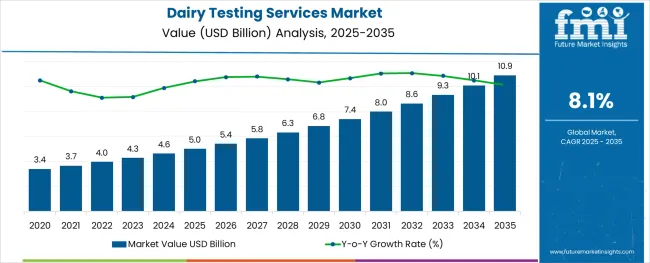
Testing services are essential for detecting contaminants, verifying nutritional content, and ensuring compliance with international safety regulations. As global dairy trade intensifies and processed dairy consumption increases, particularly in urbanizing regions of Asia and Africa, the need for comprehensive testing protocols becomes indispensable.
Governments and regulatory agencies are playing an instrumental role in enforcing strict food safety laws, which in turn is pushing dairy processors and exporters to adopt third-party testing services for certification and traceability.
The industry holds a niche yet increasingly vital share within several broader parent markets. Within the USD 30+ billion global food safety testing market, dairy testing accounts for approximately 12-15%, driven by stringent microbial and quality checks.
In the expansive USD 900 billion dairy industry, around 0.5-0.7% is directed toward testing services, primarily for compliance and export readiness of the USD 25 billion agricultural testing services market. Dairy-related testing, such as raw milk and feed analysis, accounts for 10-12% of the segment.
Within the USD 45 billion food & beverage testing market, dairy contributes nearly 8-10%, reflecting its perishable nature. And in the biotech and diagnostics space, valued at USD 100 billion, dairy-specific diagnostics account for around 1-2%, supported by rapid testing.
The consumption of dairy testing services market was primarily driven by reactive measures related to pandemic-era food safety concerns and intensified scrutiny of supply chain vulnerabilities. As consumers and regulators became more sensitive to hygiene and contamination risks, dairy companies escalated testing protocols, particularly for shelf-stable and export-grade products.
However, this period also saw logistical challenges, inconsistent testing capacities in developing nations, and cost-related constraints that limited widespread adoption. The 2025 to 2035 period marks a structural shift from reactive to proactive quality assurance. As dairy markets mature and global trade normalizes, testing is evolving from a compliance-driven process to a competitive differentiator.
Widespread integration of digital traceability tools, blockchain for supply chain validation, and predictive microbial testing frameworks will drive mainstream adoption. While earlier years were characterized by sudden demand surges and temporary investments, the next few years will be for long-term institutionalization of the dairy testing services market as a core part of food systems.
Pathogen testing, with a 27% share in 2025, leads due to rising food safety concerns and strict global regulations, while PCR technology dominates 37% share for its speed and accuracy in contaminant detection. Pasteurized and modified milk, comprising 40% of the market, drives testing demand due to its high consumption, perishability, and regulatory requirements.
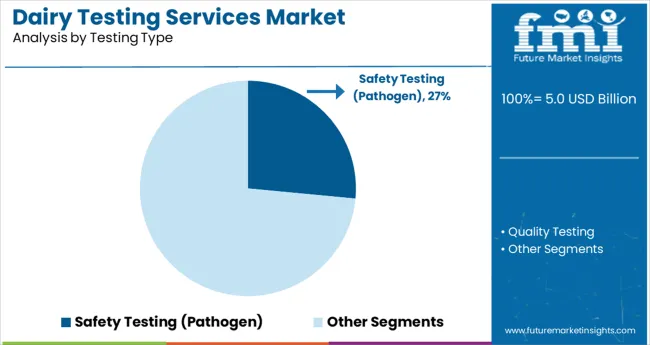
Pathogen testing leads the market due to its critical role in ensuring consumer safety and regulatory compliance. This segment accounts for 27% of the market in 2025, driven by rising incidents of foodborne illnesses and increasingly stringent safety standards enforced by food regulatory authorities across the globe.
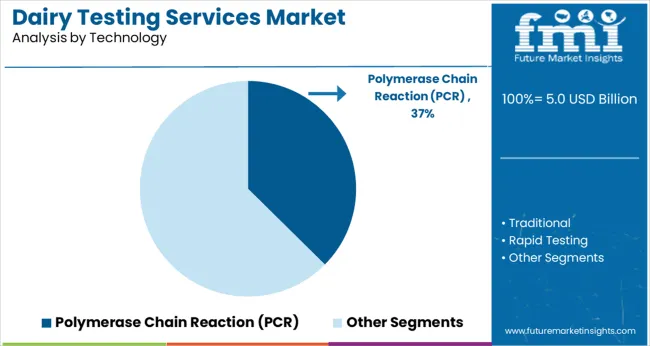
Polymerase Chain Reaction (PCR) technology leads the dairy testing services market with a 37% share in 2025, owing to its unmatched accuracy, sensitivity, and speed.
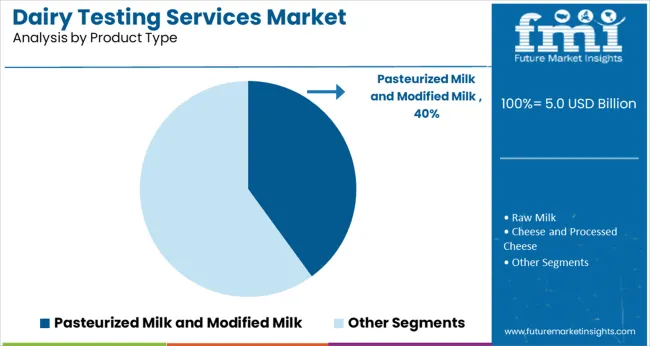
Pasteurized milk and modified milk hold the leading share of 40% in the dairy testing services market in 2025, primarily due to their widespread daily consumption and high perishability. These products are central to global dairy intake, used not only for direct consumption but also in a variety of processed foods, making them highly regulated and frequently tested.
The dairy testing services market is growing due to stricter global regulations and rising demand for safe, traceable dairy products. Limited infrastructure and high costs pose challenges for widespread adoption, especially among small producers.
Key Growth Drivers in the Dairy Testing Services Market
The market is experiencing strong momentum due to heightened regulatory enforcement and consumer health awareness. Governments across developed and developing economies are imposing stricter safety protocols on dairy production and distribution.
Demand for high-quality, contaminant-free milk and milk-based products is accelerating testing frequency at every stage of the supply chain. Export-oriented manufacturers are especially investing in third-party verification to meet global compliance standards.
Market Challenges Impacting Dairy Testing Services
Despite growth, several dynamics are slowing the broader adoption of dairy testing services. Testing infrastructure is still underdeveloped in many rural and emerging regions, limiting consistent implementation. Small- and medium-scale producers often face cost-related barriers that prevent them from conducting routine quality checks. These gaps can undermine standardization and lead to product recalls or trade disruptions.
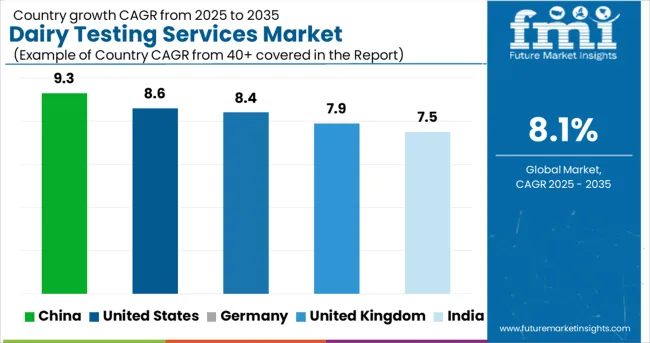
| Countries | CAGR (2025 to 2035) |
|---|---|
| United States | 8.6% |
| Germany | 8.4% |
| United Kingdom | 7.9% |
| China | 9.3% |
| India | 7.5% |
With global CAGR projected at 8.1% through 2035, the dairy testing services market is showing accelerated uptake across BRICS and OECD economies. China leads at 9.3%, outpacing the global average by 1.2 percentage points. Growth is driven by rising consumer scrutiny of milk purity, government-backed traceability mandates, and rapid scaling of automated labs near dairy clusters.
The United States follows at 8.6%, supported by stringent quality protocols in premium cheese, yogurt, and infant formula segments. Germany posts 8.4%, with a strong base in residue, somatic cell, and microbial testing for export-compliant dairy streams.
The United Kingdom stands at 7.9%, slightly below the global average, constrained by budget-pressured public testing systems and consolidation of private labs. India, representing the BRICS cohort, records 7.5% growth. While dairy volumes are high, fragmented infrastructure and informal sourcing slow premium testing uptake. ASEAN countries, notably Thailand and Indonesia, are closing the gap by upgrading lab capacity for antibiotic and adulterant detection in fluid milk.
The CAGR for the UK dairy testing services market increased from approximately 5.4% during 2020 to 2024 to 7.9% between 2025 to 2035, aligning closely with global growth trends at 8.1%. From 2020 to 2024, demand was largely compliance-driven, focusing on pathogen detection and antibiotic residue testing in processed milk and cheese categories.
However, the market was constrained by slower adoption among smaller processors and limited investment in local testing infrastructure. The sharp rise in CAGR from 2025 reflects new UK food safety legislation introduced post-Brexit, which imposed stricter domestic dairy testing norms for traceability and export certification.
Rising consumer demand for nutrient-dense and allergen-tested dairy products has also triggered more extensive microbiological and nutritional profiling. Large-scale UK dairy exporters are integrating third-party testing partnerships to ensure alignment with both EU and non-EU standards.
In the United States, the dairy testing services market posted a CAGR of around 6.7% during 2020 to 2024, which rose to 8.6% for the period 2025 to 2035, slightly above the global average. Early growth was spurred by pathogen outbreaks and renewed focus on dairy safety post-COVID-19, especially across fluid milk and infant formula categories.
However, the market witnessed a sharper acceleration after 2025 due to expanded federal and state-level dairy traceability mandates and stronger enforcement of FSMA (Food Safety Modernization Act) provisions. The industry has also benefited from growing demand for lactose-free and fortified dairy, which requires additional verification and labeling accuracy.
Rising exports of specialty dairy (e.g., whey protein, yogurt) to APAC and Latin America have intensified the need for routine testing across production and logistics chains.
Germany’s dairy testing services market grew at a CAGR of approximately 6.2% from 2020 to 2024, and it is projected to rise to 8.4% during 2025 to 2035, propelled by increased automation in dairy quality control and stronger EU-wide compliance alignment. During the earlier period, testing demand was largely focused on pasteurized milk and soft cheeses, driven by consumer health consciousness and EU food safety protocols.
From 2025 onward, greater digitization in dairy testing, supported by government-backed funding programs, has boosted sample throughput and real-time analytics. German dairy cooperatives and mid-sized processors have increased their testing frequency to meet growing retailer expectations on contaminant-free and nutritionally balanced offerings. The country’s position as one of Europe’s top dairy exporters has also amplified the role of advanced testing platforms to ensure cross-border compliance.
The CAGR of China’s dairy testing services market rose from 7.1% during 2020 to 2024 to 9.3% for 2025 to 2035, reflecting the rapid modernization of domestic dairy supply chains. In the early years, growth was driven by safety incidents that prompted tighter regulatory oversight from authorities such as the SAMR (State Administration for Market Regulation).
During this phase, testing was centered on melamine, antibiotics, and pathogens in infant milk formula and fluid milk. Between 2025 and 2035, accelerated investment in dairy infrastructure, growing middle-class consumption of high-quality dairy, and demand for traceable, additive-free products are fueling robust testing expansion.
The proliferation of smart dairy farms and the integration of blockchain-based supply chains have also increased the use of advanced microbial and nutrient testing to ensure transparency.
India’s dairy testing services market reported a CAGR of 4.9% between 2020 and 2024, rising to 7.5% from 2025 to 2035, supported by evolving food safety awareness and FSSAI-led reforms. During the earlier period, growth was modest due to fragmented supply chains, limited rural lab access, and minimal regulatory enforcement at the unorganized sector level.
However, post to 2025, initiatives under the National Dairy Plan and stricter FSSAI regulations have increased the adoption of routine testing across cooperative and private-sector dairies. Rising urban demand for clean-label milk, fortified dairy beverages, and export-ready ghee and paneer products has necessitated broader testing coverage, including adulterant, residue, and microbial detection.
Leading Company - Eurofins Scientific S.E Industry Share - 17%
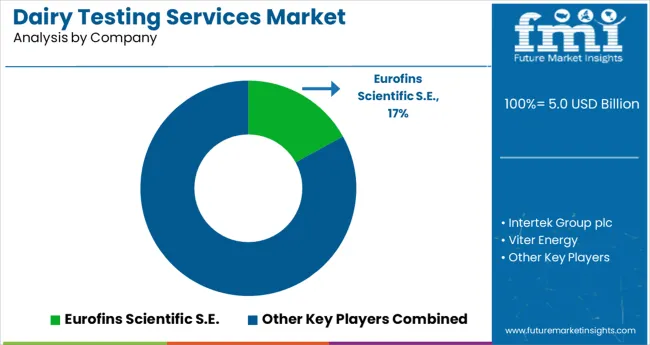
In the dairy testing services market, global players are scaling testing capacities to meet rising food safety standards across value chains. Eurofins Scientific S.E., Intertek Group plc, and SGS SA lead the market with broad testing networks, ISO-accredited labs, and regulatory expertise across pathogen, antibiotic, and nutritional profiling.
These companies serve major dairy exporters and regional cooperatives alike, offering real-time diagnostics and compliance services. Eurofins Scientific S.E. holds the highest market share due to its expansive global lab footprint and advanced microbiological capabilities.
Companies like Bureau Veritas SA, Merieux NutriSciences, Romer Labs (DSM), and TÜV SÜD AG support specialized and regional testing, particularly in contaminants, mycotoxins, and GMO detection. Neogen Corporation adds strength in rapid test kits and dairy diagnostics. Among all, pathogen testing remains the leading segment, driven by regulatory tightening and public health focus.
Recent Industry News
| Report Attributes | Details |
|---|---|
| Industry Size (2025) | USD 5.0 billion |
| Projected Industry Size (2035) | USD 10.9 billion |
| CAGR (2025 to 2035) | 8.1% |
| Base Year for Estimation | 2024 |
| Historical Period | 2020 to 2024 |
| Projections Period | 2025 to 2035 |
| Quantitative Units | USD billion for value and million units for volume |
| Testing Type Analyzed (Segment 1) | Safety Testing (Pathogens, Pesticides, Mycotoxins, Adulterants, and Genetically Modified Organisms (GMOS)) and Quality Testing. |
| Technology Analyzed (Segment 2) | Traditional (Agar Culturing), And Rapid Testing (Convenience-Based, Immunoassay, Chromatography & Spectrometry, and Polymerase Chain Reaction (PCR). |
| Product Type Analyzed (Segment 3) | Raw Milk, Pasteurized Milk/Modified Milk, Cheese And Processed Cheese, Infant Formula, Milk Powder, Fermented Milk, and Others (Cream, Deeps, Dressings). |
| Regions Covered | North America, Latin America, Western Europe, Eastern Europe, East Asia, South Asia & Pacific |
| Countries Covered | United States, Canada, Germany, United Kingdom, France, Italy, Spain, China, India, Japan, South Korea, Australia, Brazil, Mexico, Argentina, Saudi Arabia, UAE, South Africa |
| Key Players | Viter Energy, Intertek Group plc, Eurofins Scientific, SGS SA, Bureau Veritas SA, TÜV SÜD AG, Romer Labs Division Holding GmbH (DSM), Merieux NutriSciences Corporation (INSTITUT MÉRIEUX), Neogen Corporation. |
| Additional Attributes | Dollar sales, share by testing type, product type, and region, regulatory trends, client procurement behavior, fastest-growing segments, competitor positioning, and lab infrastructure expansion. |
The industry includes safety testing (pathogens, pesticides, mycotoxins, adulterants, and genetically modified organisms (GMOS)) and quality testing.
The industry is segmented into traditional (agar culturing) and rapid testing (convenience-based, immunoassay, chromatography & spectrometry, and polymerase chain reaction (PCR).
The segmentation covers raw milk, pasteurized milk/modified milk, cheese and processed cheese, infant formula, milk powder, fermented milk, and others (cream, dips, dressings).
The industry is segmented as North America, Latin America, Western Europe, Eastern Europe, East Asia, South Asia & Pacific.
The industry is projected to reach USD 10.9 billion by 2035.
The industry is expected to grow at a CAGR of 8.1% from 2025 to 2035.
Pasteurized and modified milk are expected to dominate with a 40% share in 2025.
The industry is estimated to reach USD 5.0 billion in 2025.
Asia Pacific, particularly China, is expected to be the key growth region with a growth rate of 9.3%.


Our Research Products

The "Full Research Suite" delivers actionable market intel, deep dives on markets or technologies, so clients act faster, cut risk, and unlock growth.

The Leaderboard benchmarks and ranks top vendors, classifying them as Established Leaders, Leading Challengers, or Disruptors & Challengers.

Locates where complements amplify value and substitutes erode it, forecasting net impact by horizon

We deliver granular, decision-grade intel: market sizing, 5-year forecasts, pricing, adoption, usage, revenue, and operational KPIs—plus competitor tracking, regulation, and value chains—across 60 countries broadly.

Spot the shifts before they hit your P&L. We track inflection points, adoption curves, pricing moves, and ecosystem plays to show where demand is heading, why it is changing, and what to do next across high-growth markets and disruptive tech

Real-time reads of user behavior. We track shifting priorities, perceptions of today’s and next-gen services, and provider experience, then pace how fast tech moves from trial to adoption, blending buyer, consumer, and channel inputs with social signals (#WhySwitch, #UX).

Partner with our analyst team to build a custom report designed around your business priorities. From analysing market trends to assessing competitors or crafting bespoke datasets, we tailor insights to your needs.
Supplier Intelligence
Discovery & Profiling
Capacity & Footprint
Performance & Risk
Compliance & Governance
Commercial Readiness
Who Supplies Whom
Scorecards & Shortlists
Playbooks & Docs
Category Intelligence
Definition & Scope
Demand & Use Cases
Cost Drivers
Market Structure
Supply Chain Map
Trade & Policy
Operating Norms
Deliverables
Buyer Intelligence
Account Basics
Spend & Scope
Procurement Model
Vendor Requirements
Terms & Policies
Entry Strategy
Pain Points & Triggers
Outputs
Pricing Analysis
Benchmarks
Trends
Should-Cost
Indexation
Landed Cost
Commercial Terms
Deliverables
Brand Analysis
Positioning & Value Prop
Share & Presence
Customer Evidence
Go-to-Market
Digital & Reputation
Compliance & Trust
KPIs & Gaps
Outputs
Full Research Suite comprises of:
Market outlook & trends analysis
Interviews & case studies
Strategic recommendations
Vendor profiles & capabilities analysis
5-year forecasts
8 regions and 60+ country-level data splits
Market segment data splits
12 months of continuous data updates
DELIVERED AS:
PDF EXCEL ONLINE
Dairy Product Packaging Market Size and Share Forecast Outlook 2025 to 2035
Dairy Container Market Analysis Size and Share Forecast Outlook 2025 to 2035
Dairy Packaging Market Size and Share Forecast Outlook 2025 to 2035
Dairy Packaging Machine Market Size and Share Forecast Outlook 2025 to 2035
Dairy Alternatives Market Analysis - Size, Share, and Forecast Outlook 2025 to 2035
Dairy Filtration Systems Market Size and Share Forecast Outlook 2025 to 2035
Dairy Ingredients Market Size and Share Forecast Outlook 2025 to 2035
Dairy Concentrate Market Forecast and Outlook 2025 to 2035
Dairy-Free Smoothies Market Analysis - Size, Share, and Forecast Outlook 2025 to 2035
Dairy-Based Dressings Market Analysis - Size, Share, and Forecast Outlook 2025 to 2035
Dairy-Free Spreads Market Analysis - Size, Share, and Forecast Outlook 2025 to 2035
Dairy Blends Market Analysis - Size, Share, and Forecast Outlook 2025 to 2035
Dairy Whiteners Market Analysis - Size, Share, and Forecast Outlook 2025 to 2035
Dairy Enzymes Market Trends - Innovations & Demand 2025 to 2035
Dairy Flavors Market Trends - Growth & Industry Forecast 2025 to 2035
Dairy-Free Evaporated Milk Market Analysis by Application, Type, Sales Channel Through 2025 to 2035
Dairy Protein Crisps Market Flavor, Packaging, Application and Distribution Channel Through 2025 to 2035
Dairy Products Market Analysis by Product Type, End Use, Distribution Channel and Region through 2035
Dairy-Free Cream Market Insights – Plant-Based Dairy Alternatives 2025 to 2035
Dairy Snacks Market Growth - Consumer Preferences & Industry Trends 2025 to 2035

Thank you!
You will receive an email from our Business Development Manager. Please be sure to check your SPAM/JUNK folder too.
Chat With
MaRIA