Dairy Blends Market Size and Share Forecast Outlook 2025 to 2035

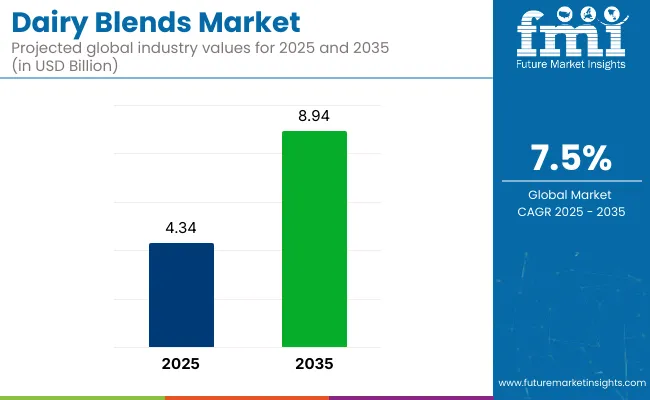
The global dairy blends market is projected to grow from USD 4.34 billion in 2025 to USD 8.94 billion by 2035, reflecting a value-based CAGR of 7.5%. This steady growth is driven by the increasing demand for dairy products blended with other ingredients to meet consumer preferences for enhanced texture, flavor, and nutritional benefits.
Quick Stats of the Dairy Blends Market

  • Market Value (2025): USD 4.34 billion
  • Forecast Value (2035): USD 8.94 billion
  • Global CAGR (2025 to 2035): 7.5%
  • Leading Segment in 2025: Powdered dairy blends (~45% share)
  • Key Growth Region: Asia Pacific (China)
  • Key Players: DSM, CSPC Pharmaceutical Group, Northeast Pharmaceutical Group (NEPG), North China Pharmaceutical Group, Shandong Luwei Pharmaceutical

Dairy Blends Market

Attributes Description
Estimated Global Industry Size (2025E) USD 4.34 billion
Projected Global Value (2035F) USD 8.94 billion
Value-based CAGR (2025 to 2035) 7.5%

Dairy mixtures are being increasingly favored in food processing, particularly in the production of spreads, sauces, and dairy-based beverages. The trend towards premium, functional, and clean-label products is also contributing to the growing adoption of dairy-based mixture in various applications, especially in the foodservice and retail sectors.

The dairy blends industry is estimated to hold a modest share within each of its parent industries, typically ranging from 5-8% of the dairy products industry. Within the food & beverage ingredients industry, approximately 4-6% is accounted for by dairy blends, as they are increasingly used in processed foods and snacks.

A smaller portion, around 3-5%, is represented in the butter & margarine industry, given their functional similarity to traditional butter. Within the functional foods industry, a share of 6-8% is seen, especially in health-conscious formulations. Lastly, in the plant-based dairy alternatives industry, approximately 5-7% is held by dairy blends mixed with plant-based ingredients, reflecting the growing demand for hybrid dairy products.

In 2024, DSM-Firmenich, a global leader in nutrition and health proudly announces ‘Milky Maple’ as its Flavor of the Year for 2025. This unique flavor blend harmoniously combines the creamy softness of milk with the rich, natural sweetness of maple, capturing a global desire for warmth, indulgence, and well-being.

“As food and beverage trends shift toward comfort, nature, and personal wellbeing, people increasingly gravitate towards flavors that offer a taste of familiarity, balance, and connection,” said Maurizio Clementi, Executive Vice President of Taste, Texture, and Health at DSM-Firmenich.

Analyzing Dairy Blends Market by Top Investment Segments

The dairy blends market is segmented by form type into powder, spreadable, and liquid. By product type, it includes milk proteins with vegetable fats, butter blends, cheese blends, whey protein blends, milk powder blends, butter oil blends, and others. By distribution channel, the segmentation covers B2B, hypermarkets/supermarkets, convenience stores, grocery stores, specialty stores, and online retail.

By application, the market includes bakery & confectionery, ice cream & desserts, ready meals, beverages, HoReCa (hotels, restaurants, and cafés), and household consumption. Regional analysis includes North America, Latin America, Western Europe, Eastern Europe, Balkans & Baltic, Russia & Belarus, Central Asia, East Asia, South Asia & Pacific, and Middle East & Africa.

Powdered Blends Anchor Form-based Demand in 2025

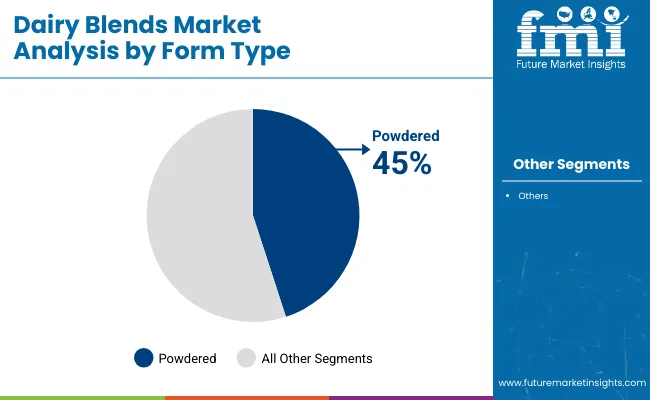
Powdered dairy blends are projected to hold 45% industry share in 2025. Longer shelf life and ease of storage have driven preference for powdered forms across geographies. These blends are being deployed across infant formula, bakery, and beverage applications. Manufacturers like Nestlé, Arla, and DMK have increased focus on powder standardisation to meet regional demand variability. Growth has been steered by improved export logistics, especially in Asia Pacific and Africa. Shelf-stable use in non-refrigerated supply chains remains a key factor.
  • Nestlé Nido has been exported to low-infrastructure regions across West Africa.
  • The ArlaDano line has been used in fortified milk programs across Southeast Asia.
  • DMK whey concentrates have been included in Abbott clinical nutrition formulations.

Dairy Blends Market Analysis By Form Type

Hybrid Milk-Fat Blends Secure Product Share Lead

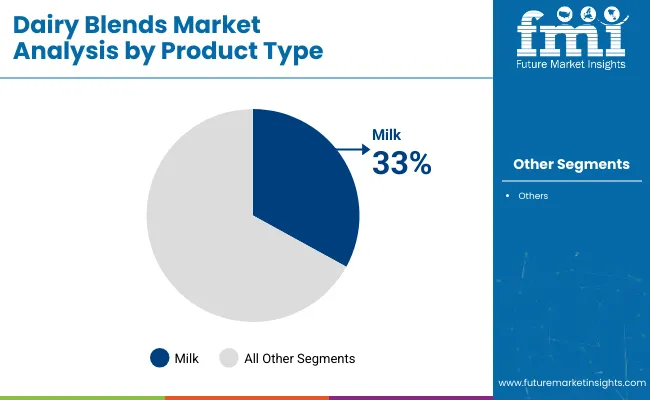
Milk proteins combined with vegetable fats are estimated to reach a 33% share in 2025. Blends designed for lactose-reduction and fat substitution have been implemented by Oatly, Danone, and Nestlé. These formulations have been utilised in coffee mixes, bakery, and ready meals, where texture replication is required without full dairy input. Demand has been supported by rising preference for plant-enhanced profiles. Equipment for spray-dried emulsions has been modified to ensure better fat dispersion across applications.
  • Oatly Barista oat blend has been featured in coffee chains across East Asia.
  • Alpro soy-based dairy mix has been deployed in convenience retail beverages.
  • Nestlé Chef blend has been introduced in institutional low-dairy meal preparation.

Dairy Blends Market Analysis By Product Type

B2B Channel Holds Purchasing Power Across Industries

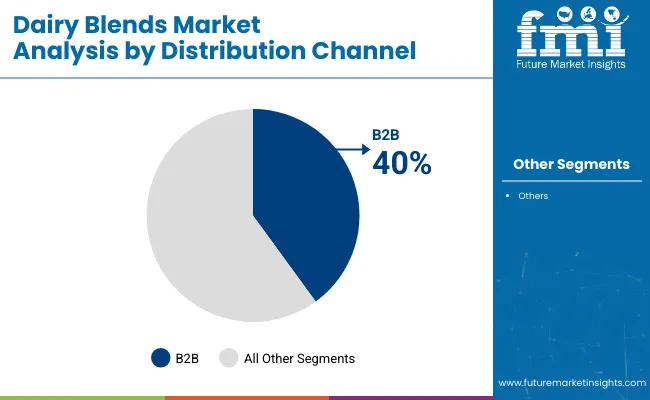
B2B distribution is expected to account for 40% of industry sales by 2025. Foodservice and food manufacturing buyers have opted for direct bulk supply over retail sourcing. Kerry Group, Friesl and Campina, and Nestlé Professional have been engaged in customised dairy blend contracts to ensure uniformity and cost control. Product specification tools and contract packaging have enhanced adoption in industrial kitchens and beverage production units.
  • The Kerry client portal has been used to adjust protein ratios in blends.
  • The Friesl and Campina service model has supported tailored formulation for bakeries.
  • Nestlé Professional has been supplying blend concentrates to institutional kitchens.

Dairy Blends Market Analysis By Distribution Channel

Bakery Demand Propels Application Growth Through 2025

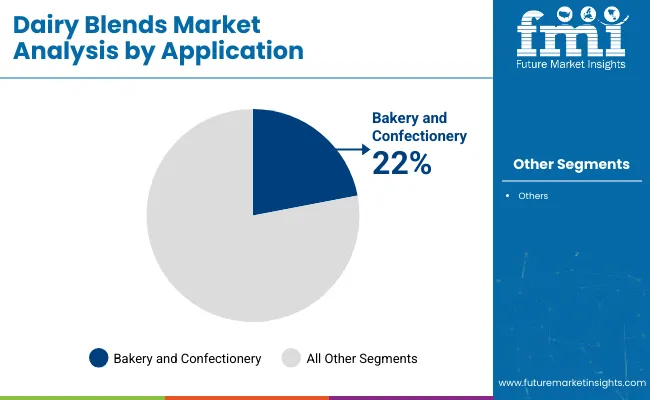
Bakery and confectionery applications are forecast to hold 22% of industry share by 2025. Dairy-based mixtures have been integrated for consistent aeration, extended shelf life, and flavour enhancement in baked goods. Brands like Lactalis, General Mills, and Danone have been leveraging dairy-plant composites for both conventional and plant-forward product lines. Texture enhancement and cost-effective lamination inputs have driven demand across Europe and North America.
  • LactalisPrésident blends have been applied in frozen bakery lamination.
  • General Mills mixes have incorporated dairy-based mixtures for protein boosting.
  • Danone Silk has replaced cream in plant-based bakery fillings.

Dairy Blends Market Analysis By Application

Top Dairy Blends Market Dynamics

The industry is being influenced by a mix of product innovation, changing dietary preferences, and supply-side adaptations. As hybrid dairy solutions gain traction across B2B food manufacturing, rising demand for cost-effective, functional alternatives to traditional dairy ingredients continues to support volume growth. However, volatility in commodity pricing and growing competition from dairy-free blends present persistent challenges.

Consumer Preference Shift Toward Functional Hybrid Dairy

Demand for dairy blends is rising due to their formulation flexibility and ability to deliver enhanced nutrition, taste, and shelf life. These blends, often combining dairy proteins with vegetable oils or functional starches, meet diverse functional needs across bakery, confectionery, and ready-to-eat sectors. Their extended stability and lower cost-to-solids ratio make them ideal for manufacturers facing price pressures.

  • Blends with added proteins and emulsifiers are replacing pure dairy ingredients
  • Rising bakery and beverage applications drive consistent demand in B2B.
  • Cost-saving potential supports adoption in emerging and price-sensitive regions.

Challenges from Ingredient Cost Spikes and Plant-Based Competition

Raw material inflation, especially in dairy fat and caseinate sourcing has increased production costs for manufacturers. The shift toward non-dairy alternatives among younger and flexitarian consumers challenges traditional dairy based mixtures, especially in North America and parts of Europe. Meanwhile, regulatory scrutiny around labelling and compositional transparency has increased compliance costs.
  • Ingredient prices such as SMP and butterfat continue to experience high volatility.
  • Growth of oat, almond, and soy blends diverts food manufacturers away from dairy-based options.
  • Compliance with clean-label expectations strains innovation timelines and cost structures.

Analyzing Top Countries Formulating, Distributing, and Supplying Dairy Blends

Country Wise Analysis Of Dairy Blends Market

Countries CAGR (2025 to 2035)
USA 7.4%
Germany 6.8%
Netherlands 7.6%
China 8.1%
France 7.1%

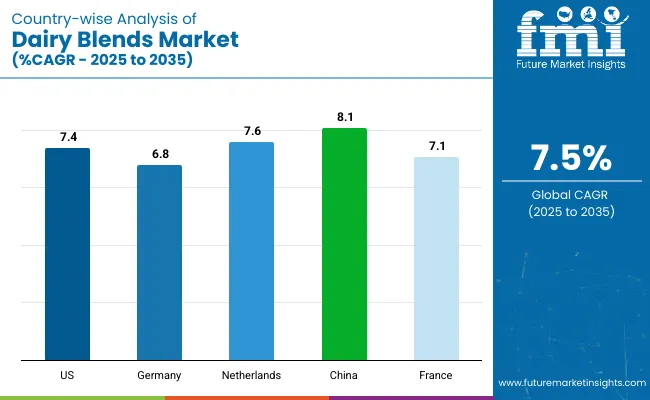
Global dairy blends demand is projected to expand at a 7.5% CAGR between 2025 and 2035. Among the five profiled countries, China leads with 8.1%, followed by the Netherlands at 7.6% and the United States at 7.4%, while France posts 7.1% and Germany records 6.8%. These trends indicate a growth premium of +8% for China, +1% for the Netherlands, and-1% for the United States against the global baseline.

France and Germany trail by -5% and -9%, respectively. Variation stems from China’s expanding dairy intake, the Netherlands' export-oriented dairy output, USA foodservice integration, France’s clean-label alignment, and Germany’s high production overheads.

The report covers detailed analysis of 40+ countries and the top five countries have been shared as a reference.

Analysis of Dairy Blends Market in the United States

The dairy blends market in the United States is projected to expand at a CAGR of 7.4% between 2025 and 2035. Growth is being supported by consumer demand for convenient, nutritious, and clean-label foods. A shift toward functional ingredients has been observed, particularly in ready-to-use formats favored by both retail and foodservice sectors.

Product innovations are being developed to meet health-conscious trends, especially low-fat and protein-rich formulations. Supply chains have been stabilized through participation in USMCA, and regulatory compliance has been maintained across processing and distribution.

  • Ready-to-use dairy blends are being ordered for meal-kit and QSR applications
  • Low-fat, functional variants are being positioned in grocery chilled sections
  • B2B contracts with institutional kitchens are driving volume.

Demand Forecast for Dairy Blends Market in China

Demand for dairy blends in China is forecast to expand at a CAGR of 8.1% through2035. Growth is being driven by increased Western dietary influence and rising preference for functional dairy ingredients. Dairy based mixtures containing added proteins, probiotics, and reduced lactose are being promoted through e-commerce platforms.

Localization of taste profiles and alignment with global nutritional trends have been prioritized by both domestic and international players. China’s position in the BRICS network has enabled large-scale sourcing and cross-border supply of dairy ingredients.

  • Dairy blends with added probiotics are being launched in premium retail channels
  • Digital-first rollout is being used for new formulations.
  • Flavor adaptation is being pursued for regional palates.

Growth Analysis of Dairy Blends Market in Germany

Sales of dairy blends in Germany are projected to witness a CAGR of 6.8% through 2035. Growth is being driven by increased consumer focus on organic-certified, clean-label offerings. Functional benefits, particularly in digestive health and low-fat formulations, are being incorporated into new product lines.

Regulatory expectations under EU27 compliance are being met by major manufacturers. However, production cost pressures are being encountered due to energy and raw material inflation. Emphasis on quality and traceability continues to define domestic output.

  • Organic-certified hybrid inputs are being adopted in high-value niches
  • Low-fat blends are being launched under clean-label programs
  • Inflationary costs are constraining local production scaling.

Future Outlook for Dairy Blends Market in the Netherlands

The Netherlands is positioned for steady growth of dairy blends, with a CAGR of 7.6% expected from 2025 to 2035. Dutch consumers have a deep-rooted appreciation for dairy products, and this cultural affinity provides a strong foundation for the industry.

The demand for functional dairy based mixture that offer specific health benefits, such as improved digestion or enhanced protein content, is particularly high. Additionally, the country's robust dairy infrastructure supports the ongoing expansion of dairy blend offerings, with innovations focused on flavor customization and nutritional enhancements.

  • Protein-rich blends are being prioritised for sports and fortified foods
  • Probiotic dairy matrices are being used in clinical and meal-replacement segments
  • Supply-side stability is being ensured by high-output production plants

Premium Outlook for Dairy Blends Market in France

Demand for dairy blends in France is projected to grow at a CAGR of 7.1% from 2025 to 2035. French consumers, known for their culinary sophistication, are showing a growing preference for premium dairy based mixtures that combine flavor, texture, and nutritional value.

The industry growth is driven by an increased demand for gourmet-style dairy based mixtures, which are incorporated into a variety of dishes. As consumers become more adventurous in their taste preferences, French brands are increasingly innovating with new flavor profiles, ensuring these blends cater to both traditional and modern food trends.

  • Gourmet dairy based mixture are being deployed in frozen pastries and sauces
  • Nutrient-enhanced blends are being formulated into breakfast foods
  • Culinary innovation is guiding new flavor combinations and texture profiles

Leading Players in Dairy Blends Market

The industry is characterized by strong competition among established players and emerging innovators. Kerry Group leads the sector with its extensive portfolio of hybrid dairy-plant blends, while Fonterra Co-operative Group Ltd. strengthens its position through strategic mergers and regional consolidation, particularly in Australia and New Zealand.

Danone S.A. continues to grow by focusing on health-conscious and plant-based product lines, catering to lactose-intolerant and vegan consumers. Lactalis Group is expanding its hybrid offerings in Europe and North America, blending traditional dairy with plant-based alternatives. Emerging players like Oatly and Blue Diamond Growers are gaining traction with innovative oat and almond-based blends, responding to increasing demand for lactose-free options.

Recent Industry News

  • In March 2024, Kerry Dairy launched a new range of oat and dairy-blended products, aiming to provide inclusive options for consumers seeking plant-based alternatives without sacrificing taste or texture. This reflects a broader trend toward hybrid dairy-plant blends product development.
  • In 2024, Royal Friesl and Campina invested in a leading Asian dairy blends producer, thus entering the Southeast Asian market and strengthening its foothold in the specialized dairy nutrition ingredients sector.

Leading Companies in Dairy Blends Market

  • DSM
  • CSPC Pharmaceutical Group
  • Northeast Pharmaceutical Group (NEPG)
  • North China Pharmaceutical Group
  • Shandong Luwei Pharmaceutical
  • Aland Nutraceuticals Group
  • Anhui Tiger Biotech
  • Bactolac Pharmaceuticals
  • Hebei Welcome Pharmaceutical
  • Shandong Tianli Pharmaceutical
  • Zhengzhou Tuoyang
  • Ningxia Qiyuan
  • Henan Huaxing Pharmaceutical
  • Foodchem International Corporation
  • Zhejiang Hangzhou Xinfu Pharmaceutical

Report Coverage and Scope Summary

Report Attributes Details
Estimated Global Industry Size (2025E) USD 4.34 billion
Projected Global Value (2035F) USD 8.94 billion
Value-based CAGR (2025 to 2035) 7.5%
Base Year for Estimation 2024
Historical Period 2020 to 2024
Projections Period 2025 to 2035
Quantitative Units USD million for market value, Metric tons for volume
Form Types Analyzed Powder, Spreadable, Liquid
Product Types Analyzed Milk proteins with vegetable fats, Butter blends, Cheese blends, Whey protein blends, Milk powder blends, Butter oil blends, Others
Distribution Channels Analyzed B2B, Hypermarkets/Supermarkets, Convenience Stores, Grocery Stores, Specialty Stores, Online Retail
Applications Analyzed Bakery & Confectionery, Ice Cream & Desserts, Ready Meals, Beverages, HoReCa, Household Consumption
Regions Covered North America, Latin America, Western Europe, Eastern Europe, Balkans & Baltic, Russia & Belarus, Central Asia, East Asia, South Asia & Pacific, Middle East & Africa
Key Players DSM, CSPC Pharmaceutical Group, Northeast Pharmaceutical Group (NEPG), North China Pharmaceutical Group, Shandong Luwei Pharmaceutical, Aland Nutraceuticals Group, Anhui Tiger Biotech, Bactolac Pharmaceuticals, Hebei Welcome Pharmaceutical, Shandong Tianli Pharmaceutical, Zhengzhou Tuoyang, Ningxia Qiyuan, Henan Huaxing Pharmaceutical, Foodchem International Corporation, Zhejiang Hangzhou Xinfu Pharmaceutical, Others
Additional Attributes Dollar sales by product type and region, demand trends by application and form, impact of online and B2B channels, regional consumption patterns, innovation in protein and fat blends

Key Segments

By Form Type:

The segment is categorized into Powder, Spreadable, and Liquid.

By Product Type:

This includes Milk Proteins with Vegetable Fats, Butter Blends, Cheese Blends, Whey Protein Blends, Milk Powder Blends, Butter Oil Blends, and Others.

By Distribution Channel:

The industry is segmented into B2B, Hypermarkets/Supermarkets, Convenience Stores, Grocery Stores, Specialty Stores, and Online Retail.

By Application:

This segment covers Bakery & Confectionery, Ice Cream & Desserts, Ready Meals, Beverages, HoReCa (Hotels, Restaurants, and Cafés), and Household Consumption.

By Region:

Regional analysis includes North America, Latin America, Western Europe, Eastern Europe, Balkans & Baltic, Russia & Belarus, Central Asia, East Asia, South Asia & Pacific, and Middle East & Africa.

Table of Content

  1. Executive Summary
    • Global Market Outlook
    • Demand-side Trends
    • Supply-side Trends
    • Technology Roadmap Analysis
    • Analysis and Recommendations
  2. Market Overview
    • Market Coverage/Taxonomy
    • Market Definition/Scope/Limitations
  3. Market Background
    • Market Dynamics
      • Drivers
      • Restraints
      • Opportunity
      • Trends
    • Scenario Forecast
      • Demand in Optimistic Scenario
      • Demand in Likely Scenario
      • Demand in Conservative Scenario
    • Opportunity Map Analysis
    • Product Life Cycle Analysis
    • Supply Chain Analysis
      • Supply Side Participants and their Roles
        • Producers
        • Mid-Level Participants (Traders/ Agents/ Brokers)
        • Wholesalers and Distributors
      • Value Added and Value Created at Node in the Supply Chain
      • List of Raw Material Suppliers
      • List of Existing and Potential Buyer’s
    • Investment Feasibility Matrix
    • Value Chain Analysis
      • Profit Margin Analysis
      • Wholesalers and Distributors
      • Retailers
    • PESTLE and Porter’s Analysis
    • Regulatory Landscape
      • By Key Regions
      • By Key Countries
    • Regional Parent Market Outlook
    • Production and Consumption Statistics
    • Import and Export Statistics
  4. Global Market Analysis 2020 to 2024 and Forecast, 2025 to 2035
    • Historical Market Size Value (USD Billion) & Volume (MT) Analysis, 2020 to 2024
    • Current and Future Market Size Value (USD Billion) & Volume (MT) Projections, 2025 to 2035
      • Y-o-Y Growth Trend Analysis
      • Absolute $ Opportunity Analysis
  5. Global Market Pricing Analysis 2020 to 2024 and Forecast 2025 to 2035
  6. Global Market Analysis 2020 to 2024 and Forecast 2025 to 2035, By Form Type
    • Introduction/Key Findings
    • Historical Market Size Value (USD Billion) & Volume (MT) Analysis By Form Type, 2020 to 2024
    • Current and Future Market Size Value (USD Billion) & Volume (MT) Analysis and Forecast By Form Type, 2025 to 2035
      • Powder
      • Spreadable
      • Liquid
    • Y-o-Y Growth Trend Analysis By Form Type, 2020 to 2024
    • Absolute $ Opportunity Analysis By Form Type, 2025 to 2035
  7. Global Market Analysis 2020 to 2024 and Forecast 2025 to 2035, By Product Type
    • Introduction/Key Findings
    • Historical Market Size Value (USD Billion) & Volume (MT) Analysis By Product Type, 2020 to 2024
    • Current and Future Market Size Value (USD Billion) & Volume (MT) Analysis and Forecast By Product Type, 2025 to 2035
      • Milk Proteins with Vegetable Fats
      • Butter Blends
      • Cheese Blends
      • Whey Protein Blends
      • Milk Powder Blends
      • Butter Oil Blends
      • Others
    • Y-o-Y Growth Trend Analysis By Product Type, 2020 to 2024
    • Absolute $ Opportunity Analysis By Product Type, 2025 to 2035
  8. Global Market Analysis 2020 to 2024 and Forecast 2025 to 2035, By Distribution Channel
    • Introduction/Key Findings
    • Historical Market Size Value (USD Billion) & Volume (MT) Analysis By Distribution Channel, 2020 to 2024
    • Current and Future Market Size Value (USD Billion) & Volume (MT) Analysis and Forecast By Distribution Channel, 2025 to 2035
      • B2B
      • Hypermarkets/Supermarkets
      • Convenience Stores
      • Grocery Stores
      • Specialty Stores
      • Online Retail
    • Y-o-Y Growth Trend Analysis By Distribution Channel, 2020 to 2024
    • Absolute $ Opportunity Analysis By Distribution Channel, 2025 to 2035
  9. Global Market Analysis 2020 to 2024 and Forecast 2025 to 2035, By Application
    • Introduction/Key Findings
    • Historical Market Size Value (USD Billion) & Volume (MT) Analysis By Application, 2020 to 2024
    • Current and Future Market Size Value (USD Billion) & Volume (MT) Analysis and Forecast By Application, 2025 to 2035
      • Bakery & Confectionery
      • Ice Cream & Desserts
      • Ready Meals
      • Beverages
      • HoReCa (Hotels, Restaurants, and Cafés)
      • Household Consumption
    • Y-o-Y Growth Trend Analysis By Application, 2020 to 2024
    • Absolute $ Opportunity Analysis By Application, 2025 to 2035
  10. Global Market Analysis 2020 to 2024 and Forecast 2025 to 2035, By Region
    • Introduction
    • Historical Market Size Value (USD Billion) & Volume (MT) Analysis By Region, 2020 to 2024
    • Current Market Size Value (USD Billion) & Volume (MT) Analysis and Forecast By Region, 2025 to 2035
      • North America
      • Latin America
      • Western Europe
      • Eastern Europe
      • East Asia
      • South Asia & Pacific
      • Middle East and Africa
    • Market Attractiveness Analysis By Region
  11. North America Market Analysis 2020 to 2024 and Forecast 2025 to 2035, By Country
    • Historical Market Size Value (USD Billion) & Volume (MT) Trend Analysis By Market Taxonomy, 2020 to 2024
    • Market Size Value (USD Billion) & Volume (MT) Forecast By Market Taxonomy, 2025 to 2035
      • By Country
        • USA
        • Canada
        • Mexico
      • By Form Type
      • By Product Type
      • By Distribution Channel
      • By Application
    • Market Attractiveness Analysis
      • By Country
      • By Form Type
      • By Product Type
      • By Distribution Channel
      • By Application
    • Key Takeaways
  12. Latin America Market Analysis 2020 to 2024 and Forecast 2025 to 2035, By Country
    • Historical Market Size Value (USD Billion) & Volume (MT) Trend Analysis By Market Taxonomy, 2020 to 2024
    • Market Size Value (USD Billion) & Volume (MT) Forecast By Market Taxonomy, 2025 to 2035
      • By Country
        • Brazil
        • Argentina
        • Rest of LATAM
      • By Form Type
      • By Product Type
      • By Distribution Channel
      • By Application
    • Market Attractiveness Analysis
      • By Country
      • By Form Type
      • By Product Type
      • By Distribution Channel
      • By Application
    • Key Takeaways
  13. Western Europe Market Analysis 2020 to 2024 and Forecast 2025 to 2035, By Country
    • Historical Market Size Value (USD Billion) & Volume (MT) Trend Analysis By Market Taxonomy, 2020 to 2024
    • Market Size Value (USD Billion) & Volume (MT) Forecast By Market Taxonomy, 2025 to 2035
      • By Country
        • Germany
        • Italy
        • France
        • UK
        • Spain
        • BENELUX
        • Nordic
        • Rest of W.Europe
      • By Form Type
      • By Product Type
      • By Distribution Channel
      • By Application
    • Market Attractiveness Analysis
      • By Country
      • By Form Type
      • By Product Type
      • By Distribution Channel
      • By Application
    • Key Takeaways
  14. Eastern Europe Market Analysis 2020 to 2024 and Forecast 2025 to 2035, By Country
    • Historical Market Size Value (USD Billion) & Volume (MT) Trend Analysis By Market Taxonomy, 2020 to 2024
    • Market Size Value (USD Billion) & Volume (MT) Forecast By Market Taxonomy, 2025 to 2035
      • By Country
        • Russia
        • Hungary
        • Poland
        • Balkan & Baltics
        • Rest of E. Europe
      • By Form Type
      • By Product Type
      • By Distribution Channel
      • By Application
    • Market Attractiveness Analysis
      • By Country
      • By Form Type
      • By Product Type
      • By Distribution Channel
      • By Application
    • Key Takeaways
  15. East Asia Market Analysis 2020 to 2024 and Forecast 2025 to 2035, By Country
    • Historical Market Size Value (USD Billion) & Volume (MT) Trend Analysis By Market Taxonomy, 2020 to 2024
    • Market Size Value (USD Billion) & Volume (MT) Forecast By Market Taxonomy, 2025 to 2035
      • By Country
        • China
        • Japan
        • South Korea
      • By Form Type
      • By Product Type
      • By Distribution Channel
      • By Application
    • Market Attractiveness Analysis
      • By Country
      • By Form Type
      • By Product Type
      • By Distribution Channel
      • By Application
    • Key Takeaways
  16. South Asia & Pacific Market Analysis 2020 to 2024 and Forecast 2025 to 2035, By Country
    • Historical Market Size Value (USD Billion) & Volume (MT) Trend Analysis By Market Taxonomy, 2020 to 2024
    • Market Size Value (USD Billion) & Volume (MT) Forecast By Market Taxonomy, 2025 to 2035
      • By Country
        • India
        • Australia & New Zealand
        • ASEAN
        • Rest of SAP
      • By Form Type
      • By Product Type
      • By Distribution Channel
      • By Application
    • Market Attractiveness Analysis
      • By Country
      • By Form Type
      • By Product Type
      • By Distribution Channel
      • By Application
    • Key Takeaways
  17. Middle East and Africa Market Analysis 2020 to 2024 and Forecast 2025 to 2035, By Country
    • Historical Market Size Value (USD Billion) & Volume (MT) Trend Analysis By Market Taxonomy, 2020 to 2024
    • Market Size Value (USD Billion) & Volume (MT) Forecast By Market Taxonomy, 2025 to 2035
      • By Country
        • GCC Countries
        • Northern Africa
        • South Africa
        • Turkiye
        • Rest of MEA
      • By Form Type
      • By Product Type
      • By Distribution Channel
      • By Application
    • Market Attractiveness Analysis
      • By Country
      • By Form Type
      • By Product Type
      • By Distribution Channel
      • By Application
    • Key Takeaways
  18. Key Countries Market Analysis
    • USA
      • Pricing Analysis
      • Market Share Analysis, 2024
        • By Form Type
        • By Product Type
        • By Distribution Channel
        • By Application
    • Canada
      • Pricing Analysis
      • Market Share Analysis, 2024
        • By Form Type
        • By Product Type
        • By Distribution Channel
        • By Application
    • Brazil
      • Pricing Analysis
      • Market Share Analysis, 2024
        • By Form Type
        • By Product Type
        • By Distribution Channel
        • By Application
    • Mexico
      • Pricing Analysis
      • Market Share Analysis, 2024
        • By Form Type
        • By Product Type
        • By Distribution Channel
        • By Application
    • Argentina
      • Pricing Analysis
      • Market Share Analysis, 2024
        • By Form Type
        • By Product Type
        • By Distribution Channel
        • By Application
  19. Market Structure Analysis
    • Competition Dashboard
    • Competition Benchmarking
    • Market Share Analysis of Top Players
      • By Regional
      • By Form Type
      • By Product Type
      • By Distribution Channel
      • By Application
  20. Competition Analysis
    • Competition Deep Dive
      • DSM
        • Overview
        • Product Portfolio
        • Profitability by Market Segments (Product/Age /Sales Channel/Region)
        • Sales Footprint
        • Strategy Overview
          • Marketing Strategy
          • Product Strategy
          • Channel Strategy
      • CSPC Pharmaceutical Group
        • Overview
        • Product Portfolio
        • Profitability by Market Segments (Product/Age /Sales Channel/Region)
        • Sales Footprint
        • Strategy Overview
          • Marketing Strategy
          • Product Strategy
          • Channel Strategy
      • Northeast Pharmaceutical Group (NEPG)
        • Overview
        • Product Portfolio
        • Profitability by Market Segments (Product/Age /Sales Channel/Region)
        • Sales Footprint
        • Strategy Overview
          • Marketing Strategy
          • Product Strategy
          • Channel Strategy
      • North China Pharmaceutical Group
        • Overview
        • Product Portfolio
        • Profitability by Market Segments (Product/Age /Sales Channel/Region)
        • Sales Footprint
        • Strategy Overview
          • Marketing Strategy
          • Product Strategy
          • Channel Strategy
      • Shandong Luwei Pharmaceutical
        • Overview
        • Product Portfolio
        • Profitability by Market Segments (Product/Age /Sales Channel/Region)
        • Sales Footprint
        • Strategy Overview
          • Marketing Strategy
          • Product Strategy
          • Channel Strategy
      • Aland Nutraceuticals Group
        • Overview
        • Product Portfolio
        • Profitability by Market Segments (Product/Age /Sales Channel/Region)
        • Sales Footprint
        • Strategy Overview
          • Marketing Strategy
          • Product Strategy
          • Channel Strategy
      • Anhui Tiger Biotech
        • Overview
        • Product Portfolio
        • Profitability by Market Segments (Product/Age /Sales Channel/Region)
        • Sales Footprint
        • Strategy Overview
          • Marketing Strategy
          • Product Strategy
          • Channel Strategy
      • Bactolac Pharmaceuticals
        • Overview
        • Product Portfolio
        • Profitability by Market Segments (Product/Age /Sales Channel/Region)
        • Sales Footprint
        • Strategy Overview
          • Marketing Strategy
          • Product Strategy
          • Channel Strategy
      • Hebei Welcome Pharmaceutical
        • Overview
        • Product Portfolio
        • Profitability by Market Segments (Product/Age /Sales Channel/Region)
        • Sales Footprint
        • Strategy Overview
          • Marketing Strategy
          • Product Strategy
          • Channel Strategy
      • Shandong Tianli Pharmaceutical
        • Overview
        • Product Portfolio
        • Profitability by Market Segments (Product/Age /Sales Channel/Region)
        • Sales Footprint
        • Strategy Overview
          • Marketing Strategy
          • Product Strategy
          • Channel Strategy
      • Zhengzhou Tuoyang
        • Overview
        • Product Portfolio
        • Profitability by Market Segments (Product/Age /Sales Channel/Region)
        • Sales Footprint
        • Strategy Overview
          • Marketing Strategy
          • Product Strategy
          • Channel Strategy
      • Ningxia Qiyuan
        • Overview
        • Product Portfolio
        • Profitability by Market Segments (Product/Age /Sales Channel/Region)
        • Sales Footprint
        • Strategy Overview
          • Marketing Strategy
          • Product Strategy
          • Channel Strategy
      • Henan Huaxing Pharmaceutical
        • Overview
        • Product Portfolio
        • Profitability by Market Segments (Product/Age /Sales Channel/Region)
        • Sales Footprint
        • Strategy Overview
          • Marketing Strategy
          • Product Strategy
          • Channel Strategy
      • Foodchem International Corporation
        • Overview
        • Product Portfolio
        • Profitability by Market Segments (Product/Age /Sales Channel/Region)
        • Sales Footprint
        • Strategy Overview
          • Marketing Strategy
          • Product Strategy
          • Channel Strategy
      • Zhejiang Hangzhou Xinfu Pharmaceutical
        • Overview
        • Product Portfolio
        • Profitability by Market Segments (Product/Age /Sales Channel/Region)
        • Sales Footprint
        • Strategy Overview
          • Marketing Strategy
          • Product Strategy
          • Channel Strategy
  21. Assumptions & Acronyms Used
  22. Research Methodology

List of Tables

  • Table 1: Global Market Value (USD Billion) Forecast by Region, 2020-2035
  • Table 2: Global Market Volume (MT) Forecast by Region, 2020-2035
  • Table 3: Global Market Value (USD Billion) Forecast by Form Type, 2020-2035
  • Table 4: Global Market Volume (MT) Forecast by Form Type, 2020-2035
  • Table 5: Global Market Value (USD Billion) Forecast by Product Type, 2020-2035
  • Table 6: Global Market Volume (MT) Forecast by Product Type, 2020-2035
  • Table 7: Global Market Value (USD Billion) Forecast by Distribution Channel, 2020-2035
  • Table 8: Global Market Volume (MT) Forecast by Distribution Channel, 2020-2035
  • Table 9: Global Market Value (USD Billion) Forecast by Application, 2020-2035
  • Table 10: Global Market Volume (MT) Forecast by Application, 2020-2035
  • Table 11: North America Market Value (USD Billion) Forecast by Country, 2020-2035
  • Table 12: North America Market Volume (MT) Forecast by Country, 2020-2035
  • Table 13: North America Market Value (USD Billion) Forecast by Form Type, 2020-2035
  • Table 14: North America Market Volume (MT) Forecast by Form Type, 2020-2035
  • Table 15: North America Market Value (USD Billion) Forecast by Product Type, 2020-2035
  • Table 16: North America Market Volume (MT) Forecast by Product Type, 2020-2035
  • Table 17: North America Market Value (USD Billion) Forecast by Distribution Channel, 2020-2035
  • Table 18: North America Market Volume (MT) Forecast by Distribution Channel, 2020-2035
  • Table 19: North America Market Value (USD Billion) Forecast by Application, 2020-2035
  • Table 20: North America Market Volume (MT) Forecast by Application, 2020-2035
  • Table 21: Latin America Market Value (USD Billion) Forecast by Country, 2020-2035
  • Table 22: Latin America Market Volume (MT) Forecast by Country, 2020-2035
  • Table 23: Latin America Market Value (USD Billion) Forecast by Form Type, 2020-2035
  • Table 24: Latin America Market Volume (MT) Forecast by Form Type, 2020-2035
  • Table 25: Latin America Market Value (USD Billion) Forecast by Product Type, 2020-2035
  • Table 26: Latin America Market Volume (MT) Forecast by Product Type, 2020-2035
  • Table 27: Latin America Market Value (USD Billion) Forecast by Distribution Channel, 2020-2035
  • Table 28: Latin America Market Volume (MT) Forecast by Distribution Channel, 2020-2035
  • Table 29: Latin America Market Value (USD Billion) Forecast by Application, 2020-2035
  • Table 30: Latin America Market Volume (MT) Forecast by Application, 2020-2035
  • Table 31: Western Europe Market Value (USD Billion) Forecast by Country, 2020-2035
  • Table 32: Western Europe Market Volume (MT) Forecast by Country, 2020-2035
  • Table 33: Western Europe Market Value (USD Billion) Forecast by Form Type, 2020-2035
  • Table 34: Western Europe Market Volume (MT) Forecast by Form Type, 2020-2035
  • Table 35: Western Europe Market Value (USD Billion) Forecast by Product Type, 2020-2035
  • Table 36: Western Europe Market Volume (MT) Forecast by Product Type, 2020-2035
  • Table 37: Western Europe Market Value (USD Billion) Forecast by Distribution Channel, 2020-2035
  • Table 38: Western Europe Market Volume (MT) Forecast by Distribution Channel, 2020-2035
  • Table 39: Western Europe Market Value (USD Billion) Forecast by Application, 2020-2035
  • Table 40: Western Europe Market Volume (MT) Forecast by Application, 2020-2035
  • Table 41: Eastern Europe Market Value (USD Billion) Forecast by Country, 2020-2035
  • Table 42: Eastern Europe Market Volume (MT) Forecast by Country, 2020-2035
  • Table 43: Eastern Europe Market Value (USD Billion) Forecast by Form Type, 2020-2035
  • Table 44: Eastern Europe Market Volume (MT) Forecast by Form Type, 2020-2035
  • Table 45: Eastern Europe Market Value (USD Billion) Forecast by Product Type, 2020-2035
  • Table 46: Eastern Europe Market Volume (MT) Forecast by Product Type, 2020-2035
  • Table 47: Eastern Europe Market Value (USD Billion) Forecast by Distribution Channel, 2020-2035
  • Table 48: Eastern Europe Market Volume (MT) Forecast by Distribution Channel, 2020-2035
  • Table 49: Eastern Europe Market Value (USD Billion) Forecast by Application, 2020-2035
  • Table 50: Eastern Europe Market Volume (MT) Forecast by Application, 2020-2035
  • Table 51: East Asia Market Value (USD Billion) Forecast by Country, 2020-2035
  • Table 52: East Asia Market Volume (MT) Forecast by Country, 2020-2035
  • Table 53: East Asia Market Value (USD Billion) Forecast by Form Type, 2020-2035
  • Table 54: East Asia Market Volume (MT) Forecast by Form Type, 2020-2035
  • Table 55: East Asia Market Value (USD Billion) Forecast by Product Type, 2020-2035
  • Table 56: East Asia Market Volume (MT) Forecast by Product Type, 2020-2035
  • Table 57: East Asia Market Value (USD Billion) Forecast by Distribution Channel, 2020-2035
  • Table 58: East Asia Market Volume (MT) Forecast by Distribution Channel, 2020-2035
  • Table 59: East Asia Market Value (USD Billion) Forecast by Application, 2020-2035
  • Table 60: East Asia Market Volume (MT) Forecast by Application, 2020-2035
  • Table 61: South Asia & Pacific Market Value (USD Billion) Forecast by Country, 2020-2035
  • Table 62: South Asia & Pacific Market Volume (MT) Forecast by Country, 2020-2035
  • Table 63: South Asia & Pacific Market Value (USD Billion) Forecast by Form Type, 2020-2035
  • Table 64: South Asia & Pacific Market Volume (MT) Forecast by Form Type, 2020-2035
  • Table 65: South Asia & Pacific Market Value (USD Billion) Forecast by Product Type, 2020-2035
  • Table 66: South Asia & Pacific Market Volume (MT) Forecast by Product Type, 2020-2035
  • Table 67: South Asia & Pacific Market Value (USD Billion) Forecast by Distribution Channel, 2020-2035
  • Table 68: South Asia & Pacific Market Volume (MT) Forecast by Distribution Channel, 2020-2035
  • Table 69: South Asia & Pacific Market Value (USD Billion) Forecast by Application, 2020-2035
  • Table 70: South Asia & Pacific Market Volume (MT) Forecast by Application, 2020-2035
  • Table 71: Middle East and Africa Market Value (USD Billion) Forecast by Country, 2020-2035
  • Table 72: Middle East and Africa Market Volume (MT) Forecast by Country, 2020-2035
  • Table 73: Middle East and Africa Market Value (USD Billion) Forecast by Form Type, 2020-2035
  • Table 74: Middle East and Africa Market Volume (MT) Forecast by Form Type, 2020-2035
  • Table 75: Middle East and Africa Market Value (USD Billion) Forecast by Product Type, 2020-2035
  • Table 76: Middle East and Africa Market Volume (MT) Forecast by Product Type, 2020-2035
  • Table 77: Middle East and Africa Market Value (USD Billion) Forecast by Distribution Channel, 2020-2035
  • Table 78: Middle East and Africa Market Volume (MT) Forecast by Distribution Channel, 2020-2035
  • Table 79: Middle East and Africa Market Value (USD Billion) Forecast by Application, 2020-2035
  • Table 80: Middle East and Africa Market Volume (MT) Forecast by Application, 2020-2035

List of Figures

  • Figure 1: Global Market Volume (MT) Forecast 2020-2035
  • Figure 2: Global Market Pricing Analysis
  • Figure 3: Global Market Value (USD Billion) Forecast 2020-2035
  • Figure 4: Global Market Value Share and BPS Analysis by Form Type, 2025 and 2035
  • Figure 5: Global Market Y-o-Y Growth Comparison by Form Type, 2025-2035
  • Figure 6: Global Market Attractiveness Analysis by Form Type
  • Figure 7: Global Market Value Share and BPS Analysis by Product Type, 2025 and 2035
  • Figure 8: Global Market Y-o-Y Growth Comparison by Product Type, 2025-2035
  • Figure 9: Global Market Attractiveness Analysis by Product Type
  • Figure 10: Global Market Value Share and BPS Analysis by Distribution Channel, 2025 and 2035
  • Figure 11: Global Market Y-o-Y Growth Comparison by Distribution Channel, 2025-2035
  • Figure 12: Global Market Attractiveness Analysis by Distribution Channel
  • Figure 13: Global Market Value Share and BPS Analysis by Application, 2025 and 2035
  • Figure 14: Global Market Y-o-Y Growth Comparison by Application, 2025-2035
  • Figure 15: Global Market Attractiveness Analysis by Application
  • Figure 16: Global Market Value (USD Billion) Share and BPS Analysis by Region, 2025 and 2035
  • Figure 17: Global Market Y-o-Y Growth Comparison by Region, 2025-2035
  • Figure 18: Global Market Attractiveness Analysis by Region
  • Figure 19: North America Market Incremental $ Opportunity, 2025-2035
  • Figure 20: Latin America Market Incremental $ Opportunity, 2025-2035
  • Figure 21: Western Europe Market Incremental $ Opportunity, 2025-2035
  • Figure 22: Eastern Europe Market Incremental $ Opportunity, 2025-2035
  • Figure 23: East Asia Market Incremental $ Opportunity, 2025-2035
  • Figure 24: South Asia & Pacific Market Incremental $ Opportunity, 2025-2035
  • Figure 25: Middle East and Africa Market Incremental $ Opportunity, 2025-2035
  • Figure 26: North America Market Value Share and BPS Analysis by Country, 2025 and 2035
  • Figure 27: North America Market Value Share and BPS Analysis by Form Type, 2025 and 2035
  • Figure 28: North America Market Y-o-Y Growth Comparison by Form Type, 2025-2035
  • Figure 29: North America Market Attractiveness Analysis by Form Type
  • Figure 30: North America Market Value Share and BPS Analysis by Product Type, 2025 and 2035
  • Figure 31: North America Market Y-o-Y Growth Comparison by Product Type, 2025-2035
  • Figure 32: North America Market Attractiveness Analysis by Product Type
  • Figure 33: North America Market Value Share and BPS Analysis by Distribution Channel, 2025 and 2035
  • Figure 34: North America Market Y-o-Y Growth Comparison by Distribution Channel, 2025-2035
  • Figure 35: North America Market Attractiveness Analysis by Distribution Channel
  • Figure 36: North America Market Value Share and BPS Analysis by Application, 2025 and 2035
  • Figure 37: North America Market Y-o-Y Growth Comparison by Application, 2025-2035
  • Figure 38: North America Market Attractiveness Analysis by Application
  • Figure 39: Latin America Market Value Share and BPS Analysis by Country, 2025 and 2035
  • Figure 40: Latin America Market Value Share and BPS Analysis by Form Type, 2025 and 2035
  • Figure 41: Latin America Market Y-o-Y Growth Comparison by Form Type, 2025-2035
  • Figure 42: Latin America Market Attractiveness Analysis by Form Type
  • Figure 43: Latin America Market Value Share and BPS Analysis by Product Type, 2025 and 2035
  • Figure 44: Latin America Market Y-o-Y Growth Comparison by Product Type, 2025-2035
  • Figure 45: Latin America Market Attractiveness Analysis by Product Type
  • Figure 46: Latin America Market Value Share and BPS Analysis by Distribution Channel, 2025 and 2035
  • Figure 47: Latin America Market Y-o-Y Growth Comparison by Distribution Channel, 2025-2035
  • Figure 48: Latin America Market Attractiveness Analysis by Distribution Channel
  • Figure 49: Latin America Market Value Share and BPS Analysis by Application, 2025 and 2035
  • Figure 50: Latin America Market Y-o-Y Growth Comparison by Application, 2025-2035
  • Figure 51: Latin America Market Attractiveness Analysis by Application
  • Figure 52: Western Europe Market Value Share and BPS Analysis by Country, 2025 and 2035
  • Figure 53: Western Europe Market Value Share and BPS Analysis by Form Type, 2025 and 2035
  • Figure 54: Western Europe Market Y-o-Y Growth Comparison by Form Type, 2025-2035
  • Figure 55: Western Europe Market Attractiveness Analysis by Form Type
  • Figure 56: Western Europe Market Value Share and BPS Analysis by Product Type, 2025 and 2035
  • Figure 57: Western Europe Market Y-o-Y Growth Comparison by Product Type, 2025-2035
  • Figure 58: Western Europe Market Attractiveness Analysis by Product Type
  • Figure 59: Western Europe Market Value Share and BPS Analysis by Distribution Channel, 2025 and 2035
  • Figure 60: Western Europe Market Y-o-Y Growth Comparison by Distribution Channel, 2025-2035
  • Figure 61: Western Europe Market Attractiveness Analysis by Distribution Channel
  • Figure 62: Western Europe Market Value Share and BPS Analysis by Application, 2025 and 2035
  • Figure 63: Western Europe Market Y-o-Y Growth Comparison by Application, 2025-2035
  • Figure 64: Western Europe Market Attractiveness Analysis by Application
  • Figure 65: Eastern Europe Market Value Share and BPS Analysis by Country, 2025 and 2035
  • Figure 66: Eastern Europe Market Value Share and BPS Analysis by Form Type, 2025 and 2035
  • Figure 67: Eastern Europe Market Y-o-Y Growth Comparison by Form Type, 2025-2035
  • Figure 68: Eastern Europe Market Attractiveness Analysis by Form Type
  • Figure 69: Eastern Europe Market Value Share and BPS Analysis by Product Type, 2025 and 2035
  • Figure 70: Eastern Europe Market Y-o-Y Growth Comparison by Product Type, 2025-2035
  • Figure 71: Eastern Europe Market Attractiveness Analysis by Product Type
  • Figure 72: Eastern Europe Market Value Share and BPS Analysis by Distribution Channel, 2025 and 2035
  • Figure 73: Eastern Europe Market Y-o-Y Growth Comparison by Distribution Channel, 2025-2035
  • Figure 74: Eastern Europe Market Attractiveness Analysis by Distribution Channel
  • Figure 75: Eastern Europe Market Value Share and BPS Analysis by Application, 2025 and 2035
  • Figure 76: Eastern Europe Market Y-o-Y Growth Comparison by Application, 2025-2035
  • Figure 77: Eastern Europe Market Attractiveness Analysis by Application
  • Figure 78: East Asia Market Value Share and BPS Analysis by Country, 2025 and 2035
  • Figure 79: East Asia Market Value Share and BPS Analysis by Form Type, 2025 and 2035
  • Figure 80: East Asia Market Y-o-Y Growth Comparison by Form Type, 2025-2035
  • Figure 81: East Asia Market Attractiveness Analysis by Form Type
  • Figure 82: East Asia Market Value Share and BPS Analysis by Product Type, 2025 and 2035
  • Figure 83: East Asia Market Y-o-Y Growth Comparison by Product Type, 2025-2035
  • Figure 84: East Asia Market Attractiveness Analysis by Product Type
  • Figure 85: East Asia Market Value Share and BPS Analysis by Distribution Channel, 2025 and 2035
  • Figure 86: East Asia Market Y-o-Y Growth Comparison by Distribution Channel, 2025-2035
  • Figure 87: East Asia Market Attractiveness Analysis by Distribution Channel
  • Figure 88: East Asia Market Value Share and BPS Analysis by Application, 2025 and 2035
  • Figure 89: East Asia Market Y-o-Y Growth Comparison by Application, 2025-2035
  • Figure 90: East Asia Market Attractiveness Analysis by Application
  • Figure 91: South Asia & Pacific Market Value Share and BPS Analysis by Country, 2025 and 2035
  • Figure 92: South Asia & Pacific Market Value Share and BPS Analysis by Form Type, 2025 and 2035
  • Figure 93: South Asia & Pacific Market Y-o-Y Growth Comparison by Form Type, 2025-2035
  • Figure 94: South Asia & Pacific Market Attractiveness Analysis by Form Type
  • Figure 95: South Asia & Pacific Market Value Share and BPS Analysis by Product Type, 2025 and 2035
  • Figure 96: South Asia & Pacific Market Y-o-Y Growth Comparison by Product Type, 2025-2035
  • Figure 97: South Asia & Pacific Market Attractiveness Analysis by Product Type
  • Figure 98: South Asia & Pacific Market Value Share and BPS Analysis by Distribution Channel, 2025 and 2035
  • Figure 99: South Asia & Pacific Market Y-o-Y Growth Comparison by Distribution Channel, 2025-2035
  • Figure 100: South Asia & Pacific Market Attractiveness Analysis by Distribution Channel
  • Figure 101: South Asia & Pacific Market Value Share and BPS Analysis by Application, 2025 and 2035
  • Figure 102: South Asia & Pacific Market Y-o-Y Growth Comparison by Application, 2025-2035
  • Figure 103: South Asia & Pacific Market Attractiveness Analysis by Application
  • Figure 104: Middle East and Africa Market Value Share and BPS Analysis by Country, 2025 and 2035
  • Figure 105: Middle East and Africa Market Value Share and BPS Analysis by Form Type, 2025 and 2035
  • Figure 106: Middle East and Africa Market Y-o-Y Growth Comparison by Form Type, 2025-2035
  • Figure 107: Middle East and Africa Market Attractiveness Analysis by Form Type
  • Figure 108: Middle East and Africa Market Value Share and BPS Analysis by Product Type, 2025 and 2035
  • Figure 109: Middle East and Africa Market Y-o-Y Growth Comparison by Product Type, 2025-2035
  • Figure 110: Middle East and Africa Market Attractiveness Analysis by Product Type
  • Figure 111: Middle East and Africa Market Value Share and BPS Analysis by Distribution Channel, 2025 and 2035
  • Figure 112: Middle East and Africa Market Y-o-Y Growth Comparison by Distribution Channel, 2025-2035
  • Figure 113: Middle East and Africa Market Attractiveness Analysis by Distribution Channel
  • Figure 114: Middle East and Africa Market Value Share and BPS Analysis by Application, 2025 and 2035
  • Figure 115: Middle East and Africa Market Y-o-Y Growth Comparison by Application, 2025-2035
  • Figure 116: Middle East and Africa Market Attractiveness Analysis by Application
  • Figure 117: Global Market - Tier Structure Analysis
  • Figure 118: Global Market - Company Share Analysis

Frequently Asked Questions

What is the projected industry value of the dairy blends market in 2025?

The industry is projected to reach USD 4.34 billion in 2025.

What is the expected global CAGR for the dairy blends market from 2025 to 2035?

The industry is expected to grow at a CAGR of 7.5% from 2025 to 2035.

Which segment is expected to dominate the dairy blends market in 2025?

Powdered form is expected to capture 45% in 2025.

Which region is forecasted to show significant growth in the dairy blends market by 2025?

The Asia Pacific region, particularly China projected to register a CAGR of 8.1% from 2025 to 2035.

What is the forecasted industry value of the dairy blends market by 2035?

The industry is projected to reach USD 8.94 billion by 2035.

Explore Similar Insights

Future Market Insights

Dairy Blends Market