Dairy Concentrate Market Analysis- Size and Share Forecast Outlook 2025 to 2035

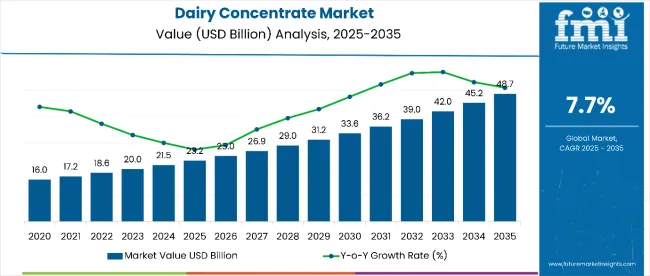
The dairy concentrate market is estimated to be valued at USD 23.2 billion in 2025 and is projected to reach USD 48.7 billion by 2035, registering a CAGR of 7.7% over the forecast period. The dairy concentrate market is projected to add an absolute dollar opportunity of USD 15.5 billion over the forecast period.
Quick Stats for Dairy Concentrate Market

  • Dairy Concentrate Market Value (2025): USD 23.2 billion
  • Dairy Concentrate Market Forecast Value (2035): USD 48.7 billion
  • Dairy Concentrate Market Forecast CAGR:7.7%
  • Leading Segment in Dairy Concentrate Market in 2025:Powder Form (58% market share)
  • Key Growth Regions in Dairy Concentrate Market: North America, Asia Pacific, Europe
  • Top Key Players in Dairy Concentrate Market: Nestlé S.A., Fonterra Co-operative Group, Arla Foods Ingredients, Lactalis Ingredients, Dairy Farmers of America Inc., Glanbia Nutritionals, FrieslandCampina, Saputo Inc., Kerry Group, Ingredion Incorporated, Danone S.A., Land O'Lakes Inc., First Choice Ingredients Inc., Bluegrass Dairy & Food Inc., All American Foods

Dairy Concentrate Market

Metric Value
Estimated Value in (2025E) USD 23.2 billion
Forecast Value in (2035F) USD 48.7 billion
Forecast CAGR (2025 to 2035) 7.7%

This reflects a 1.83 times growth at a compound annual growth rate of 7.7%. The market's evolution is expected to be shaped by rising demand for high-protein nutritional products, convenience foods, and functional dairy ingredients, particularly where enhanced nutritional profiles and extended shelf life are required.

By 2030, the market is likely to reach approximately USD 25.3 billion, accounting for USD 6.6 billion in incremental value over the first half of the decade. The remaining USD 8.9 billion is expected during the second half, suggesting a moderately back-loaded growth pattern. Product innovation in protein concentration and clean-label formulations is gaining traction due to dairy concentrate's favorable nutritional advantages and functional properties.

Companies such as Nestlé and Fonterra are advancing their competitive positions through investment in advanced processing technologies and scalable concentration systems. Health-conscious procurement models are supporting expansion into sports nutrition, infant formula, and functional food applications. Market performance will remain anchored in nutritional efficacy, processing innovation, and clean-label compliance benchmarks.

The dairy concentrate market holds approximately 42% of the functional dairy ingredients market, driven by its superior nutritional density, extended shelf life, and suitability for various food and beverage applications. It accounts for around 35% of the protein fortification ingredients market, supported by its high protein content and compatibility with sports nutrition and health supplements.

The market contributes nearly 28% to the dairy processing ingredients market, particularly for applications requiring concentrated nutritional profiles and functional properties. It holds close to 24% of the infant nutrition ingredients market, where dairy concentrates are essential for meeting specific nutritional requirements. The share in the clean label ingredients market reaches about 31%, reflecting its preference among manufacturers seeking natural, minimally processed dairy solutions.

The market is undergoing structural changes driven by rising demand for high protein, nutrient dense, and convenient food products. Advanced concentration technologies using membrane filtration, spray drying, and freeze concentration have enhanced nutritional profiles, functional properties, and shelf stability, making dairy concentrates viable alternatives to traditional dairy ingredients.

Manufacturers are introducing specialized formulations and customized concentration levels tailored for specific applications, expanding their role beyond basic protein supplementation. Strategic collaborations between dairy processors and food manufacturers have accelerated adoption in functional foods and beverages. Clean label positioning and nutritional transparency have widened consumer acceptance, reshaped traditional ingredient sourcing and forcing conventional dairy suppliers to adapt.

Why is the Dairy Concentrate Market Growing?

Dairy concentrate's superior nutritional density, functional properties, and extended shelf life make it an attractive ingredient for health conscious consumers and food manufacturers seeking high quality protein and nutritional enhancement solutions. This growth is driven by increasing awareness of protein rich diets and functional foods, which is further propelling adoption, especially in sports nutrition, infant formula, and health supplement sectors.

Government initiatives promoting nutritional fortification, along with innovations in concentration technology, are also enhancing product quality and application versatility. Market expansion is supported by technological improvements in concentration processes that ensure nutritional stability during manufacturing and storage.

As health and wellness trends accelerate across demographics and clean label preferences become critical, the market outlook remains favorable. With consumers and manufacturers prioritizing nutritional density, protein quality, and functional benefits, dairy concentrates are well positioned to expand across various food, beverage, and nutraceutical applications. This growth trajectory is anchored in the ingredient's ability to deliver concentrated nutrition while maintaining production efficiency and controlling moisture content in final products.

Segmental Analysis

The market is segmented into form, application, and regions. By form, the market is divided into powder and paste. By application, the market is segmented into snacks & savoury, bakery & confectionery, sauces, dressings, dips, and condiments, ready meals, and other specialized uses. By region, the market is classified into North America, Europe, Asia-Pacific, Latin America, Middle East & Africa.
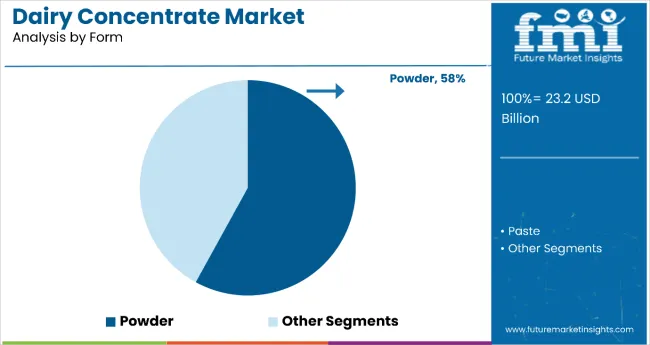
By Form, Powder Segment Accounts for 58% of the Market Share

Dairy Concentrate Market By Form

The powder form segment holds a dominant position with 58% of the market share in the form category, owing to its extended shelf life, ease of storage, and versatile reconstitution properties. Powdered dairy concentrates are widely used across food manufacturing sectors, including bakery, ready meals, and infant nutrition, due to their superior stability and convenience in dry blend formulations.

They enable manufacturers to deliver concentrated nutrition while maintaining production efficiency and controlling moisture content in final products. As demand for shelf stable, clean label, and nutrient dense ingredients grows, the powdered form continues to gain preference in both industrial and commercial applications.

Manufacturers are investing in spray drying technologies, micronization, and formulation improvements to enhance solubility, taste, and bioavailability. The segment is poised to expand further as global supply chains favor dry, lightweight, and transport efficient dairy formats.
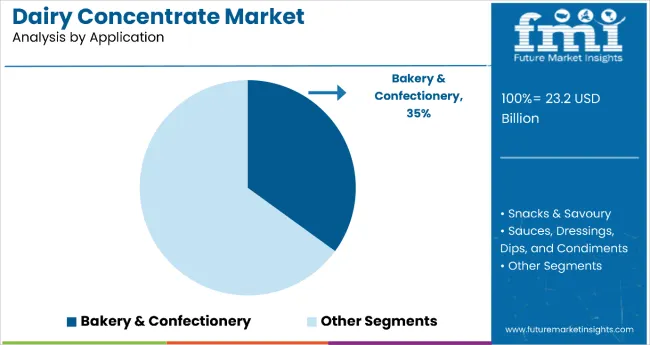
By Application, Bakery & Confectionery Segment Accounts for 35% of the Market Share

Dairy Concentrate Market By Application

Bakery & confectionery remains a core application segment with 35% of the market share in 2025, as dairy concentrates enhance flavor, moisture retention, and protein content in baked goods, fillings, and dairy based confections. Their functional versatility supports product innovation in clean label baked snacks, high protein cookies, and dairy forward chocolate fillings.

Dairy concentrates also improve shelf stability and textural uniformity in baked items, while offering dairy richness without the need for fresh milk. This makes them indispensable in industrial baking environments.

Ongoing demand for fortified indulgence and the premiumization of bakery items are key trends driving the sustained relevance of dairy concentrates in this application.

What are the Drivers, Restraints, and Key Trends of the Dairy Concentrate Market?

In 2024, global dairy concentrate consumption increased by 18% year on year, with Asia Pacific accounting for 38% of demand. Key drivers include growing use in high protein food fortification, nutritional supplements, and functional beverages. Restraints stem from processing complexity and cost intensive formulation.

Trends highlight clean label formulations, advanced concentration ratios, and ready to use dairy blends with integrated nutritional profiles. These innovations enhance transparency, simplify manufacturing, and support consumer confidence in protein rich, health focused products across global markets, positioning dairy concentrates as a preferred solution for versatile applications in food and beverage sectors.

Key Drivers Fueling Dairy Concentrate Market Expansion

Rising demand for protein rich diets and functional food products is the primary driver of dairy concentrate growth, supported by increasing health consciousness among consumers. These concentrates offer up to 85% protein content, significantly higher than conventional dairy components at 25-35%.

Their application in ready to drink formats ensures enhanced nutritional density while reducing serving sizes by up to 65%. Clean label requirements have increased adoption in premium product lines, driven by consumer preference for natural and minimally processed ingredients. Technological improvements in concentration processes ensure nutritional stability during manufacturing and storage, anchored in advanced membrane filtration and spray drying technologies.

Major Restraints Challenging Dairy Concentrate Market Development

Despite strong growth prospects, the market faces hurdles linked to raw material pricing, supply chain complexity, and specialized processing infrastructure. Milk price volatility, ranging from USD 15 to USD 25 per hundredweight, affects concentrate pricing and procurement planning. Concentration processes, combined with strict quality control, extend product development timelines by 4-6 weeks. Cold chain storage and specialized logistics increase distribution expenses by 15-20% compared to conventional dairy ingredients. Limited access to concentration capable facilities further restricts scalability, creating adoption barriers in cost sensitive regions.

Emerging Key Trends Influencing Dairy Concentrate Market Direction

Innovative concentration technologies and multi functional dairy blends are shaping the competitive landscape, driven by manufacturers introducing advanced formulations with enhanced solubility, heat stability, and improved amino acid profiles for broader application versatility. Clean label positioning has become a dominant trend, appealing to consumers seeking natural and transparent ingredient solutions. Ready to use concentrate systems offered by technology providers are reducing complexity for food manufacturers, supported by technological partnerships and integrated processing solutions. Regional adoption patterns show Asia Pacific leading growth, supported by rising demand for protein rich convenience products and fortified beverages across urban populations.
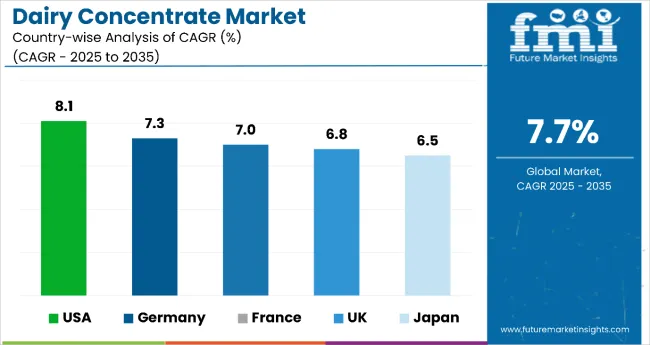
Analysis of Dairy Concentrate Market By Key Countries

Country Wise Analysis Dairy Concentrate Market

Countries CAGR
USA 8.1%
Germany 7.3%
France 7%
UK 6.8%
Japan 6.5%

In the dairy concentrate market, the USA leads with the highest projected CAGR of 8.1% from 2025 to 2035, driven by robust demand in sports and medical nutrition. Germany follows closely with a CAGR of 7.3%, supported by clean label innovations and functional food applications. France is next at 7.0%, benefiting from artisanal and premium food integration. The UK shows moderate growth at 6.8%, constrained by supply challenges but supported by sports nutrition demand. Japan, with a CAGR of 6.5%, experiences steady expansion fueled by precision nutrition and aging population needs, reflecting a regional pivot toward high quality and specialized dairy applications.

The report covers an in depth analysis of 40+ countries; five top performing OECD countries are highlighted below.

Market Expansion in Dairy Concentrate Market in the USA

The revenue from dairy concentrate in the USA is projected to grow at a CAGR of 8.1% from 2025 to 2035, slightly ahead of the global average. Growth is fueled by demand for high protein dairy ingredients in sports nutrition, medical nutrition, and clean label food manufacturing across major urban regions such as California, Illinois, and Texas. USA dairy processors are investing in protein isolation and microfiltration technologies to improve quality and functional performance, supported by strong export activity and rising domestic demand for fortified foods and beverages.

Key Statistics

  • 5.6 million tons of dairy concentrates consumed across food and supplement sectors in 2024
  • 61% of product development includes high protein dairy concentrate applications
  • USD 2.3 billion invested in dairy protein innovation facilities across five states in 2024

Innovation Leadership in Dairy Concentrate Market in Germany

The dairy concentrate market in Germany is anticipated to expand at a CAGR of 7.3% from 2025 to 2035, exceeding the global rate by 0.9%. Growth is centered on functional food innovation and premium nutritional applications in Munich, Hamburg, and Frankfurt regions, driven by advanced concentration technologies and clean label dairy ingredients.

These ingredients are being deployed for sports nutrition, clinical nutrition, and specialty food applications, supported by dairy concentrate partnerships between German food technology companies and European dairy cooperatives. EU nutritional labeling standards and German food safety regulations support practical dairy concentrate application development.

Key Statistics

  • 18 commercial dairy concentrate facilities certified for EU organic standards in 2024
  • 82% of German dairy concentrate products meet clean label compliance requirements in 2024
  • 756 food technologists employed in dairy concentrate research and development in 2024

Market Development in Dairy Concentrate Market in France

The sales of dairy concentrate in France are slated to flourish at a CAGR of 7.0% from 2025 to 2035, marginally above the global average. Growth has been concentrated in premium dairy applications and artisanal food production in Paris, Lyon, and Bordeaux regions, driven by dairy concentrate adoption shifting from industrial applications toward specialized nutrition and gourmet food enhancement. Custom concentration services and specialized processing capabilities lead commercial dairy concentrate deployment, supported by domestic dairy technology partnerships and increased collaboration between French dairy cooperatives and food ingredient companies.

Key Statistics

  • 4.2 million EUR allocated to dairy concentrate innovation projects in France in 2024
  • 26% of dairy concentrate applications focused on premium and artisanal food products in 2024
  • 63 partnership agreements established between French dairy cooperatives and ingredient companies in 2024

Growth Assessment for Dairy Concentrate Market in the United Kingdom

The revenue from dairy concentrate in the UK is expected to grow at a CAGR of 6.8% from 2025 to 2035, underperforming the global average by 0.3%. Demand is driven by sports nutrition growth and functional food development in London, Manchester, and Edinburgh markets, supported by health supplement manufacturers and protein product companies increasingly adopting dairy concentrates for product differentiation and nutritional enhancement.

Dairy concentrate costs remain elevated due to limited domestic concentration capacity and reliance on European suppliers post Brexit trade arrangements. Market growth is shifting toward premium protein products and specialized nutritional applications, especially among fitness focused demographics, anchored in government nutrition guidelines that have helped promote protein consumption.

Key Statistics

  • 1.4 million GBP invested in UK dairy concentrate supply chain development in 2024
  • 48% of dairy concentrate consumption attributed to sports nutrition applications
  • 234 nutrition companies using dairy concentrate ingredients across UK markets in 2024

Japan Dairy Concentrate Market Analysis by Product Type

The dairy concentrate market in Japan is projected to rise at a CAGR of 6.5% from 2025 to 2035, supported by strong demand for precision nutrition and high quality dairy applications. Urban markets like Tokyo, Osaka, and Nagoya are experiencing a shift toward protein fortified foods, infant nutrition products, and functional beverages, driven by domestic dairy companies leveraging imported and domestic concentrates to meet quality expectations for clean label and premium positioned goods.

Key Statistics

  • 29.6% of Japan's dairy concentrate market share attributed to milk concentrate in 2025
  • 22.1% of applications focused on confectionery and premium dairy goods
  • USD 264.2 million revenue contribution from milk concentrate in Japan in 2025

Competitive Landscape of Dairy Concentrate Market

The dairy concentrate market is moderately consolidated, featuring a mix of global dairy giants, specialized ingredient companies, and regional processors with varying degrees of concentration technology, product innovation, and application expertise. Nestlé S.A. and Fonterra Co-operative Group lead the milk based concentrate segment, supplying advanced nutritional ingredients for infant formula, sports nutrition, and functional food applications. Their strength lies in comprehensive dairy processing capabilities, global distribution networks, and established relationships with major food manufacturers.

Arla Foods Ingredients and Lactalis Ingredients differentiate through specialized concentration technologies, custom formulation services, and application specific solutions that cater to premium nutrition and pharmaceutical applications. Dairy Farmers of America Inc. and Glanbia Nutritionals focus on large scale protein concentrate production, addressing growing demand for sports nutrition, functional beverages, and industrial food ingredient applications.

Regional specialists such as FrieslandCampina, Saputo Inc., and Kerry Group emphasize processing innovation, clean label positioning, and sustainable dairy sourcing, creating value in premium ingredient markets and specialized nutrition applications.

Entry barriers remain significant, driven by challenges in advanced processing technology, dairy supply chain integration, and compliance with food safety and nutritional standards across multiple application categories. Competitiveness increasingly depends on concentration efficiency, nutritional customization capabilities, and application development expertise for diverse food and nutrition manufacturing environments.

Key Developments in the Dairy Concentrate Market

Dairy Farmers of America (DFA) launched new products like TruMoo Zero Whole Chocolate Milk (lactose free, zero added sugar), Borden Cheese's "Flavor Sensations" bold flavored slices, and Milk50™, a 50 calorie nutrient rich real dairy milk.

Scope of the Report

Item Value
Quantitative Units USD 23.2 Billion
Form Powder, Paste
Application Snacks & Savoury, Bakery & Confectionery, Sauces, Dressings, Dips, And Condiments, Ready Meals, And Other Specialized Uses
Regions Covered North America, Europe, Latin America, East Asia, South Asia, Oceania, Middle East & Africa
Country Covered United States, Canada, United Kingdom, Germany, France, China, Japan, South Korea, Brazil, Australia, and 40+ countries
Key Companies Profiled Dairy Farmers of America Inc., The Kraft Heinz Company, Land O’ Lakes Inc., All American Foods, Bluegrass Dairy & Food Inc., First Choice Ingredients Inc., Archer Daniels Midland Company, Edlong Dairy Technologies, Ingredion Incorporated, Kerry Group Plc., Vika BV, Fromatech Ingredients B.V., Thornico A/S, and Kanegrade Ltd.
Additional Attributes Dollar sales by product type and concentration level, regional demand trends, competitive landscape, buyer preferences for liquid versus powder formats, integration with clean-label positioning and nutritional profiling, innovations in membrane filtration, spray drying, and sustainable processing methods for enhanced nutritional density and functional properties.

Key Segments

Basis of Form:

  • Powder
  • Paste

Basis of Applications:

  • Snacks & Savoury
  • Bakery & Confectionery
  • Sauces, Dressings, Dips, and Condiments
  • Ready Meals
  • Other Applications

Table of Content

  1. Executive Summary
    • Global Market Outlook
    • Demand-side Trends
    • Supply-side Trends
    • Technology Roadmap Analysis
    • Analysis and Recommendations
  2. Market Overview
    • Market Coverage / Taxonomy
    • Market Definition / Scope / Limitations
  3. Market Background
    • Market Dynamics
      • Drivers
      • Restraints
      • Opportunity
      • Trends
    • Scenario Forecast
      • Demand in Optimistic Scenario
      • Demand in Likely Scenario
      • Demand in Conservative Scenario
    • Opportunity Map Analysis
    • Product Life Cycle Analysis
    • Supply Chain Analysis
      • Supply Side Participants and their Roles
        • Producers
        • Mid-Level Participants (Traders/ Agents/ Brokers)
        • Wholesalers and Distributors
      • Value Added and Value Created at Node in the Supply Chain
      • List of Raw Material Suppliers
      • List of Existing and Potential Buyer’s
    • Investment Feasibility Matrix
    • Value Chain Analysis
      • Profit Margin Analysis
      • Wholesalers and Distributors
      • Retailers
    • PESTLE and Porter’s Analysis
    • Regulatory Landscape
      • By Key Regions
      • By Key Countries
    • Regional Parent Market Outlook
    • Production and Consumption Statistics
    • Import and Export Statistics
  4. Global Market Analysis 2020-2024 and Forecast, 2025-2035
    • Historical Market Size Value (USD Billion) & Volume (Metric Tons) Analysis, 2020-2024
    • Current and Future Market Size Value (USD Billion) & Volume (Metric Tons) Projections, 2025-2035
      • Y-o-Y Growth Trend Analysis
      • Absolute USD Opportunity Analysis
  5. Global Market Pricing Analysis 2020-2024 and Forecast 2025-2035
  6. Global Market Analysis 2020-2024 and Forecast 2025-2035, By Form
    • Introduction / Key Findings
    • Historical Market Size Value (USD Billion) & Volume (Metric Tons) Analysis By Form, 2020-2024
    • Current and Future Market Size Value (USD Billion) & Volume (Metric Tons) Analysis and Forecast By Form, 2025-2035
      • Powder
      • Paste
    • Y-o-Y Growth Trend Analysis By Form, 2020-2024
    • Absolute USD Opportunity Analysis By Form, 2025-2035
  7. Global Market Analysis 2020-2024 and Forecast 2025-2035, By Application
    • Introduction / Key Findings
    • Historical Market Size Value (USD Billion) & Volume (Metric Tons) Analysis By Application, 2020-2024
    • Current and Future Market Size Value (USD Billion) & Volume (Metric Tons) Analysis and Forecast By Application, 2025-2035
      • Snacks & Savoury
      • Bakery & Confectionery
      • Sauces, Dressings, Dips, and Condiments
      • Ready Meals
      • Other Applications
    • Y-o-Y Growth Trend Analysis By Application, 2020-2024
    • Absolute USD Opportunity Analysis By Application, 2025-2035
  8. Global Market Analysis 2020-2024 and Forecast 2025-2035, By Region
    • Introduction
    • Historical Market Size Value (USD Billion) & Volume (Metric Tons) Analysis By Region, 2020-2024
    • Current Market Size Value (USD Billion) & Volume (Metric Tons) Analysis and Forecast By Region, 2025-2035
      • North America
      • Latin America
      • Western Europe
      • Eastern Europe
      • East Asia
      • South Asia & Pacific
      • Middle East and Africa
    • Market Attractiveness Analysis By Region
  9. North America Market Analysis 2020-2024 and Forecast 2025-2035, By Country
    • Historical Market Size Value (USD Billion) & Volume (Metric Tons) Trend Analysis By Market Taxonomy, 2020-2024
    • Market Size Value (USD Billion) & Volume (Metric Tons) Forecast By Market Taxonomy, 2025-2035
      • By Country
        • USA
        • Canada
        • Mexico
      • By Form
      • By Application
    • Market Attractiveness Analysis
      • By Country
      • By Form
      • By Application
    • Key Takeaways
  10. Latin America Market Analysis 2020-2024 and Forecast 2025-2035, By Country
    • Historical Market Size Value (USD Billion) & Volume (Metric Tons) Trend Analysis By Market Taxonomy, 2020-2024
    • Market Size Value (USD Billion) & Volume (Metric Tons) Forecast By Market Taxonomy, 2025-2035
      • By Country
        • Brazil
        • Argentina
        • Rest of LATAM
      • By Form
      • By Application
    • Market Attractiveness Analysis
      • By Country
      • By Form
      • By Application
    • Key Takeaways
  11. Western Europe Market Analysis 2020-2024 and Forecast 2025-2035, By Country
    • Historical Market Size Value (USD Billion) & Volume (Metric Tons) Trend Analysis By Market Taxonomy, 2020-2024
    • Market Size Value (USD Billion) & Volume (Metric Tons) Forecast By Market Taxonomy, 2025-2035
      • By Country
        • Germany
        • Italy
        • France
        • UK
        • Spain
        • BENELUX
        • Nordic
        • Rest of W.Europe
      • By Form
      • By Application
    • Market Attractiveness Analysis
      • By Country
      • By Form
      • By Application
    • Key Takeaways
  12. Eastern Europe Market Analysis 2020-2024 and Forecast 2025-2035, By Country
    • Historical Market Size Value (USD Billion) & Volume (Metric Tons) Trend Analysis By Market Taxonomy, 2020-2024
    • Market Size Value (USD Billion) & Volume (Metric Tons) Forecast By Market Taxonomy, 2025-2035
      • By Country
        • Russia
        • Hungary
        • Poland
        • Balkan & Baltics
        • Rest of E. Europe
      • By Form
      • By Application
    • Market Attractiveness Analysis
      • By Country
      • By Form
      • By Application
    • Key Takeaways
  13. East Asia Market Analysis 2020-2024 and Forecast 2025-2035, By Country
    • Historical Market Size Value (USD Billion) & Volume (Metric Tons) Trend Analysis By Market Taxonomy, 2020-2024
    • Market Size Value (USD Billion) & Volume (Metric Tons) Forecast By Market Taxonomy, 2025-2035
      • By Country
        • China
        • Japan
        • South Korea
      • By Form
      • By Application
    • Market Attractiveness Analysis
      • By Country
      • By Form
      • By Application
    • Key Takeaways
  14. South Asia & Pacific Market Analysis 2020-2024 and Forecast 2025-2035, By Country
    • Historical Market Size Value (USD Billion) & Volume (Metric Tons) Trend Analysis By Market Taxonomy, 2020-2024
    • Market Size Value (USD Billion) & Volume (Metric Tons) Forecast By Market Taxonomy, 2025-2035
      • By Country
        • India
        • Australia & New Zealand
        • ASEAN
        • Rest of SAP
      • By Form
      • By Application
    • Market Attractiveness Analysis
      • By Country
      • By Form
      • By Application
    • Key Takeaways
  15. Middle East and Africa Market Analysis 2020-2024 and Forecast 2025-2035, By Country
    • Historical Market Size Value (USD Billion) & Volume (Metric Tons) Trend Analysis By Market Taxonomy, 2020-2024
    • Market Size Value (USD Billion) & Volume (Metric Tons) Forecast By Market Taxonomy, 2025-2035
      • By Country
        • GCC Countries
        • Northern Africa
        • South Africa
        • Turkiye
        • Rest of MEA
      • By Form
      • By Application
    • Market Attractiveness Analysis
      • By Country
      • By Form
      • By Application
    • Key Takeaways
  16. Key Countries Market Analysis
    • USA
      • Pricing Analysis
      • Market Share Analysis, 2024
        • By Form
        • By Application
    • Canada
      • Pricing Analysis
      • Market Share Analysis, 2024
        • By Form
        • By Application
    • Brazil
      • Pricing Analysis
      • Market Share Analysis, 2024
        • By Form
        • By Application
    • Mexico
      • Pricing Analysis
      • Market Share Analysis, 2024
        • By Form
        • By Application
    • Argentina
      • Pricing Analysis
      • Market Share Analysis, 2024
        • By Form
        • By Application
  17. Market Structure Analysis
    • Competition Dashboard
    • Competition Benchmarking
    • Market Share Analysis of Top Players
      • By Regional
      • By Form
      • By Application
  18. Competition Analysis
    • Competition Deep Dive
      • Dairy Farmers of America Inc.
        • Overview
        • Product Portfolio
        • Profitability by Market Segments (Product/Age /Sales Channel/Region)
        • Sales Footprint
        • Strategy Overview
          • Marketing Strategy
          • Product Strategy
          • Channel Strategy
      • The Kraft Heinz Company
        • Overview
        • Product Portfolio
        • Profitability by Market Segments (Product/Age /Sales Channel/Region)
        • Sales Footprint
        • Strategy Overview
          • Marketing Strategy
          • Product Strategy
          • Channel Strategy
      • Land O’ Lakes Inc.
        • Overview
        • Product Portfolio
        • Profitability by Market Segments (Product/Age /Sales Channel/Region)
        • Sales Footprint
        • Strategy Overview
          • Marketing Strategy
          • Product Strategy
          • Channel Strategy
      • All American Foods
        • Overview
        • Product Portfolio
        • Profitability by Market Segments (Product/Age /Sales Channel/Region)
        • Sales Footprint
        • Strategy Overview
          • Marketing Strategy
          • Product Strategy
          • Channel Strategy
      • Bluegrass Dairy & Food Inc.
        • Overview
        • Product Portfolio
        • Profitability by Market Segments (Product/Age /Sales Channel/Region)
        • Sales Footprint
        • Strategy Overview
          • Marketing Strategy
          • Product Strategy
          • Channel Strategy
      • First Choice Ingredients Inc.
        • Overview
        • Product Portfolio
        • Profitability by Market Segments (Product/Age /Sales Channel/Region)
        • Sales Footprint
        • Strategy Overview
          • Marketing Strategy
          • Product Strategy
          • Channel Strategy
      • Archer Daniels Midland Company
        • Overview
        • Product Portfolio
        • Profitability by Market Segments (Product/Age /Sales Channel/Region)
        • Sales Footprint
        • Strategy Overview
          • Marketing Strategy
          • Product Strategy
          • Channel Strategy
      • Edlong Dairy Technologies
        • Overview
        • Product Portfolio
        • Profitability by Market Segments (Product/Age /Sales Channel/Region)
        • Sales Footprint
        • Strategy Overview
          • Marketing Strategy
          • Product Strategy
          • Channel Strategy
      • The Kraft Heinz Co.
        • Overview
        • Product Portfolio
        • Profitability by Market Segments (Product/Age /Sales Channel/Region)
        • Sales Footprint
        • Strategy Overview
          • Marketing Strategy
          • Product Strategy
          • Channel Strategy
      • Ingredion Incorporated
        • Overview
        • Product Portfolio
        • Profitability by Market Segments (Product/Age /Sales Channel/Region)
        • Sales Footprint
        • Strategy Overview
          • Marketing Strategy
          • Product Strategy
          • Channel Strategy
      • Kerry Group Plc.
        • Overview
        • Product Portfolio
        • Profitability by Market Segments (Product/Age /Sales Channel/Region)
        • Sales Footprint
        • Strategy Overview
          • Marketing Strategy
          • Product Strategy
          • Channel Strategy
      • Vika BV
        • Overview
        • Product Portfolio
        • Profitability by Market Segments (Product/Age /Sales Channel/Region)
        • Sales Footprint
        • Strategy Overview
          • Marketing Strategy
          • Product Strategy
          • Channel Strategy
      • Fromatech Ingredients B.V.
        • Overview
        • Product Portfolio
        • Profitability by Market Segments (Product/Age /Sales Channel/Region)
        • Sales Footprint
        • Strategy Overview
          • Marketing Strategy
          • Product Strategy
          • Channel Strategy
      • Thornico A/S Kanegrade Ltd.
        • Overview
        • Product Portfolio
        • Profitability by Market Segments (Product/Age /Sales Channel/Region)
        • Sales Footprint
        • Strategy Overview
          • Marketing Strategy
          • Product Strategy
          • Channel Strategy
  19. Assumptions & Acronyms Used
  20. Research Methodology

List of Tables

  • Table 1: Global Market Value (USD Billion) Forecast by Region, 2020-2035
  • Table 2: Global Market Volume (Metric Tons) Forecast by Region, 2020-2035
  • Table 3: Global Market Value (USD Billion) Forecast by Form, 2020-2035
  • Table 4: Global Market Volume (Metric Tons) Forecast by Form, 2020-2035
  • Table 5: Global Market Value (USD Billion) Forecast by Application, 2020-2035
  • Table 6: Global Market Volume (Metric Tons) Forecast by Application, 2020-2035
  • Table 7: North America Market Value (USD Billion) Forecast by Country, 2020-2035
  • Table 8: North America Market Volume (Metric Tons) Forecast by Country, 2020-2035
  • Table 9: North America Market Value (USD Billion) Forecast by Form, 2020-2035
  • Table 10: North America Market Volume (Metric Tons) Forecast by Form, 2020-2035
  • Table 11: North America Market Value (USD Billion) Forecast by Application, 2020-2035
  • Table 12: North America Market Volume (Metric Tons) Forecast by Application, 2020-2035
  • Table 13: Latin America Market Value (USD Billion) Forecast by Country, 2020-2035
  • Table 14: Latin America Market Volume (Metric Tons) Forecast by Country, 2020-2035
  • Table 15: Latin America Market Value (USD Billion) Forecast by Form, 2020-2035
  • Table 16: Latin America Market Volume (Metric Tons) Forecast by Form, 2020-2035
  • Table 17: Latin America Market Value (USD Billion) Forecast by Application, 2020-2035
  • Table 18: Latin America Market Volume (Metric Tons) Forecast by Application, 2020-2035
  • Table 19: Western Europe Market Value (USD Billion) Forecast by Country, 2020-2035
  • Table 20: Western Europe Market Volume (Metric Tons) Forecast by Country, 2020-2035
  • Table 21: Western Europe Market Value (USD Billion) Forecast by Form, 2020-2035
  • Table 22: Western Europe Market Volume (Metric Tons) Forecast by Form, 2020-2035
  • Table 23: Western Europe Market Value (USD Billion) Forecast by Application, 2020-2035
  • Table 24: Western Europe Market Volume (Metric Tons) Forecast by Application, 2020-2035
  • Table 25: Eastern Europe Market Value (USD Billion) Forecast by Country, 2020-2035
  • Table 26: Eastern Europe Market Volume (Metric Tons) Forecast by Country, 2020-2035
  • Table 27: Eastern Europe Market Value (USD Billion) Forecast by Form, 2020-2035
  • Table 28: Eastern Europe Market Volume (Metric Tons) Forecast by Form, 2020-2035
  • Table 29: Eastern Europe Market Value (USD Billion) Forecast by Application, 2020-2035
  • Table 30: Eastern Europe Market Volume (Metric Tons) Forecast by Application, 2020-2035
  • Table 31: East Asia Market Value (USD Billion) Forecast by Country, 2020-2035
  • Table 32: East Asia Market Volume (Metric Tons) Forecast by Country, 2020-2035
  • Table 33: East Asia Market Value (USD Billion) Forecast by Form, 2020-2035
  • Table 34: East Asia Market Volume (Metric Tons) Forecast by Form, 2020-2035
  • Table 35: East Asia Market Value (USD Billion) Forecast by Application, 2020-2035
  • Table 36: East Asia Market Volume (Metric Tons) Forecast by Application, 2020-2035
  • Table 37: South Asia & Pacific Market Value (USD Billion) Forecast by Country, 2020-2035
  • Table 38: South Asia & Pacific Market Volume (Metric Tons) Forecast by Country, 2020-2035
  • Table 39: South Asia & Pacific Market Value (USD Billion) Forecast by Form, 2020-2035
  • Table 40: South Asia & Pacific Market Volume (Metric Tons) Forecast by Form, 2020-2035
  • Table 41: South Asia & Pacific Market Value (USD Billion) Forecast by Application, 2020-2035
  • Table 42: South Asia & Pacific Market Volume (Metric Tons) Forecast by Application, 2020-2035
  • Table 43: Middle East and Africa Market Value (USD Billion) Forecast by Country, 2020-2035
  • Table 44: Middle East and Africa Market Volume (Metric Tons) Forecast by Country, 2020-2035
  • Table 45: Middle East and Africa Market Value (USD Billion) Forecast by Form, 2020-2035
  • Table 46: Middle East and Africa Market Volume (Metric Tons) Forecast by Form, 2020-2035
  • Table 47: Middle East and Africa Market Value (USD Billion) Forecast by Application, 2020-2035
  • Table 48: Middle East and Africa Market Volume (Metric Tons) Forecast by Application, 2020-2035

List of Figures

  • Figure 1: Global Market Volume (Metric Tons) Forecast 2020-2035
  • Figure 2: Global Market Pricing Analysis
  • Figure 3: Global Market Value (USD Billion) Forecast 2020-2035
  • Figure 4: Global Market Value Share and BPS Analysis by Form, 2025 and 2035
  • Figure 5: Global Market Y-o-Y Growth Comparison by Form, 2025-2035
  • Figure 6: Global Market Attractiveness Analysis by Form 
  • Figure 7: Global Market Value Share and BPS Analysis by Application, 2025 and 2035
  • Figure 8: Global Market Y-o-Y Growth Comparison by Application, 2025-2035
  • Figure 9: Global Market Attractiveness Analysis by Application
  • Figure 10: Global Market Value (USD Billion) Share and BPS Analysis by Region, 2025 and 2035
  • Figure 11: Global Market Y-o-Y Growth Comparison by Region, 2025-2035
  • Figure 12: Global Market Attractiveness Analysis by Region
  • Figure 13: North America Market Incremental $ Opportunity, 2025-2035
  • Figure 14: Latin America Market Incremental $ Opportunity, 2025-2035
  • Figure 15: Western Europe Market Incremental $ Opportunity, 2025-2035
  • Figure 16: Eastern Europe Market Incremental $ Opportunity, 2025-2035
  • Figure 17: East Asia Market Incremental $ Opportunity, 2025-2035
  • Figure 18: South Asia & Pacific Market Incremental $ Opportunity, 2025-2035
  • Figure 19: Middle East and Africa Market Incremental $ Opportunity, 2025-2035
  • Figure 20: North America Market Value Share and BPS Analysis by Country, 2025 and 2035
  • Figure 21: North America Market Value Share and BPS Analysis by Form, 2025 and 2035
  • Figure 22: North America Market Y-o-Y Growth Comparison by Form, 2025-2035
  • Figure 23: North America Market Attractiveness Analysis by Form 
  • Figure 24: North America Market Value Share and BPS Analysis by Application, 2025 and 2035
  • Figure 25: North America Market Y-o-Y Growth Comparison by Application, 2025-2035
  • Figure 26: North America Market Attractiveness Analysis by Application
  • Figure 27: Latin America Market Value Share and BPS Analysis by Country, 2025 and 2035
  • Figure 28: Latin America Market Value Share and BPS Analysis by Form, 2025 and 2035
  • Figure 29: Latin America Market Y-o-Y Growth Comparison by Form, 2025-2035
  • Figure 30: Latin America Market Attractiveness Analysis by Form 
  • Figure 31: Latin America Market Value Share and BPS Analysis by Application, 2025 and 2035
  • Figure 32: Latin America Market Y-o-Y Growth Comparison by Application, 2025-2035
  • Figure 33: Latin America Market Attractiveness Analysis by Application
  • Figure 34: Western Europe Market Value Share and BPS Analysis by Country, 2025 and 2035
  • Figure 35: Western Europe Market Value Share and BPS Analysis by Form, 2025 and 2035
  • Figure 36: Western Europe Market Y-o-Y Growth Comparison by Form, 2025-2035
  • Figure 37: Western Europe Market Attractiveness Analysis by Form 
  • Figure 38: Western Europe Market Value Share and BPS Analysis by Application, 2025 and 2035
  • Figure 39: Western Europe Market Y-o-Y Growth Comparison by Application, 2025-2035
  • Figure 40: Western Europe Market Attractiveness Analysis by Application
  • Figure 41: Eastern Europe Market Value Share and BPS Analysis by Country, 2025 and 2035
  • Figure 42: Eastern Europe Market Value Share and BPS Analysis by Form, 2025 and 2035
  • Figure 43: Eastern Europe Market Y-o-Y Growth Comparison by Form, 2025-2035
  • Figure 44: Eastern Europe Market Attractiveness Analysis by Form 
  • Figure 45: Eastern Europe Market Value Share and BPS Analysis by Application, 2025 and 2035
  • Figure 46: Eastern Europe Market Y-o-Y Growth Comparison by Application, 2025-2035
  • Figure 47: Eastern Europe Market Attractiveness Analysis by Application
  • Figure 48: East Asia Market Value Share and BPS Analysis by Country, 2025 and 2035
  • Figure 49: East Asia Market Value Share and BPS Analysis by Form, 2025 and 2035
  • Figure 50: East Asia Market Y-o-Y Growth Comparison by Form, 2025-2035
  • Figure 51: East Asia Market Attractiveness Analysis by Form 
  • Figure 52: East Asia Market Value Share and BPS Analysis by Application, 2025 and 2035
  • Figure 53: East Asia Market Y-o-Y Growth Comparison by Application, 2025-2035
  • Figure 54: East Asia Market Attractiveness Analysis by Application
  • Figure 55: South Asia & Pacific Market Value Share and BPS Analysis by Country, 2025 and 2035
  • Figure 56: South Asia & Pacific Market Value Share and BPS Analysis by Form, 2025 and 2035
  • Figure 57: South Asia & Pacific Market Y-o-Y Growth Comparison by Form, 2025-2035
  • Figure 58: South Asia & Pacific Market Attractiveness Analysis by Form 
  • Figure 59: South Asia & Pacific Market Value Share and BPS Analysis by Application, 2025 and 2035
  • Figure 60: South Asia & Pacific Market Y-o-Y Growth Comparison by Application, 2025-2035
  • Figure 61: South Asia & Pacific Market Attractiveness Analysis by Application
  • Figure 62: Middle East and Africa Market Value Share and BPS Analysis by Country, 2025 and 2035
  • Figure 63: Middle East and Africa Market Value Share and BPS Analysis by Form, 2025 and 2035
  • Figure 64: Middle East and Africa Market Y-o-Y Growth Comparison by Form, 2025-2035
  • Figure 65: Middle East and Africa Market Attractiveness Analysis by Form 
  • Figure 66: Middle East and Africa Market Value Share and BPS Analysis by Application, 2025 and 2035
  • Figure 67: Middle East and Africa Market Y-o-Y Growth Comparison by Application, 2025-2035
  • Figure 68: Middle East and Africa Market Attractiveness Analysis by Application
  • Figure 69: Global Market - Tier Structure Analysis
  • Figure 70: Global Market - Company Share Analysis

Frequently Asked Questions

How big is the dairy concentrate market in 2025?

The global dairy concentrate market is estimated to be valued at USD 23.2 billion in 2025.

What will be the size of dairy concentrate market in 2035?

The market size for the dairy concentrate market is projected to reach USD 48.7 billion by 2035.

How much will be the dairy concentrate market growth between 2025 and 2035?

The dairy concentrate market is expected to grow at a 7.7% CAGR between 2025 and 2035.

Which form type is projected to lead in the dairy concentrate market in 2025?

The powder form is projected to lead in the dairy concentrate market with 58% market share in 2025.

Which application segment to contribute significant share in the dairy concentrate market in 2025?

In terms of application, bakery & confectionery segment to command 35% share in the dairy concentrate market in 2025.

Explore Similar Insights

Future Market Insights

Dairy Concentrate Market