Dairy Filtration Systems Market Size and Share Forecast Outlook (2023 to 2033)

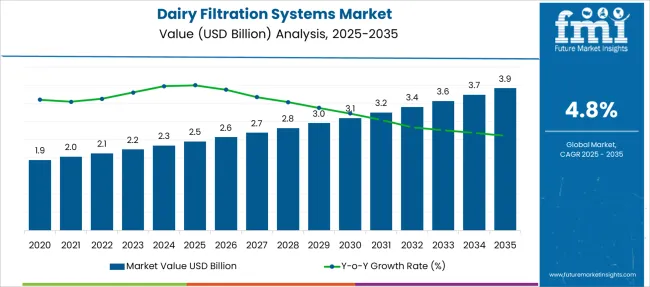
The global dairy filtration systems market size is expected to reach USD 2,231 Million in 2023. Furthermore, with the rapid expansion of the dairy industry worldwide, the overall demand for dairy filtration systems is projected to grow at 4.8% CAGR during the forecast period (2023 to 2033), surpassing a market valuation of USD 3,585.0 Million by 2033.

Milk is one of the most commonly consumed dairy products across various countries of the world. It is an essential source of proteins, calcium, and other nutrients. However, it has been observed that the consumption of raw milk can cause several foodborne illnesses due to the presence of pathogens. As a result, filtering this raw milk becomes necessary. This has brought the dairy filtration systems market into the spotlight.

Dairy filtration systems are equipment used for separating or removing unwanted particles from the milk. They have gained immense traction across the world due to their ability to separate various components of milk. Filtering milk by using these systems ensures that it is of the highest quality.

The rapid expansion of the dairy industry along with the increasing adoption of dairy filtration systems across this sector is a key factor driving the global dairy filtration systems market and the trend is likely to continue during the forecast period.

Similarly, the growing need for improving the quality of milk products and reducing the burden of foodborne diseases is expected to boost sales of dairy filtration systems during the next ten years.

Additionally, increasing demand for milk protein concentrates and isolates that are generally manufactured from skim milk through the use of membrane filtration technology will bode well for the global dairy filtration systems market.

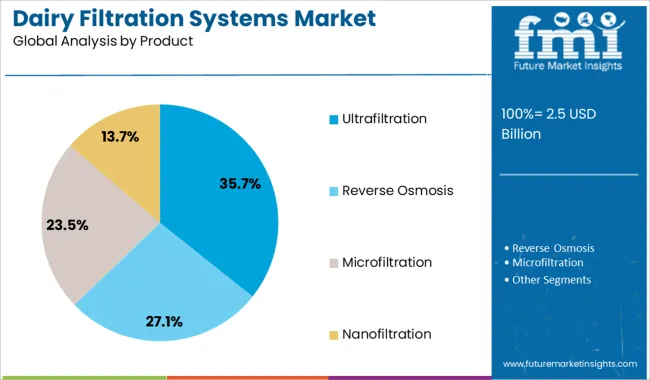
Reverse osmosis holds the largest market share and is most frequently used to create whey and milk concentrates. Reverse osmosis is typically used in the dairy sector for water reclamation, milk solids recovery, and volume reduction of milk and whey.

On the other hand, microfiltration uses low pressure and is based on an open-structured membrane. While the membrane rejects the majority of non-dissolved components, it enables dissolved components to pass. Microfiltration is frequently used in the dairy sector for reducing bacteria and spores, removing fat from milk and whey, and standardizing casein and protein.

Attribute Key Statistics
Dairy Filtration Systems Market Estimated Value (2023) USD 2,231 Million
Projected Market Value (2033) USD 3,565 Million
Value-based CAGR (2023 to 2033) 4.8%
Market Share of North America 38%

Regionally, North America holds the largest market share and it is anticipated to retain its dominance during the projection period. This can be attributed to the strict laws and regulations in the US that are in place to guarantee that the milk being produced is free of contaminants and bacteria.

Comparison of 2018 to 2022 Trends vs 2023 to 2033 Demand Forecast for Dairy Filtration Systems

The global dairy filtration systems market is projected to expand at 4.8% CAGR between 2023 and 2033 in comparison to the 3.3% CAGR registered during the historical period from 2018 to 2022. The growing adoption of dairy filtration systems across the thriving dairy industry is a key factor driving demand in the global market.

Over the years, the growing prevalence of foodborne diseases and rising food safety concerns have necessitated the adoption of filtration systems across dairy industries. These filtration systems are being increasingly used to remove spores, bacteria, fat globules, whey, and other components from milk.

Growing demand for milk protein concentrates and isolates across the world due to increasing health awareness, a rising number of fitness enthusiasts, and changing eating habits is expected to boost the growth of dairy filtration systems during the forecast period.

Similarly, the introduction of new food safety regulations for improving food quality and safety will aid in the expansion of dairy filtration systems over the next decade.

Key Trends Shaping the Dairy Filtration Systems Industry

A number of influential factors have been identified that are expected to drive the global dairy filtration systems market forward during the assessment period (2023 to 2033). Besides the proliferating aspects prevailing in the market, the analysts at FMI have also analyzed the restraining elements, lucrative opportunities, and upcoming threats that can somehow impact market dynamics.

The drivers, restraints, opportunities, and threats (DROTs) identified are as follows:

DRIVERS

  • The rapid expansion of the dairy industry across the world is expected to drive the dairy filtration systems market swiftly during the forecast period.
  • Growing safety concerns along with the implementation of stringent food safety regulations by governments and other regulatory bodies are likely to push the demand for dairy filtration systems.

RESTRAINTS

  • The high cost of dairy filtration systems is limiting market expansion.
  • Lack of awareness about the benefits of using these filtration systems across lower economies is also negatively impacting the global market.

OPPORTUNITIES

  • Growing demand for premium quality dairy products and a rising number of start-ups are expected to create lucrative growth avenues in the global dairy filtration systems market during the projected period.
  • Advancements in dairy filtration technology are expected to generate opportunities for dairy filtration system manufacturers.

THREATS

  • Low product penetration across some developing and underdeveloped nations is likely to inhibit growth during the forecast period.

Analysis of Top Countries Driving Dairy Filtration Systems Adoption and Deployment

What Makes the USA a Dominant Dairy Filtration Systems Market?

Presence of Stringent Regulations Driving Market in the USA

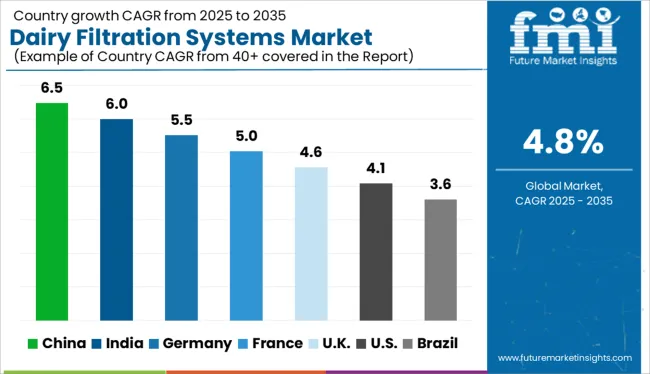
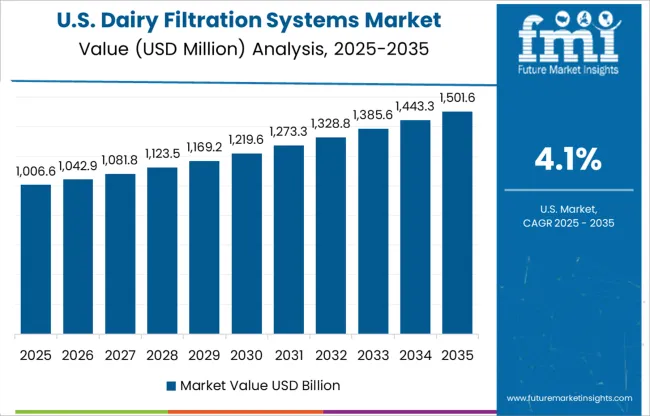
According to FMI, the USA dairy filtration systems market is currently valued at USD 576.5 Million and it accounts for a market share of 68% in the North American dairy filtration systems market. Growing consumer demand for high-quality dairy products and the rising adoption of advanced filtration technologies by dairy manufacturing companies are driving the USA dairy filtration systems market.

All dairy processing facilities and dairy farmers across the USA are required by stringent laws and regulations to ensure that the milk they are producing is free of pollutants and microorganisms. Bacterial (Standard Plate Count) Limits and Somatic Cell Count in milk shall not be greater than 50,000 per ml and 600,000 per ml, respectively, in California. This has generated huge demand for dairy filtration systems in the country and the trend is likely to continue during the forecast period.

Similarly, the heavy presence of leading manufacturers which are constantly striving to introduce new and advanced filtration systems is positively impacting the USA dairy filtration systems market.

Why is Demand for Dairy Filtration Systems Rising in India?

Rising Production and Consumption of Milk Pushing Demand in India

Demand for dairy filtration systems across India is projected to grow at a steady pace during the next ten years owing to the rapid growth of the dairy industry, increasing penetration of automation across dairy processing industries, and favorable government support.

India has the largest dairy herd in the world, producing 187 million tonnes of milk annually from approximately 300 million cattle. India leads all other nations in both milk production and consumption. In order to filter this huge amount of raw milk and make it consumable, companies are employing dairy filtration systems.

The dairy filtering systems market in India is seeing a large influx of new local manufacturers, and competition is heating up quickly. Companies are coming up with novel dairy filtration products with cost-efficient features. This will further expand the dairy filtration systems market in India during the projected period.

How Will Growth Unfold in China's Dairy Filtration Systems Market?

Increasing Adoption of Membrane Filtration Technology Boosting market in China

According to FMI, China’s dairy filtration systems market size reached USD 128.5 Million in 2022 and it holds around 32% share of the Asia Pacific dairy filtration systems market. Furthermore, with the growing adoption of membrane filtration technology across the thriving dairy industry, the overall dairy filtration systems market in China is poised to exhibit strong growth during the next ten years (2023 to 2033).

Dairy filtration technology is in high demand in this country owing to the increased use in dairy and food industries for pasteurization, sterilization, and concentration operations. Similarly, increasing consumer spending on dairy products will aid in the expansion of the dairy filtration systems market during the projection period.

Dairy Filtration Systems Industry Analysis by Top Product and Application Categories

Which Product Type Contributes Most to the Global Dairy Filtration Systems Market?

Demand Remains High for Reverse Osmosis-based Dairy Filtration Systems

Based on product, the global dairy filtration system market is segmented into reverse osmosis, ultrafiltration, microfiltration, and nanofiltration. Among these, reverse osmosis holds the largest market share of the global dairy filtration systems market. This can be attributed to the rising usage of reverse osmosis-based filtration systems across the dairy industry.

Reverse osmosis is most frequently used in the dairy sector for water reclamation, milk solids recovery, and volume reduction of milk and whey. It helps manufacturers easily create quality whey and milk concentrates,
Competitive Outlook for the Dairy Filtration Systems Industry

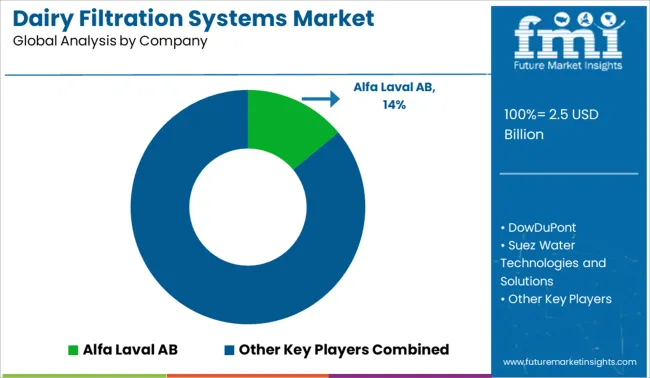
3M Co., GEA Group, The Wabag Group, Alfa Laval, Cytiva, Porvair, Koch Membrane Systems, and Veolia Water Technologies are key participants in the global dairy filtration systems market.

The quickly changing technical environment is prompting manufacturers to refresh their product portfolio on a regular basis. Hence, key participants are investing in research and development activities to develop advanced dairy filtration systems. Besides this, they are adopting strategies such as partnerships, acquisitions, partnerships, mergers, collaborations, and facility expansion to expand their global footprint. For instance,

  • In 2018, Pall Corporation established a Biotech Integrated Solutions Center of Excellence in Shanghai, China. The state-of-the-art facility is newly built for technology demonstration, bioprocess engineering consultancy, testing, and training for China and the rest of Asia, and is strategically positioned in the heart of Shanghai's renowned life science cluster.
  • In 2021, Alfa Laval expanded its line of Unique DV-ST Ultrapure diaphragm valves to address the growing need for more effective aseptic processing.
  • In 2020, Koch Separation Solutions (KSS), a global leader in membrane filtration and ion exchange technology, announced that it is expanding the manufacturing capacity of its innovative PURON® reinforced hollow fiber membrane technology by 50%

Scope of the Dairy Filtration Systems Market Report

Attribute Details
Estimated Market Size (2023) USD 2,231 Million
Projected Market Size (2033) USD 3,565 Million
Anticipated Growth Rate (2023 to 2033) 4.8% CAGR
Forecast Period 2023 to 2033
Historical Data Available for 2018 to 2022
Market Analysis USD Million for Value and Units for Volume
Key Regions Covered North America; Latin America; Europe; South Asia; East Asia; Oceania; Middle East & Africa (MEA)
Key Countries Covered The USA, Canada, Mexico, Germany, The UK, France, Italy, Spain, China, Japan, India, South Korea, Australia, Brazil, Argentina, South Africa, UAE
Key Segments Covered Membrane Material, Module Design, Product, Application, Region
Key Companies Profiled Suez Water Technologies and Solutions (USA), GEA Group AG (Germany), Veolia (France), O. Smith Corporation (USA), Porvair Filtration Group (UK), Alfa Laval AB (Sweden), DowDuPont (USA), Pall Corporation (USA), 3M Company (USA), Koch Membrane Systems Inc (USA), SPX Flow, Inc. (USA), Prominent GmbH (Germany), Pentair Plc. (USA), Brita LP (USA), Eureka Forbes Ltd. (India)
Report Coverage Market Forecast, Company Share Analysis, Competitive Landscape, DROT Analysis, Market Dynamics and Challenges, and Strategic Growth Initiatives

Outlook by Category in the Dairy Filtration Systems Industry

By Membrane Material:

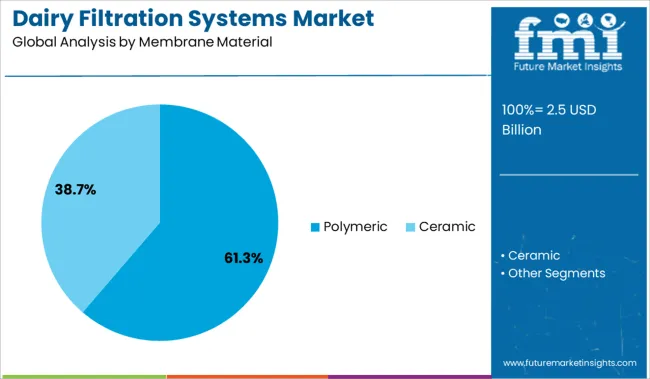
  • Polymeric
  • Ceramic

By Module Design:

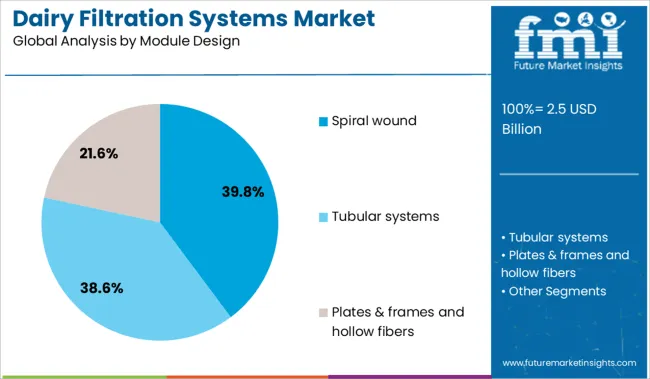
  • Tubular systems
  • Spiral wound
  • Plates & frames and hollow fibers

By Product:

  • Reverse Osmosis
  • Ultrafiltration
  • Microfiltration
  • Nanofiltration

By Application:

  • Processed Milk
  • Milk Powder
  • Cream
  • Cheese
  • Yogurt

By Region:

  • North America
  • Latin America
  • Europe
  • East Asia
  • South Asia
  • Oceania
  • Middle East & Africa (MEA)

Table of Content

  • 1. Executive Summary
  • 2. Market Overview
  • 3. Market Background
  • 4. Global Market Analysis 2018 to 2022 and Forecast, 2023 to 2033
  • 5. Global Market Analysis 2018 to 2022 and Forecast 2023 to 2033, By Membrane Material
    • 5.1. Polymeric
    • 5.2. Ceramic
  • 6. Global Market Analysis 2018 to 2022 and Forecast 2023 to 2033, By Module Design
    • 6.1. Spiral wound
    • 6.2. Tubular systems
    • 6.3. Plates & frames and hollow fibers
  • 7. Global Market Analysis 2018 to 2022 and Forecast 2023 to 2033, By Product
    • 7.1. Reverse Osmosis
    • 7.2. Ultrafiltration
    • 7.3. Microfiltration
    • 7.4. Nanofiltration
  • 8. Global Market Analysis 2018 to 2022 and Forecast 2023 to 2033, By Application
    • 8.1. Processed Milk
    • 8.2. Milk Powder
    • 8.3. Cream
    • 8.4. Cheese
    • 8.5. Yoghurt
  • 9. Global Market Analysis 2018 to 2022 and Forecast 2023 to 2033, By Region
    • 9.1. North America
    • 9.2. Latin America
    • 9.3. Europe
    • 9.4. East Asia
    • 9.5. South Asia
    • 9.6. Oceania
    • 9.7. Middle East & Africa (MEA)
  • 10. North America Market Analysis 2018 to 2022 and Forecast 2023 to 2033, By Country
  • 11. Latin America Market Analysis 2018 to 2022 and Forecast 2023 to 2033, By Country
  • 12. Europe Market Analysis 2018 to 2022 and Forecast 2023 to 2033, By Country
  • 13. East Asia Market Analysis 2018 to 2022 and Forecast 2023 to 2033, By Country
  • 14. South Asia Market Analysis 2018 to 2022 and Forecast 2023 to 2033, By Country
  • 15. Oceania Market Analysis 2018 to 2022 and Forecast 2023 to 2033, By Country
  • 16. MEA Market Analysis 2018 to 2022 and Forecast 2023 to 2033, By Country
  • 17. Key Countries Market Analysis
  • 18. Market Structure Analysis
  • 19. Competition Analysis
    • 19.1. DowDuPont (USA)
    • 19.2. Suez Water Technologies and Solutions (USA)
    • 19.3. Alfa Laval AB (Sweden)
    • 19.4. GEA Group AG (Germany)
    • 19.5. Pall Corporation (USA)
    • 19.6. 3M Company (USA)
    • 19.7. Koch Membrane Systems Inc (USA)
    • 19.8. Veolia (France)
    • 19.9. SPX Flow, Inc. (USA)
    • 19.10. Prominent GmbH (Germany)
    • 19.11. Others (On Additional Request)
  • 20. Assumptions & Acronyms Used
  • 21. Research Methodology

List of Tables

Table 1: Global Market Value (US$ Million) Forecast by Region, 2018 to 2033

Table 2: Global Market Volume (MT) Forecast by Region, 2018 to 2033

Table 3: Global Market Value (US$ Million) Forecast by Membrane Material, 2018 to 2033

Table 4: Global Market Volume (MT) Forecast by Membrane Material, 2018 to 2033

Table 5: Global Market Value (US$ Million) Forecast by Module Design, 2018 to 2033

Table 6: Global Market Volume (MT) Forecast by Module Design, 2018 to 2033

Table 7: Global Market Value (US$ Million) Forecast by Product, 2018 to 2033

Table 8: Global Market Volume (MT) Forecast by Product, 2018 to 2033

Table 9: Global Market Value (US$ Million) Forecast by Application, 2018 to 2033

Table 10: Global Market Volume (MT) Forecast by Application, 2018 to 2033

Table 11: North America Market Value (US$ Million) Forecast by Country, 2018 to 2033

Table 12: North America Market Volume (MT) Forecast by Country, 2018 to 2033

Table 13: North America Market Value (US$ Million) Forecast by Membrane Material, 2018 to 2033

Table 14: North America Market Volume (MT) Forecast by Membrane Material, 2018 to 2033

Table 15: North America Market Value (US$ Million) Forecast by Module Design, 2018 to 2033

Table 16: North America Market Volume (MT) Forecast by Module Design, 2018 to 2033

Table 17: North America Market Value (US$ Million) Forecast by Product, 2018 to 2033

Table 18: North America Market Volume (MT) Forecast by Product, 2018 to 2033

Table 19: North America Market Value (US$ Million) Forecast by Application, 2018 to 2033

Table 20: North America Market Volume (MT) Forecast by Application, 2018 to 2033

Table 21: Latin America Market Value (US$ Million) Forecast by Country, 2018 to 2033

Table 22: Latin America Market Volume (MT) Forecast by Country, 2018 to 2033

Table 23: Latin America Market Value (US$ Million) Forecast by Membrane Material, 2018 to 2033

Table 24: Latin America Market Volume (MT) Forecast by Membrane Material, 2018 to 2033

Table 25: Latin America Market Value (US$ Million) Forecast by Module Design, 2018 to 2033

Table 26: Latin America Market Volume (MT) Forecast by Module Design, 2018 to 2033

Table 27: Latin America Market Value (US$ Million) Forecast by Product, 2018 to 2033

Table 28: Latin America Market Volume (MT) Forecast by Product, 2018 to 2033

Table 29: Latin America Market Value (US$ Million) Forecast by Application, 2018 to 2033

Table 30: Latin America Market Volume (MT) Forecast by Application, 2018 to 2033

Table 31: Europe Market Value (US$ Million) Forecast by Country, 2018 to 2033

Table 32: Europe Market Volume (MT) Forecast by Country, 2018 to 2033

Table 33: Europe Market Value (US$ Million) Forecast by Membrane Material, 2018 to 2033

Table 34: Europe Market Volume (MT) Forecast by Membrane Material, 2018 to 2033

Table 35: Europe Market Value (US$ Million) Forecast by Module Design, 2018 to 2033

Table 36: Europe Market Volume (MT) Forecast by Module Design, 2018 to 2033

Table 37: Europe Market Value (US$ Million) Forecast by Product, 2018 to 2033

Table 38: Europe Market Volume (MT) Forecast by Product, 2018 to 2033

Table 39: Europe Market Value (US$ Million) Forecast by Application, 2018 to 2033

Table 40: Europe Market Volume (MT) Forecast by Application, 2018 to 2033

Table 41: East Asia Market Value (US$ Million) Forecast by Country, 2018 to 2033

Table 42: East Asia Market Volume (MT) Forecast by Country, 2018 to 2033

Table 43: East Asia Market Value (US$ Million) Forecast by Membrane Material, 2018 to 2033

Table 44: East Asia Market Volume (MT) Forecast by Membrane Material, 2018 to 2033

Table 45: East Asia Market Value (US$ Million) Forecast by Module Design, 2018 to 2033

Table 46: East Asia Market Volume (MT) Forecast by Module Design, 2018 to 2033

Table 47: East Asia Market Value (US$ Million) Forecast by Product, 2018 to 2033

Table 48: East Asia Market Volume (MT) Forecast by Product, 2018 to 2033

Table 49: East Asia Market Value (US$ Million) Forecast by Application, 2018 to 2033

Table 50: East Asia Market Volume (MT) Forecast by Application, 2018 to 2033

Table 51: South Asia Market Value (US$ Million) Forecast by Country, 2018 to 2033

Table 52: South Asia Market Volume (MT) Forecast by Country, 2018 to 2033

Table 53: South Asia Market Value (US$ Million) Forecast by Membrane Material, 2018 to 2033

Table 54: South Asia Market Volume (MT) Forecast by Membrane Material, 2018 to 2033

Table 55: South Asia Market Value (US$ Million) Forecast by Module Design, 2018 to 2033

Table 56: South Asia Market Volume (MT) Forecast by Module Design, 2018 to 2033

Table 57: South Asia Market Value (US$ Million) Forecast by Product, 2018 to 2033

Table 58: South Asia Market Volume (MT) Forecast by Product, 2018 to 2033

Table 59: South Asia Market Value (US$ Million) Forecast by Application, 2018 to 2033

Table 60: South Asia Market Volume (MT) Forecast by Application, 2018 to 2033

Table 61: Oceania Market Value (US$ Million) Forecast by Country, 2018 to 2033

Table 62: Oceania Market Volume (MT) Forecast by Country, 2018 to 2033

Table 63: Oceania Market Value (US$ Million) Forecast by Membrane Material, 2018 to 2033

Table 64: Oceania Market Volume (MT) Forecast by Membrane Material, 2018 to 2033

Table 65: Oceania Market Value (US$ Million) Forecast by Module Design, 2018 to 2033

Table 66: Oceania Market Volume (MT) Forecast by Module Design, 2018 to 2033

Table 67: Oceania Market Value (US$ Million) Forecast by Product, 2018 to 2033

Table 68: Oceania Market Volume (MT) Forecast by Product, 2018 to 2033

Table 69: Oceania Market Value (US$ Million) Forecast by Application, 2018 to 2033

Table 70: Oceania Market Volume (MT) Forecast by Application, 2018 to 2033

Table 71: MEA Market Value (US$ Million) Forecast by Country, 2018 to 2033

Table 72: MEA Market Volume (MT) Forecast by Country, 2018 to 2033

Table 73: MEA Market Value (US$ Million) Forecast by Membrane Material, 2018 to 2033

Table 74: MEA Market Volume (MT) Forecast by Membrane Material, 2018 to 2033

Table 75: MEA Market Value (US$ Million) Forecast by Module Design, 2018 to 2033

Table 76: MEA Market Volume (MT) Forecast by Module Design, 2018 to 2033

Table 77: MEA Market Value (US$ Million) Forecast by Product, 2018 to 2033

Table 78: MEA Market Volume (MT) Forecast by Product, 2018 to 2033

Table 79: MEA Market Value (US$ Million) Forecast by Application, 2018 to 2033

Table 80: MEA Market Volume (MT) Forecast by Application, 2018 to 2033

List of Figures

Figure 1: Global Market Value (US$ Million) by Membrane Material, 2023 to 2033

Figure 2: Global Market Value (US$ Million) by Module Design, 2023 to 2033

Figure 3: Global Market Value (US$ Million) by Product, 2023 to 2033

Figure 4: Global Market Value (US$ Million) by Application, 2023 to 2033

Figure 5: Global Market Value (US$ Million) by Region, 2023 to 2033

Figure 6: Global Market Value (US$ Million) Analysis by Region, 2018 to 2033

Figure 7: Global Market Volume (MT) Analysis by Region, 2018 to 2033

Figure 8: Global Market Value Share (%) and BPS Analysis by Region, 2023 to 2033

Figure 9: Global Market Y-o-Y Growth (%) Projections by Region, 2023 to 2033

Figure 10: Global Market Value (US$ Million) Analysis by Membrane Material, 2018 to 2033

Figure 11: Global Market Volume (MT) Analysis by Membrane Material, 2018 to 2033

Figure 12: Global Market Value Share (%) and BPS Analysis by Membrane Material, 2023 to 2033

Figure 13: Global Market Y-o-Y Growth (%) Projections by Membrane Material, 2023 to 2033

Figure 14: Global Market Value (US$ Million) Analysis by Module Design, 2018 to 2033

Figure 15: Global Market Volume (MT) Analysis by Module Design, 2018 to 2033

Figure 16: Global Market Value Share (%) and BPS Analysis by Module Design, 2023 to 2033

Figure 17: Global Market Y-o-Y Growth (%) Projections by Module Design, 2023 to 2033

Figure 18: Global Market Value (US$ Million) Analysis by Product, 2018 to 2033

Figure 19: Global Market Volume (MT) Analysis by Product, 2018 to 2033

Figure 20: Global Market Value Share (%) and BPS Analysis by Product, 2023 to 2033

Figure 21: Global Market Y-o-Y Growth (%) Projections by Product, 2023 to 2033

Figure 22: Global Market Value (US$ Million) Analysis by Application, 2018 to 2033

Figure 23: Global Market Volume (MT) Analysis by Application, 2018 to 2033

Figure 24: Global Market Value Share (%) and BPS Analysis by Application, 2023 to 2033

Figure 25: Global Market Y-o-Y Growth (%) Projections by Application, 2023 to 2033

Figure 26: Global Market Attractiveness by Membrane Material, 2023 to 2033

Figure 27: Global Market Attractiveness by Module Design, 2023 to 2033

Figure 28: Global Market Attractiveness by Product, 2023 to 2033

Figure 29: Global Market Attractiveness by Application, 2023 to 2033

Figure 30: Global Market Attractiveness by Region, 2023 to 2033

Figure 31: North America Market Value (US$ Million) by Membrane Material, 2023 to 2033

Figure 32: North America Market Value (US$ Million) by Module Design, 2023 to 2033

Figure 33: North America Market Value (US$ Million) by Product, 2023 to 2033

Figure 34: North America Market Value (US$ Million) by Application, 2023 to 2033

Figure 35: North America Market Value (US$ Million) by Country, 2023 to 2033

Figure 36: North America Market Value (US$ Million) Analysis by Country, 2018 to 2033

Figure 37: North America Market Volume (MT) Analysis by Country, 2018 to 2033

Figure 38: North America Market Value Share (%) and BPS Analysis by Country, 2023 to 2033

Figure 39: North America Market Y-o-Y Growth (%) Projections by Country, 2023 to 2033

Figure 40: North America Market Value (US$ Million) Analysis by Membrane Material, 2018 to 2033

Figure 41: North America Market Volume (MT) Analysis by Membrane Material, 2018 to 2033

Figure 42: North America Market Value Share (%) and BPS Analysis by Membrane Material, 2023 to 2033

Figure 43: North America Market Y-o-Y Growth (%) Projections by Membrane Material, 2023 to 2033

Figure 44: North America Market Value (US$ Million) Analysis by Module Design, 2018 to 2033

Figure 45: North America Market Volume (MT) Analysis by Module Design, 2018 to 2033

Figure 46: North America Market Value Share (%) and BPS Analysis by Module Design, 2023 to 2033

Figure 47: North America Market Y-o-Y Growth (%) Projections by Module Design, 2023 to 2033

Figure 48: North America Market Value (US$ Million) Analysis by Product, 2018 to 2033

Figure 49: North America Market Volume (MT) Analysis by Product, 2018 to 2033

Figure 50: North America Market Value Share (%) and BPS Analysis by Product, 2023 to 2033

Figure 51: North America Market Y-o-Y Growth (%) Projections by Product, 2023 to 2033

Figure 52: North America Market Value (US$ Million) Analysis by Application, 2018 to 2033

Figure 53: North America Market Volume (MT) Analysis by Application, 2018 to 2033

Figure 54: North America Market Value Share (%) and BPS Analysis by Application, 2023 to 2033

Figure 55: North America Market Y-o-Y Growth (%) Projections by Application, 2023 to 2033

Figure 56: North America Market Attractiveness by Membrane Material, 2023 to 2033

Figure 57: North America Market Attractiveness by Module Design, 2023 to 2033

Figure 58: North America Market Attractiveness by Product, 2023 to 2033

Figure 59: North America Market Attractiveness by Application, 2023 to 2033

Figure 60: North America Market Attractiveness by Country, 2023 to 2033

Figure 61: Latin America Market Value (US$ Million) by Membrane Material, 2023 to 2033

Figure 62: Latin America Market Value (US$ Million) by Module Design, 2023 to 2033

Figure 63: Latin America Market Value (US$ Million) by Product, 2023 to 2033

Figure 64: Latin America Market Value (US$ Million) by Application, 2023 to 2033

Figure 65: Latin America Market Value (US$ Million) by Country, 2023 to 2033

Figure 66: Latin America Market Value (US$ Million) Analysis by Country, 2018 to 2033

Figure 67: Latin America Market Volume (MT) Analysis by Country, 2018 to 2033

Figure 68: Latin America Market Value Share (%) and BPS Analysis by Country, 2023 to 2033

Figure 69: Latin America Market Y-o-Y Growth (%) Projections by Country, 2023 to 2033

Figure 70: Latin America Market Value (US$ Million) Analysis by Membrane Material, 2018 to 2033

Figure 71: Latin America Market Volume (MT) Analysis by Membrane Material, 2018 to 2033

Figure 72: Latin America Market Value Share (%) and BPS Analysis by Membrane Material, 2023 to 2033

Figure 73: Latin America Market Y-o-Y Growth (%) Projections by Membrane Material, 2023 to 2033

Figure 74: Latin America Market Value (US$ Million) Analysis by Module Design, 2018 to 2033

Figure 75: Latin America Market Volume (MT) Analysis by Module Design, 2018 to 2033

Figure 76: Latin America Market Value Share (%) and BPS Analysis by Module Design, 2023 to 2033

Figure 77: Latin America Market Y-o-Y Growth (%) Projections by Module Design, 2023 to 2033

Figure 78: Latin America Market Value (US$ Million) Analysis by Product, 2018 to 2033

Figure 79: Latin America Market Volume (MT) Analysis by Product, 2018 to 2033

Figure 80: Latin America Market Value Share (%) and BPS Analysis by Product, 2023 to 2033

Figure 81: Latin America Market Y-o-Y Growth (%) Projections by Product, 2023 to 2033

Figure 82: Latin America Market Value (US$ Million) Analysis by Application, 2018 to 2033

Figure 83: Latin America Market Volume (MT) Analysis by Application, 2018 to 2033

Figure 84: Latin America Market Value Share (%) and BPS Analysis by Application, 2023 to 2033

Figure 85: Latin America Market Y-o-Y Growth (%) Projections by Application, 2023 to 2033

Figure 86: Latin America Market Attractiveness by Membrane Material, 2023 to 2033

Figure 87: Latin America Market Attractiveness by Module Design, 2023 to 2033

Figure 88: Latin America Market Attractiveness by Product, 2023 to 2033

Figure 89: Latin America Market Attractiveness by Application, 2023 to 2033

Figure 90: Latin America Market Attractiveness by Country, 2023 to 2033

Figure 91: Europe Market Value (US$ Million) by Membrane Material, 2023 to 2033

Figure 92: Europe Market Value (US$ Million) by Module Design, 2023 to 2033

Figure 93: Europe Market Value (US$ Million) by Product, 2023 to 2033

Figure 94: Europe Market Value (US$ Million) by Application, 2023 to 2033

Figure 95: Europe Market Value (US$ Million) by Country, 2023 to 2033

Figure 96: Europe Market Value (US$ Million) Analysis by Country, 2018 to 2033

Figure 97: Europe Market Volume (MT) Analysis by Country, 2018 to 2033

Figure 98: Europe Market Value Share (%) and BPS Analysis by Country, 2023 to 2033

Figure 99: Europe Market Y-o-Y Growth (%) Projections by Country, 2023 to 2033

Figure 100: Europe Market Value (US$ Million) Analysis by Membrane Material, 2018 to 2033

Figure 101: Europe Market Volume (MT) Analysis by Membrane Material, 2018 to 2033

Figure 102: Europe Market Value Share (%) and BPS Analysis by Membrane Material, 2023 to 2033

Figure 103: Europe Market Y-o-Y Growth (%) Projections by Membrane Material, 2023 to 2033

Figure 104: Europe Market Value (US$ Million) Analysis by Module Design, 2018 to 2033

Figure 105: Europe Market Volume (MT) Analysis by Module Design, 2018 to 2033

Figure 106: Europe Market Value Share (%) and BPS Analysis by Module Design, 2023 to 2033

Figure 107: Europe Market Y-o-Y Growth (%) Projections by Module Design, 2023 to 2033

Figure 108: Europe Market Value (US$ Million) Analysis by Product, 2018 to 2033

Figure 109: Europe Market Volume (MT) Analysis by Product, 2018 to 2033

Figure 110: Europe Market Value Share (%) and BPS Analysis by Product, 2023 to 2033

Figure 111: Europe Market Y-o-Y Growth (%) Projections by Product, 2023 to 2033

Figure 112: Europe Market Value (US$ Million) Analysis by Application, 2018 to 2033

Figure 113: Europe Market Volume (MT) Analysis by Application, 2018 to 2033

Figure 114: Europe Market Value Share (%) and BPS Analysis by Application, 2023 to 2033

Figure 115: Europe Market Y-o-Y Growth (%) Projections by Application, 2023 to 2033

Figure 116: Europe Market Attractiveness by Membrane Material, 2023 to 2033

Figure 117: Europe Market Attractiveness by Module Design, 2023 to 2033

Figure 118: Europe Market Attractiveness by Product, 2023 to 2033

Figure 119: Europe Market Attractiveness by Application, 2023 to 2033

Figure 120: Europe Market Attractiveness by Country, 2023 to 2033

Figure 121: East Asia Market Value (US$ Million) by Membrane Material, 2023 to 2033

Figure 122: East Asia Market Value (US$ Million) by Module Design, 2023 to 2033

Figure 123: East Asia Market Value (US$ Million) by Product, 2023 to 2033

Figure 124: East Asia Market Value (US$ Million) by Application, 2023 to 2033

Figure 125: East Asia Market Value (US$ Million) by Country, 2023 to 2033

Figure 126: East Asia Market Value (US$ Million) Analysis by Country, 2018 to 2033

Figure 127: East Asia Market Volume (MT) Analysis by Country, 2018 to 2033

Figure 128: East Asia Market Value Share (%) and BPS Analysis by Country, 2023 to 2033

Figure 129: East Asia Market Y-o-Y Growth (%) Projections by Country, 2023 to 2033

Figure 130: East Asia Market Value (US$ Million) Analysis by Membrane Material, 2018 to 2033

Figure 131: East Asia Market Volume (MT) Analysis by Membrane Material, 2018 to 2033

Figure 132: East Asia Market Value Share (%) and BPS Analysis by Membrane Material, 2023 to 2033

Figure 133: East Asia Market Y-o-Y Growth (%) Projections by Membrane Material, 2023 to 2033

Figure 134: East Asia Market Value (US$ Million) Analysis by Module Design, 2018 to 2033

Figure 135: East Asia Market Volume (MT) Analysis by Module Design, 2018 to 2033

Figure 136: East Asia Market Value Share (%) and BPS Analysis by Module Design, 2023 to 2033

Figure 137: East Asia Market Y-o-Y Growth (%) Projections by Module Design, 2023 to 2033

Figure 138: East Asia Market Value (US$ Million) Analysis by Product, 2018 to 2033

Figure 139: East Asia Market Volume (MT) Analysis by Product, 2018 to 2033

Figure 140: East Asia Market Value Share (%) and BPS Analysis by Product, 2023 to 2033

Figure 141: East Asia Market Y-o-Y Growth (%) Projections by Product, 2023 to 2033

Figure 142: East Asia Market Value (US$ Million) Analysis by Application, 2018 to 2033

Figure 143: East Asia Market Volume (MT) Analysis by Application, 2018 to 2033

Figure 144: East Asia Market Value Share (%) and BPS Analysis by Application, 2023 to 2033

Figure 145: East Asia Market Y-o-Y Growth (%) Projections by Application, 2023 to 2033

Figure 146: East Asia Market Attractiveness by Membrane Material, 2023 to 2033

Figure 147: East Asia Market Attractiveness by Module Design, 2023 to 2033

Figure 148: East Asia Market Attractiveness by Product, 2023 to 2033

Figure 149: East Asia Market Attractiveness by Application, 2023 to 2033

Figure 150: East Asia Market Attractiveness by Country, 2023 to 2033

Figure 151: South Asia Market Value (US$ Million) by Membrane Material, 2023 to 2033

Figure 152: South Asia Market Value (US$ Million) by Module Design, 2023 to 2033

Figure 153: South Asia Market Value (US$ Million) by Product, 2023 to 2033

Figure 154: South Asia Market Value (US$ Million) by Application, 2023 to 2033

Figure 155: South Asia Market Value (US$ Million) by Country, 2023 to 2033

Figure 156: South Asia Market Value (US$ Million) Analysis by Country, 2018 to 2033

Figure 157: South Asia Market Volume (MT) Analysis by Country, 2018 to 2033

Figure 158: South Asia Market Value Share (%) and BPS Analysis by Country, 2023 to 2033

Figure 159: South Asia Market Y-o-Y Growth (%) Projections by Country, 2023 to 2033

Figure 160: South Asia Market Value (US$ Million) Analysis by Membrane Material, 2018 to 2033

Figure 161: South Asia Market Volume (MT) Analysis by Membrane Material, 2018 to 2033

Figure 162: South Asia Market Value Share (%) and BPS Analysis by Membrane Material, 2023 to 2033

Figure 163: South Asia Market Y-o-Y Growth (%) Projections by Membrane Material, 2023 to 2033

Figure 164: South Asia Market Value (US$ Million) Analysis by Module Design, 2018 to 2033

Figure 165: South Asia Market Volume (MT) Analysis by Module Design, 2018 to 2033

Figure 166: South Asia Market Value Share (%) and BPS Analysis by Module Design, 2023 to 2033

Figure 167: South Asia Market Y-o-Y Growth (%) Projections by Module Design, 2023 to 2033

Figure 168: South Asia Market Value (US$ Million) Analysis by Product, 2018 to 2033

Figure 169: South Asia Market Volume (MT) Analysis by Product, 2018 to 2033

Figure 170: South Asia Market Value Share (%) and BPS Analysis by Product, 2023 to 2033

Figure 171: South Asia Market Y-o-Y Growth (%) Projections by Product, 2023 to 2033

Figure 172: South Asia Market Value (US$ Million) Analysis by Application, 2018 to 2033

Figure 173: South Asia Market Volume (MT) Analysis by Application, 2018 to 2033

Figure 174: South Asia Market Value Share (%) and BPS Analysis by Application, 2023 to 2033

Figure 175: South Asia Market Y-o-Y Growth (%) Projections by Application, 2023 to 2033

Figure 176: South Asia Market Attractiveness by Membrane Material, 2023 to 2033

Figure 177: South Asia Market Attractiveness by Module Design, 2023 to 2033

Figure 178: South Asia Market Attractiveness by Product, 2023 to 2033

Figure 179: South Asia Market Attractiveness by Application, 2023 to 2033

Figure 180: South Asia Market Attractiveness by Country, 2023 to 2033

Figure 181: Oceania Market Value (US$ Million) by Membrane Material, 2023 to 2033

Figure 182: Oceania Market Value (US$ Million) by Module Design, 2023 to 2033

Figure 183: Oceania Market Value (US$ Million) by Product, 2023 to 2033

Figure 184: Oceania Market Value (US$ Million) by Application, 2023 to 2033

Figure 185: Oceania Market Value (US$ Million) by Country, 2023 to 2033

Figure 186: Oceania Market Value (US$ Million) Analysis by Country, 2018 to 2033

Figure 187: Oceania Market Volume (MT) Analysis by Country, 2018 to 2033

Figure 188: Oceania Market Value Share (%) and BPS Analysis by Country, 2023 to 2033

Figure 189: Oceania Market Y-o-Y Growth (%) Projections by Country, 2023 to 2033

Figure 190: Oceania Market Value (US$ Million) Analysis by Membrane Material, 2018 to 2033

Figure 191: Oceania Market Volume (MT) Analysis by Membrane Material, 2018 to 2033

Figure 192: Oceania Market Value Share (%) and BPS Analysis by Membrane Material, 2023 to 2033

Figure 193: Oceania Market Y-o-Y Growth (%) Projections by Membrane Material, 2023 to 2033

Figure 194: Oceania Market Value (US$ Million) Analysis by Module Design, 2018 to 2033

Figure 195: Oceania Market Volume (MT) Analysis by Module Design, 2018 to 2033

Figure 196: Oceania Market Value Share (%) and BPS Analysis by Module Design, 2023 to 2033

Figure 197: Oceania Market Y-o-Y Growth (%) Projections by Module Design, 2023 to 2033

Figure 198: Oceania Market Value (US$ Million) Analysis by Product, 2018 to 2033

Figure 199: Oceania Market Volume (MT) Analysis by Product, 2018 to 2033

Figure 200: Oceania Market Value Share (%) and BPS Analysis by Product, 2023 to 2033

Figure 201: Oceania Market Y-o-Y Growth (%) Projections by Product, 2023 to 2033

Figure 202: Oceania Market Value (US$ Million) Analysis by Application, 2018 to 2033

Figure 203: Oceania Market Volume (MT) Analysis by Application, 2018 to 2033

Figure 204: Oceania Market Value Share (%) and BPS Analysis by Application, 2023 to 2033

Figure 205: Oceania Market Y-o-Y Growth (%) Projections by Application, 2023 to 2033

Figure 206: Oceania Market Attractiveness by Membrane Material, 2023 to 2033

Figure 207: Oceania Market Attractiveness by Module Design, 2023 to 2033

Figure 208: Oceania Market Attractiveness by Product, 2023 to 2033

Figure 209: Oceania Market Attractiveness by Application, 2023 to 2033

Figure 210: Oceania Market Attractiveness by Country, 2023 to 2033

Figure 211: MEA Market Value (US$ Million) by Membrane Material, 2023 to 2033

Figure 212: MEA Market Value (US$ Million) by Module Design, 2023 to 2033

Figure 213: MEA Market Value (US$ Million) by Product, 2023 to 2033

Figure 214: MEA Market Value (US$ Million) by Application, 2023 to 2033

Figure 215: MEA Market Value (US$ Million) by Country, 2023 to 2033

Figure 216: MEA Market Value (US$ Million) Analysis by Country, 2018 to 2033

Figure 217: MEA Market Volume (MT) Analysis by Country, 2018 to 2033

Figure 218: MEA Market Value Share (%) and BPS Analysis by Country, 2023 to 2033

Figure 219: MEA Market Y-o-Y Growth (%) Projections by Country, 2023 to 2033

Figure 220: MEA Market Value (US$ Million) Analysis by Membrane Material, 2018 to 2033

Figure 221: MEA Market Volume (MT) Analysis by Membrane Material, 2018 to 2033

Figure 222: MEA Market Value Share (%) and BPS Analysis by Membrane Material, 2023 to 2033

Figure 223: MEA Market Y-o-Y Growth (%) Projections by Membrane Material, 2023 to 2033

Figure 224: MEA Market Value (US$ Million) Analysis by Module Design, 2018 to 2033

Figure 225: MEA Market Volume (MT) Analysis by Module Design, 2018 to 2033

Figure 226: MEA Market Value Share (%) and BPS Analysis by Module Design, 2023 to 2033

Figure 227: MEA Market Y-o-Y Growth (%) Projections by Module Design, 2023 to 2033

Figure 228: MEA Market Value (US$ Million) Analysis by Product, 2018 to 2033

Figure 229: MEA Market Volume (MT) Analysis by Product, 2018 to 2033

Figure 230: MEA Market Value Share (%) and BPS Analysis by Product, 2023 to 2033

Figure 231: MEA Market Y-o-Y Growth (%) Projections by Product, 2023 to 2033

Figure 232: MEA Market Value (US$ Million) Analysis by Application, 2018 to 2033

Figure 233: MEA Market Volume (MT) Analysis by Application, 2018 to 2033

Figure 234: MEA Market Value Share (%) and BPS Analysis by Application, 2023 to 2033

Figure 235: MEA Market Y-o-Y Growth (%) Projections by Application, 2023 to 2033

Figure 236: MEA Market Attractiveness by Membrane Material, 2023 to 2033

Figure 237: MEA Market Attractiveness by Module Design, 2023 to 2033

Figure 238: MEA Market Attractiveness by Product, 2023 to 2033

Figure 239: MEA Market Attractiveness by Application, 2023 to 2033

Figure 240: MEA Market Attractiveness by Country, 2023 to 2033

Frequently Asked Questions

How big is the dairy filtration systems market?

The global dairy filtration systems market is expected to be valued at USD 2,231 Million in 2023.

At what rate will the global dairy filtration systems market grow during the forecast period?

The worldwide dairy filtration systems market is expected to grow at a CAGR of 4.8% during the projection period.

What is the projected valuation for dairy filtration systems market?

As per FMI, the global dairy filtration systems market is expected to surpass a valuation of USD 3,565 Million by 2033.

What is the North America dairy filtration systems market outlook?

The North American dairy filtration systems market is expected to register a CAGR of 5.63% between 2023 and 2033.

Which are the major countries driving demand for dairy filtration systems?

The US, India, China, Germany, Mexico, and the UK are the major countries driving demand for dairy filtration systems.

At what rate will the China dairy filtration systems market grow?

China’s dairy filtration systems market is projected to grow at a CAGR of around 6.72% over the next ten years.

What is the growth projection for German dairy filtration systems market?

The German dairy filtration systems market is projected to grow at a CAGR of around 4.97% during the forecast period.

At what rate will dairy filtration systems market grow in Europe?

Demand for dairy filtration systems in Europe is expected to grow at 5.87% CAGR between 2022 and 2032.

Who are the top 5 players operating in dairy filtration systems market?

Suez Water Technologies and Solutions (US), GEA Group AG (Germany), DowDuPont (US), Alfa Laval AB (Sweden), and Pall Corporation (US) Bizerba are the top 5 players in the dairy filtration systems market.

At what rate will the Mexico dairy filtration systems market grow?

Mexico’s dairy filtration systems market is projected to grow at a CAGR of around 6.32% over the next ten years.

Explore Similar Insights

Future Market Insights

Dairy Filtration Systems Market