Dairy Ingredients Market Size, Share, and Forecast Outlook 2025 to 2035

The global dairy ingredients market is forecasted to grow from USD 74.1 billion in 2025 to USD 132.9 billion by 2035, reflecting a CAGR of 6.0%. Expansion is being driven by three converging forces: accelerated protein fortification in mainstream food categories, reformulation momentum across clinical and infant nutrition, and strategic repositioning of dairy byproducts into value-added systems.
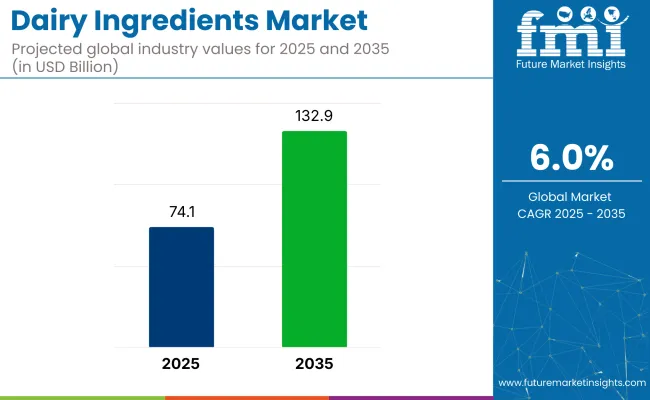
Quick Stats for Dairy Ingredients Market

  • Market Size (2025): USD 74.1 billion
  • Market Size (2035): USD 132.9 billion
  • CAGR (2025 to 2035): 6.0%
  • Leading Segment (2025): Milk Powder (28% share)
  • Top Regions: North America, Europe, Asia-Pacific
  • Key Players: Lactalis Group, Arla Foods, FrieslandCampina, Fonterra, Glanbia Plc, GCMMF, Nestlé S.A.

Dairy Ingredients Market

Attributes Description
Estimated Global Industry Size (2025E) USD 74.1 billion
Projected Global Industry Value (2035F) USD 132.9 billion
Value-based CAGR (2025 to 2035) 6.0%

Milk proteins, caseinates, and whey fractions are now being redeployed not only as functional inputs but also as delivery vehicles for micronutrients and bioactive compounds in RTE and RTD segments.

Global processors are investing in precision filtration, low-thermal drying, and enzymatic hydrolysis to enable higher purity profiles and application-specific grades. Lactose derivatives are being integrated into pediatric formulations, while MPC and WPC are seeing uptake in sports-recovery and geriatric formulations.

In Asia, reformulated dairy blends are penetrating price-sensitive fortified food categories, while North American brands are layering dairy ingredients into hybrid formats for performance nutrition. Commoditized dairy components are being reoriented to offset volatility in fluid milk sales.

The result is a dual-track dynamic-mass-market dairy powders scaling in foodservice and bakery, and high-margin isolates anchoring growth in clinical and wellness verticals. This bifurcation is expected to define future trade flows and product innovation pipelines.

The dairy ingredients industry holds a significant share in the broader dairy products and food & beverage ingredients industry, reflecting the increasing demand for value-added dairy components in various formulations. Within the dairy product industry, the dairy ingredients segment accounts for approximately 30%, driven by rising demand for milk powder, whey proteins, and casein.

In the food & beverage ingredients industry, its share is around 18%, as dairy ingredients are essential in processing items like baked goods and snacks. Dairy ingredients also play a substantial role in the nutritional supplements and functional foods sectors, contributing roughly 12% and 14%, respectively. Its role in the animal feed industry stands at an estimated 8%.

In March 2025, Arla Foods Ingredients entered a contract manufacturing agreement with South Dakota-based Valley Queen to produce Nutrilac® ProteinBoost, a patented microparticulate whey protein concentrate. The partnership enhances Arla’s capacity to meet growing USA demand for protein-enriched dairy while supporting its North American expansion strategy.

Production is scheduled to begin in winter 2025/2026 at Valley Queen’s Milbank facility following the installation of new specialty equipment. Luis Cubel, Group Vice President and Managing Director at Arla Foods Ingredients, stated that Valley Queen was selected for its shared values and longstanding commitment to quality in dairy and whey production.

Analyzing Dairy Ingredients Market by Top Investment Segments

The dairy ingredients market has been segmented by product type into proteins, milk powder, milk fat concentrates, casein and caseinates, lactose and its derivatives, whey, and other types. It has been segmented by form type into powder and liquid. It has been segmented by application into bakery and confectionery, dairy products, sports and clinical nutrition, infant formulas including standard infant formula and specialty infant formula, cosmetics, pharmaceuticals, and other applications.

It has been segmented by distribution channel into e-commerce, specialty retailers, supermarket and hypermarket, food service sector, and other distribution channels. It has been segmented by region into North America, Western Europe, Eastern Europe, Russia and Belarus, Balkan and Baltic Countries, Latin America, Central Asia, East Asia, Middle East and Africa, and South Asia and Pacific.

Milk Powder Leads Ingredient Preferences in 2025

Milk powder is forecast to hold 28% of product-type share in 2025. Solubility, long shelf life, and protein consistency have made it a preferred base for processors across infant nutrition, dairy beverages, and bakery sectors. Friesland Campina, Vinamilk, and Hochwald Foods have scaled powder output by modifying spray-drying lines and integrating flexible packaging formats. Blends have been tailored for varied fat contents and regional fortification standards. Regulatory documentation has been standardised for smooth inter-regional movement, and usage has been reinforced in both low-moisture shelf-stable and high-fat dairy preparations.
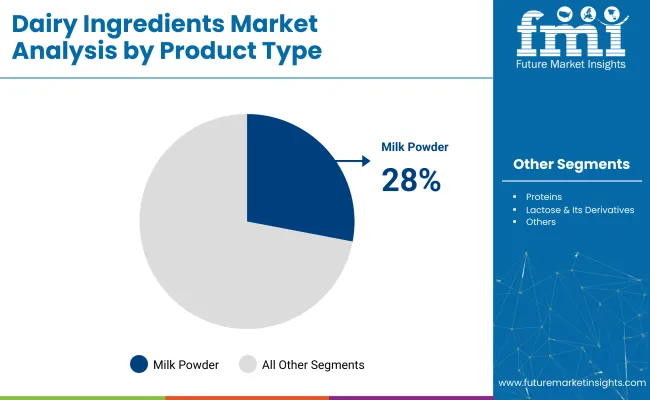
  • Vinamilk milk powders have been introduced in fortified school milk across Southeast Asia.
  • FrieslandCampina variants have been adopted in reconstituted dairy beverages.

Dairy Ingredients Market Analysis By Product Type

Powder Format Dominates Form-Based Supply Chains

Powdered dairy ingredients are estimated to capture 78% of form-type share in 2025. Transport efficiency, ambient storage, and low spoilage risk have made powder formats ideal for global sourcing. Lactalis Ingredients, Fonterra, and Amul have increased output by streamlining agglomeration and fluid-bed drying operations to deliver improved rehydration performance. Cross-continental shipments have benefited from barrier-laminate packaging that ensures moisture resistance. Procurement from industrial bakeries and beverage facilities has shifted toward powders for precise batch dosing and extended stability.
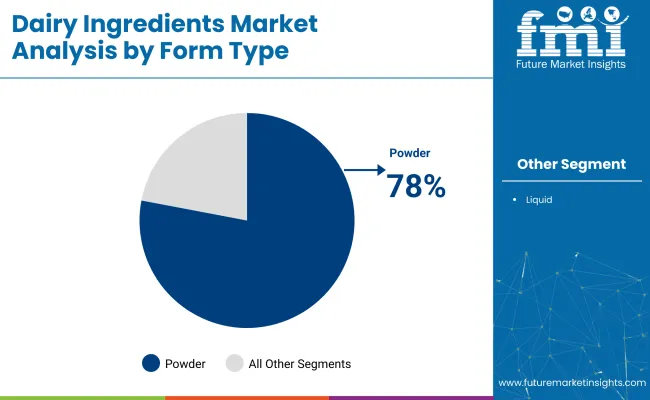
  • Lactalis powders have been used in cheese analogues and shelf-stable milk drinks.
  • Fonterra has supplied powders for bulk reconstitution in Africa and the Middle East.

Dairy Ingredients Market Analysis By Form Type

Dairy Products Account for Bulk Ingredient Application

Dairy products are expected to absorb 38% of ingredient applications in 2025. Yogurt, processed cheese, and ice cream lines have incorporated dairy ingredients to enhance texture, flavor, and shelf life. Danone, Meiji Holdings, and Savencia have deployed tailored ingredients to align with regional taste preferences and fat profile requirements. Heat-stable proteins and functional lactose blends have been introduced in ambient desserts and drinking yogurts. Ingredient traceability protocols have been emphasized, and compatibility with plant-fat systems has increased usage in hybrid product categories.

  • Danone has used functional proteins in spoonable yogurts across Europe.
  • Meiji has employed whey concentrates in frozen dairy desserts in Japan.

Foodservice Sector Drives Ingredient Procurement in 2025

The foodservice segment is projected to command 20% of distribution share in 2025. Pre-measured powders, cream bases, and dairy concentrates have been adopted to simplify prep and extend shelf life in commercial kitchens. Bidfood (UK), Gruppo VéGé (Italy), and FreshMenu (India) have established sourcing partnerships for high-utility dairy inputs that replace cream, butter, and milk in sauces, soups, and baked goods. Batch consistency, low-waste packaging, and ambient transport have been emphasized to optimize operational efficiency across outlets.

  • Bidfood has secured powdered dairy contracts for institutional kitchens.
  • FreshMenu has adopted dairy powders for heat-and-serve dessert preparations.

Top Dairy Ingredients Market Dynamics

Inventory cycles for dairy ingredients shortened by 26% as powdered formats gained shelf efficiency. Clinical validation of whey isolates is boosting premium SKUs in sports nutrition. Margin pressure emerged from rising milk and freight costs, pushing processors toward ambient powder formats and hedging strategies to offset downstream pricing inflexibility.

Inventory Recirculation & Cold-Chain Rationalization

Retail and foodservice operators have reduced dairy ingredient inventory cycles, cutting days-on-hand from 23 to 17 in H1 2025. Powdered milk protein concentrate (MPC) now turns 1.9× faster than chilled cream bases, driving a 14% reallocation of refrigerated shelf space to high-velocity SKUs.

Shelf productivity for milk protein powders reached USD 385 per linear foot/month, surpassing chilled butterfat by 11%. Discounters cut markdowns by 12% through predictive inventory tied to institutional calendars. DTC platforms reported a 16% spike in first-time purchases when QR-traceable sachets were bundled. Producers responded by trimming buffer stocks 9-10% and shifting to dual-shift spray-drying to meet tighter replenishment cycles.

Clinical Protein Fortification Gains Evidence Support

Studies in 2024 showed hydrolyzed whey isolates restored phosphocreatine 19% faster than casein over 72 hours, validating their use in sports recovery. SKUs dosed at 2.4g leucine per 250ml now command 14% price premiums in specialty retail.

Google searches for “hydrolyzed whey recovery” rose 26% since Jan 2025. Isolate SKUs bearing clinical callouts outperform generic blends by 21% in gym vending data. Heat-stable peptides and BCAA-certified powders are expanding into ready meals, enabling functional crossover beyond beverages.

Margin Pressure from Milk-Price Volatility & Freight Shifts

From Q4 2023 to Q2 2025, skim milk powder export prices rose 9.7%, driven by lower raw milk availability and feed-linked input costs. Spot reefer container rates from Auckland to Shanghai increased 8.1% YoY, with dry freight on Europe-MENA lanes up 6.4%.

FOB whey protein costs rose 7.8%, while downstream contract prices rose just 3.2%, compressing margins by 240 basis points. Large players are hedging through SMP futures and freight caps, while mid-sized processors are shifting toward higher-fat ambient powders, saving up to 13% in shipping costs but requiring reformulation support. Hybrid pricing tied to volume tiers and index-linked clauses is now being deployed to protect profitability.
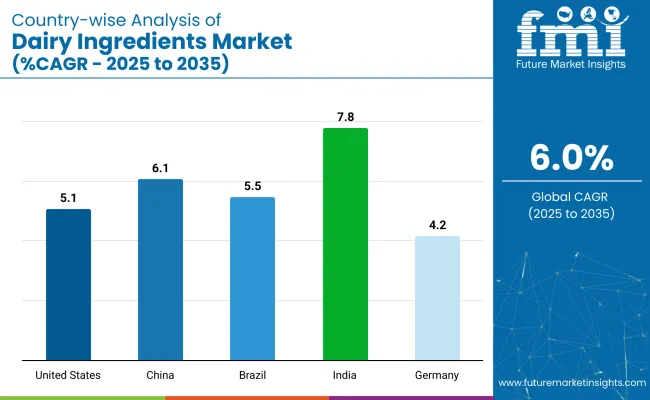
Analyzing Top Countries Producing, Distributing, and Supplying Dairy Ingredients

Dairy Ingredients Market Country Wise Analysis

Country CAGR (2025 to 2035)
India 7.8%
China 6.1%
Brazil 5.5%
United States 5.1%
Germany 4.2%

Global dairy-ingredients demand is projected to rise at a 6.0% CAGR from 2025 to 2035. Of the five profiled industries, India leads at 7.8%, followed by China at 6.1%, Brazil at 5.5%, the United States at 5.1%, and Germany at 4.2%. These rates translate to a growth premium of +30% for India and +2% for China versus the baseline, while Brazil, the United States, and Germany trail by -8%, -15%, and -30%, respectively.

Divergence has been shaped by India’s protein-fortification push in nutritional powders, China’s beverage-grade lactose enrichment, Brazil’s sports-nutrition uptake in whey concentrates, mature isolate saturation in the United States, and fat-standard reform constraints in Germany.

The report covers detailed analysis of 40+ countries and the top five countries have been shared as a reference.

Growth Outlook of Dairy Ingredients Market in the United States

Demand for dairy ingredients in the USA is expected to grow at a CAGR of 3.9% between 2025 and 2035. Ingredient demand has been shaped by steady usage in sports nutrition, cheese processing, and fortified milk beverages. Whey and milk protein isolates have been incorporated in value-added dairy and nutritional products.

Formulation demand from private-label brands has been met through standardised ingredient contracts. Ingredient traceability protocols have been strengthened to comply with USDA labeling frameworks, and protein enrichment has been pursued in both traditional and plant-forward formats.

  • Whey protein ingredients have been deployed in USA sports beverage lines.
  • Cheese processors have sourced functional dairy powders for melt control.
  • Private-label yogurt brands have adopted fortified dairy bases.

In-Depth Analysis of Dairy Ingredients Market in Germany

Sales of dairy ingredients in Germany forecast to expand at a CAGR of 4.1% from 2025 to 2035. Functional dairy ingredients have been favoured for inclusion in cheese spreads, yogurt, and bakery systems. Protein-enriched formulations have been promoted through regional clean-label programs. Ingredient contracts have been formalised through dairy co-operatives to supply consistent quality.

Blends with plant fats and milk solids have been used in hybrid spreads, while infant nutrition segments have maintained steady uptake of high-grade dairy proteins. Packaging standards for powdered concentrates have been aligned with EU bulk transit rules.

  • Cheese spread producers have sourced dairy emulsifiers under fixed-volume contracts.
  • Infant formula plants have integrated high-purity milk protein inputs.
  • Powdered dairy ingredients have met bakery texture-modification needs.

Demand Forecast for Dairy Ingredients Market in China

Demand for dairy ingredients in China is projected to rise at a CAGR of 5.3% during 2025 to 2035. Domestic demand has been driven by rising protein inclusion in reconstituted milk, beverages, and nutritional powders. Import volumes of milk powder and whey protein have been supported by national fortification initiatives.

Ingredient sourcing has been diversified through partnerships with EU and Oceania suppliers. Regulatory clearance for functional dairy imports has been expedited through trade accords. Local reprocessing units have repackaged bulk ingredients into foodservice-ready SKUs for urban distribution.

  • Reconstituted milk processors have adopted imported milk powder blends.
  • Cross-border ingredient shipments have been routed through bonded warehouses.
  • Dairy concentrates have been supplied to foodservice chains in tier-1 cities.

Expansion Forecast of Dairy Ingredients Market in Japan

Sales for dairy ingredient in Japan is expected to record a 4.8% CAGR through 2035. Ingredient applications have been anchored in functional yogurt, processed dairy desserts, and clinical nutrition. Heat-stable whey proteins and low-lactose powders have been adopted by formulators for high-performance requirements.

Domestic manufacturers have relied on imported caseinates and milk solids from Australia and the EU. Cost-per-gram targets have been met through micro-packaging of high-value concentrates for senior nutrition and hospital diets. Food-tech start-ups have also explored dairy blend infusions in protein puddings and ready-to-eat breakfast lines.

  • Caseinate imports have been integrated into dessert formulations.
  • Low-lactose powders have supported digestive-focused dairy launches.
  • Ready-to-eat nutrition lines have used micro-dosed dairy ingredients.

Dairy Ingredients Market Growth Trajectory in India

Demand for dairy ingredients in India is forecast to expand at a CAGR of 5.8% from 2025 to 2035. Demand has been driven by large-scale use in milk powder reconstitution, bakery fillings, and industrial dairy beverages. Cooperative processors have used dairy concentrates to stabilise cost structures amid regional supply volatility.

Ingredient fortification programs have been undertaken under government nutrition schemes. Plant-dairy blends have been developed to cater to lactose-sensitive consumers, while school milk and nutritional drink brands have prioritised milk solid integration.

  • Bakery plants have sourced high-heat milk powders for product stability.
  • Government schemes have used fortified milk solids in midday meal programs.
  • Lactose-free dairy blends have entered the Indian nutrition-drink segment.

Leading Dairy Ingredients Market Suppliers

Competition in the dairy ingredients industry has been shaped by aggressive expansion, acquisition, and product innovation. Industry share has been maintained by leaders such as Lactalis Group, Arla Foods, FrieslandCampina, and Fonterra through investments in whey proteins, milk powders, and functional dairy components.

Strategic acquisitions have been executed by Glanbia Plc and Kerry Group to strengthen global reach. Distribution networks have been expanded to ensure raw material security and consistent quality. Product portfolios have been diversified by Nestlé S.A. and Saputo. Regional strength has been reinforced by GCMMF (Amul), Yili Group, and Mengniu Dairy as their networks have been leveraged to supply both emerging and developed industries, positioning them competitively within a dynamic global landscape.

Recent Industry News

  • In August 2024, Fonterra entered into strategic alliances with Superbrewed Food and Nourish Ingredients to co-develop fermentation-derived proteins and dairy-like fats, targeting innovation in animal-free dairy ingredients and addressing rising market demand for ecological protein solutions.
  • In 2024, UK regulatory authorities approved for Arla Foods Ingredients to acquire Volac’s whey protein business. This strategic move allows Arla to consolidate its position in the global whey ingredients market by enhancing its capabilities in high-value dairy proteins and furthering its objective of expanding within the functional nutrition sector.

Leading Players in Dairy Ingredients Market

  • Lactalis Group
  • AMCO Proteins
  • Arla Foods
  • Cayuga Dairy Ingredients
  • Dairy Farmers of America
  • Epi Ingredients
  • Fonterra Co-operative Group
  • FrieslandCampina
  • Glanbia Plc
  • Gujarat Co-operative Milk Marketing Federation Ltd. (GCMMF)
  • Ingredia SA
  • Kerry Group
  • Megmilk Snow Brand Co. Ltd.
  • Meiji Holdings Co. Ltd.
  • China Mengniu Dairy Company Limited
  • Yili Group
  • Nestle S.A.
  • Saputo
  • Schreiber Foods Inc.
  • Sodiaal Group
  • Volac International Ltd.
  • Others

Report Scope - Dairy Ingredients Market

Report Attributes Details
Industry Size (2025) USD 74.1 billion
Industry Size (2035) USD 132.9 billion
CAGR (2025 to 2035) 6.0%
Base Year for Estimation 2024
Historical Period 2020 to 2024
Projections Period 2025 to 2035
Quantitative Units USD billion for value and metric tons for volume
Product Types Analyzed (Segment 1) Proteins, Milk Powder, Milk Fat Concentrates, Casein and Caseinates, Lactose & Its Derivatives, Whey, Other Types
Form Types Analyzed (Segment 2) Powder, Liquid
Applications Analyzed (Segment 3) Bakery & Confectionery, Dairy Products, Sports and Clinical Nutrition, Infant Formulas (Standard Infant Formula, Specialty Infant Formula), Cosmetics, Pharmaceuticals, Other Applications
Distribution Channels Analyzed (Segment 4) E-Commerce, Specialty Retailers, Supermarket & Hypermarket, Food Service Sector, Other Distribution Channels
Regions Covered North America, Western Europe, Eastern Europe, Russia & Belarus, Balkan & Baltic Countries, Latin America, Central Asia, East Asia, Middle East & Africa, South Asia & Pacific
Countries Covered United States, Canada, Germany, United Kingdom, France, Italy, Spain, Poland, Russia, Belarus, Serbia, Romania, China, India, Japan, South Korea, Australia, Brazil, Mexico, Argentina, Saudi Arabia, UAE, South Africa
Key Players Lactalis Group, AMCO Proteins, Arla Foods, Cayuga Dairy Ingredients, Dairy Farmers of America, Epi Ingredients, Fonterra Co-operative Group, FrieslandCampina, Glanbia Plc, Gujarat Co-operative Milk Marketing Federation Ltd. (GCMMF), Ingredia SA, Kerry Group, Megmilk Snow Brand Co. Ltd., Meiji Holdings Co. Ltd., China Mengniu Dairy Company Limited, Yili Group, Nestlé S.A., Saputo, Schreiber Foods Inc., Sodiaal Group, Volac International Ltd., Others
Additional Attributes Dollar sales, share by product type and application, expansion in clinical and infant nutrition, growing demand for milk protein isolates, strategic retail and foodservice partnerships, innovation in functional dairy formulations

Key Segments

By Product Type:

The industry has been categorized into Proteins, Milk Powder, Milk Fat Concentrates, Casein and Caseinates, Lactose & Its Derivatives, Whey and Other Types.

By Form Type:

The industry has been categorized into Powder and Liquid.

By Application:

The industry is categorized into Bakery & Confectionery, Dairy Products, Sports and Clinical Nutrition, Infant Formulas (Standard Infant Formula and Specialty Infant Formula), Cosmetics, Pharmaceuticals, Other Applications

By Distribution Channel:

The industry has been categorized into E-Commerce, Specialty Retailers, Supermarket & Hypermarket, Food Service Sector and Others Distribution Channels.

By Region:

Industry analysis has been carried out in key countries of North America, Western Europe, Eastern, Europe, Russia & Belarus, Balkan & Baltic Countries, Latin America, Central Asia, East Asia, Middle East & Africa and South Asia & Pacific.

Table of Content

  1. Executive Summary
    • Global Market Outlook
    • Demand-side Trends
    • Supply-side Trends
    • Technology Roadmap Analysis
    • Analysis and Recommendations
  2. Market Overview
    • Market Coverage / Taxonomy
    • Market Definition / Scope / Limitations
  3. Market Background
    • Market Dynamics
      • Drivers
      • Restraints
      • Opportunity
      • Trends
    • Scenario Forecast
      • Demand in Optimistic Scenario
      • Demand in Likely Scenario
      • Demand in Conservative Scenario
    • Opportunity Map Analysis
    • Product Life Cycle Analysis
    • Supply Chain Analysis
      • Supply Side Participants and their Roles
        • Producers
        • Mid-Level Participants (Traders/ Agents/ Brokers)
        • Wholesalers and Distributors
      • Value Added and Value Created at Node in the Supply Chain
      • List of Raw Material Suppliers
      • List of Existing and Potential Buyer’s
    • Investment Feasibility Matrix
    • Value Chain Analysis
      • Profit Margin Analysis
      • Wholesalers and Distributors
      • Retailers
    • PESTLE and Porter’s Analysis
    • Regulatory Landscape
      • By Key Regions
      • By Key Countries
    • Regional Parent Market Outlook
    • Production and Consumption Statistics
    • Import and Export Statistics
  4. Global Market Analysis 2020 to 2024 and Forecast, 2025 to 2035
    • Historical Market Size Value (USD Billion) & Volume (MT) Analysis, 2020 to 2024
    • Current and Future Market Size Value (USD Billion) & Volume (MT) Projections, 2025 to 2035
      • Y-o-Y Growth Trend Analysis
      • Absolute $ Opportunity Analysis
  5. Global Market Pricing Analysis 2020 to 2024 and Forecast 2025 to 2035
  6. Global Market Analysis 2020 to 2024 and Forecast 2025 to 2035, By Product Type
    • Introduction / Key Findings
    • Historical Market Size Value (USD Billion) & Volume (MT) Analysis By Product Type, 2020 to 2024
    • Current and Future Market Size Value (USD Billion) & Volume (MT) Analysis and Forecast By Product Type, 2025 to 2035
      • Proteins
      • Milk Powder
      • Milk Fat Concentrates
      • Casein and Caseinates
      • Lactose & Its Derivatives
      • Whey
      • Other Types
    • Y-o-Y Growth Trend Analysis By Product Type, 2020 to 2024
    • Absolute $ Opportunity Analysis By Product Type, 2025 to 2035
  7. Global Market Analysis 2020 to 2024 and Forecast 2025 to 2035, By Form Type
    • Introduction / Key Findings
    • Historical Market Size Value (USD Billion) & Volume (MT) Analysis By Form Type, 2020 to 2024
    • Current and Future Market Size Value (USD Billion) & Volume (MT) Analysis and Forecast By Form Type, 2025 to 2035
      • Powder
      • Liquid
    • Y-o-Y Growth Trend Analysis By Form Type, 2020 to 2024
    • Absolute $ Opportunity Analysis By Form Type, 2025 to 2035
  8. Global Market Analysis 2020 to 2024 and Forecast 2025 to 2035, By Application
    • Introduction / Key Findings
    • Historical Market Size Value (USD Billion) & Volume (MT) Analysis By Application, 2020 to 2024
    • Current and Future Market Size Value (USD Billion) & Volume (MT) Analysis and Forecast By Application, 2025 to 2035
      • Bakery & Confectionery
      • Dairy Products
      • Sports and Clinical Nutrition
      • Infant Formulas
        • Standard Infant Formula
        • Specialty Infant Formula
      • Cosmetics
      • Pharmaceuticals
      • Other Applications
    • Y-o-Y Growth Trend Analysis By Application, 2020 to 2024
    • Absolute $ Opportunity Analysis By Application, 2025 to 2035
  9. Global Market Analysis 2020 to 2024 and Forecast 2025 to 2035, By Distribution Channel
    • Introduction / Key Findings
    • Historical Market Size Value (USD Billion) & Volume (MT) Analysis By Distribution Channel, 2020 to 2024
    • Current and Future Market Size Value (USD Billion) & Volume (MT) Analysis and Forecast By Distribution Channel, 2025 to 2035
      • E-Commerce
      • Specialty Retailers
      • Supermarket & Hypermarket
      • Food Service Sector
      • Other Distribution Channels
    • Y-o-Y Growth Trend Analysis By Distribution Channel, 2020 to 2024
    • Absolute $ Opportunity Analysis By Distribution Channel, 2025 to 2035
  10. Global Market Analysis 2020 to 2024 and Forecast 2025 to 2035, By Region
    • Introduction
    • Historical Market Size Value (USD Billion) & Volume (MT) Analysis By Region, 2020 to 2024
    • Current Market Size Value (USD Billion) & Volume (MT) Analysis and Forecast By Region, 2025 to 2035
      • North America
      • Latin America
      • Western Europe
      • Eastern Europe
      • East Asia
      • South Asia & Pacific
      • Middle East and Africa
    • Market Attractiveness Analysis By Region
  11. North America Market Analysis 2020 to 2024 and Forecast 2025 to 2035, By Country
    • Historical Market Size Value (USD Billion) & Volume (MT) Trend Analysis By Market Taxonomy, 2020 to 2024
    • Market Size Value (USD Billion) & Volume (MT) Forecast By Market Taxonomy, 2025 to 2035
      • By Country
        • USA
        • Canada
        • Mexico
      • By Product Type
      • By Form Type
      • By Application
      • By Distribution Channel
    • Market Attractiveness Analysis
      • By Country
      • By Product Type
      • By Form Type
      • By Application
      • By Distribution Channel
    • Key Takeaways
  12. Latin America Market Analysis 2020 to 2024 and Forecast 2025 to 2035, By Country
    • Historical Market Size Value (USD Billion) & Volume (MT) Trend Analysis By Market Taxonomy, 2020 to 2024
    • Market Size Value (USD Billion) & Volume (MT) Forecast By Market Taxonomy, 2025 to 2035
      • By Country
        • Brazil
        • Argentina
        • Rest of LATAM
      • By Product Type
      • By Form Type
      • By Application
      • By Distribution Channel
    • Market Attractiveness Analysis
      • By Country
      • By Product Type
      • By Form Type
      • By Application
      • By Distribution Channel
    • Key Takeaways
  13. Western Europe Market Analysis 2020 to 2024 and Forecast 2025 to 2035, By Country
    • Historical Market Size Value (USD Billion) & Volume (MT) Trend Analysis By Market Taxonomy, 2020 to 2024
    • Market Size Value (USD Billion) & Volume (MT) Forecast By Market Taxonomy, 2025 to 2035
      • By Country
        • Germany
        • Italy
        • France
        • UK
        • Spain
        • BENELUX
        • Nordic
        • Rest of W.Europe
      • By Product Type
      • By Form Type
      • By Application
      • By Distribution Channel
    • Market Attractiveness Analysis
      • By Country
      • By Product Type
      • By Form Type
      • By Application
      • By Distribution Channel
    • Key Takeaways
  14. Eastern Europe Market Analysis 2020 to 2024 and Forecast 2025 to 2035, By Country
    • Historical Market Size Value (USD Billion) & Volume (MT) Trend Analysis By Market Taxonomy, 2020 to 2024
    • Market Size Value (USD Billion) & Volume (MT) Forecast By Market Taxonomy, 2025 to 2035
      • By Country
        • Russia
        • Hungary
        • Poland
        • Balkan & Baltics
        • Rest of E. Europe
      • By Product Type
      • By Form Type
      • By Application
      • By Distribution Channel
    • Market Attractiveness Analysis
      • By Country
      • By Product Type
      • By Form Type
      • By Application
      • By Distribution Channel
    • Key Takeaways
  15. East Asia Market Analysis 2020 to 2024 and Forecast 2025 to 2035, By Country
    • Historical Market Size Value (USD Billion) & Volume (MT) Trend Analysis By Market Taxonomy, 2020 to 2024
    • Market Size Value (USD Billion) & Volume (MT) Forecast By Market Taxonomy, 2025 to 2035
      • By Country
        • China
        • Japan
        • South Korea
      • By Product Type
      • By Form Type
      • By Application
      • By Distribution Channel
    • Market Attractiveness Analysis
      • By Country
      • By Product Type
      • By Form Type
      • By Application
      • By Distribution Channel
    • Key Takeaways
  16. South Asia & Pacific Market Analysis 2020 to 2024 and Forecast 2025 to 2035, By Country
    • Historical Market Size Value (USD Billion) & Volume (MT) Trend Analysis By Market Taxonomy, 2020 to 2024
    • Market Size Value (USD Billion) & Volume (MT) Forecast By Market Taxonomy, 2025 to 2035
      • By Country
        • India
        • Australia & New Zealand
        • ASEAN
        • Rest of SAP
      • By Product Type
      • By Form Type
      • By Application
      • By Distribution Channel
    • Market Attractiveness Analysis
      • By Country
      • By Product Type
      • By Form Type
      • By Application
      • By Distribution Channel
    • Key Takeaways
  17. Middle East and Africa Market Analysis 2020 to 2024 and Forecast 2025 to 2035, By Country
    • Historical Market Size Value (USD Billion) & Volume (MT) Trend Analysis By Market Taxonomy, 2020 to 2024
    • Market Size Value (USD Billion) & Volume (MT) Forecast By Market Taxonomy, 2025 to 2035
      • By Country
        • GCC Countries
        • Northern Africa
        • South Africa
        • Turkiye
        • Rest of MEA
      • By Product Type
      • By Form Type
      • By Application
      • By Distribution Channel
    • Market Attractiveness Analysis
      • By Country
      • By Product Type
      • By Form Type
      • By Application
      • By Distribution Channel
    • Key Takeaways
  18. Key Countries Market Analysis
    • USA
      • Pricing Analysis
      • Market Share Analysis, 2024
        • By Product Type
        • By Form Type
        • By Application
        • By Distribution Channel
    • Canada
      • Pricing Analysis
      • Market Share Analysis, 2024
        • By Product Type
        • By Form Type
        • By Application
        • By Distribution Channel
    • Brazil
      • Pricing Analysis
      • Market Share Analysis, 2024
        • By Product Type
        • By Form Type
        • By Application
        • By Distribution Channel
    • Mexico
      • Pricing Analysis
      • Market Share Analysis, 2024
        • By Product Type
        • By Form Type
        • By Application
        • By Distribution Channel
    • Argentina
      • Pricing Analysis
      • Market Share Analysis, 2024
        • By Product Type
        • By Form Type
        • By Application
        • By Distribution Channel
  19. Market Structure Analysis
    • Competition Dashboard
    • Competition Benchmarking
    • Market Share Analysis of Top Players
      • By Regional
      • By Product Type
      • By Form Type
      • By Application
      • By Distribution Channel
  20. Competition Analysis
    • Competition Deep Dive
      • Lactalis Group
        • Overview
        • Product Portfolio
        • Profitability by Market Segments (Product/Age /Sales Channel/Region)
        • Sales Footprint
        • Strategy Overview
          • Marketing Strategy
          • Product Strategy
          • Channel Strategy
      • AMCO Proteins
        • Overview
        • Product Portfolio
        • Profitability by Market Segments (Product/Age /Sales Channel/Region)
        • Sales Footprint
        • Strategy Overview
          • Marketing Strategy
          • Product Strategy
          • Channel Strategy
      • Arla Foods
        • Overview
        • Product Portfolio
        • Profitability by Market Segments (Product/Age /Sales Channel/Region)
        • Sales Footprint
        • Strategy Overview
          • Marketing Strategy
          • Product Strategy
          • Channel Strategy
      • Cayuga Dairy Ingredients
        • Overview
        • Product Portfolio
        • Profitability by Market Segments (Product/Age /Sales Channel/Region)
        • Sales Footprint
        • Strategy Overview
          • Marketing Strategy
          • Product Strategy
          • Channel Strategy
      • Dairy Farmers of America
        • Overview
        • Product Portfolio
        • Profitability by Market Segments (Product/Age /Sales Channel/Region)
        • Sales Footprint
        • Strategy Overview
          • Marketing Strategy
          • Product Strategy
          • Channel Strategy
      • Epi Ingredients
        • Overview
        • Product Portfolio
        • Profitability by Market Segments (Product/Age /Sales Channel/Region)
        • Sales Footprint
        • Strategy Overview
          • Marketing Strategy
          • Product Strategy
          • Channel Strategy
      • Fonterra Co-operative Group
        • Overview
        • Product Portfolio
        • Profitability by Market Segments (Product/Age /Sales Channel/Region)
        • Sales Footprint
        • Strategy Overview
          • Marketing Strategy
          • Product Strategy
          • Channel Strategy
      • FrieslandCampina
        • Overview
        • Product Portfolio
        • Profitability by Market Segments (Product/Age /Sales Channel/Region)
        • Sales Footprint
        • Strategy Overview
          • Marketing Strategy
          • Product Strategy
          • Channel Strategy
      • Glanbia Plc
        • Overview
        • Product Portfolio
        • Profitability by Market Segments (Product/Age /Sales Channel/Region)
        • Sales Footprint
        • Strategy Overview
          • Marketing Strategy
          • Product Strategy
          • Channel Strategy
      • Gujarat Co-operative Milk Marketing Federation Ltd. (GCMMF)
        • Overview
        • Product Portfolio
        • Profitability by Market Segments (Product/Age /Sales Channel/Region)
        • Sales Footprint
        • Strategy Overview
          • Marketing Strategy
          • Product Strategy
          • Channel Strategy
      • Ingredia SA
        • Overview
        • Product Portfolio
        • Profitability by Market Segments (Product/Age /Sales Channel/Region)
        • Sales Footprint
        • Strategy Overview
          • Marketing Strategy
          • Product Strategy
          • Channel Strategy
      • Kerry Group
        • Overview
        • Product Portfolio
        • Profitability by Market Segments (Product/Age /Sales Channel/Region)
        • Sales Footprint
        • Strategy Overview
          • Marketing Strategy
          • Product Strategy
          • Channel Strategy
      • Megmilk Snow Brand Co. Ltd.
        • Overview
        • Product Portfolio
        • Profitability by Market Segments (Product/Age /Sales Channel/Region)
        • Sales Footprint
        • Strategy Overview
          • Marketing Strategy
          • Product Strategy
          • Channel Strategy
      • Meiji Holdings Co. Ltd.
        • Overview
        • Product Portfolio
        • Profitability by Market Segments (Product/Age /Sales Channel/Region)
        • Sales Footprint
        • Strategy Overview
          • Marketing Strategy
          • Product Strategy
          • Channel Strategy
      • China Mengniu Dairy Company Limited
        • Overview
        • Product Portfolio
        • Profitability by Market Segments (Product/Age /Sales Channel/Region)
        • Sales Footprint
        • Strategy Overview
          • Marketing Strategy
          • Product Strategy
          • Channel Strategy
      • Yili Group
        • Overview
        • Product Portfolio
        • Profitability by Market Segments (Product/Age /Sales Channel/Region)
        • Sales Footprint
        • Strategy Overview
          • Marketing Strategy
          • Product Strategy
          • Channel Strategy
      • Nestlé S.A.
        • Overview
        • Product Portfolio
        • Profitability by Market Segments (Product/Age /Sales Channel/Region)
        • Sales Footprint
        • Strategy Overview
          • Marketing Strategy
          • Product Strategy
          • Channel Strategy
      • Saputo
        • Overview
        • Product Portfolio
        • Profitability by Market Segments (Product/Age /Sales Channel/Region)
        • Sales Footprint
        • Strategy Overview
          • Marketing Strategy
          • Product Strategy
          • Channel Strategy
      • Schreiber Foods Inc.
        • Overview
        • Product Portfolio
        • Profitability by Market Segments (Product/Age /Sales Channel/Region)
        • Sales Footprint
        • Strategy Overview
          • Marketing Strategy
          • Product Strategy
          • Channel Strategy
      • Sodiaal Group
        • Overview
        • Product Portfolio
        • Profitability by Market Segments (Product/Age /Sales Channel/Region)
        • Sales Footprint
        • Strategy Overview
          • Marketing Strategy
          • Product Strategy
          • Channel Strategy
  21. Assumptions & Acronyms Used
  22. Research Methodology

List of Tables

  • Table 1: Global Market Value (USD Billion) Forecast by Region, 2020-2035
  • Table 2: Global Market Volume (MT) Forecast by Region, 2020-2035
  • Table 3: Global Market Value (USD Billion) Forecast by Product Type, 2020-2035
  • Table 4: Global Market Volume (MT) Forecast by Product Type, 2020-2035
  • Table 5: Global Market Value (USD Billion) Forecast by Form Type, 2020-2035
  • Table 6: Global Market Volume (MT) Forecast by Form Type, 2020-2035
  • Table 7: Global Market Value (USD Billion) Forecast by Application, 2020-2035
  • Table 8: Global Market Volume (MT) Forecast by Application, 2020-2035
  • Table 9: Global Market Value (USD Billion) Forecast by Distribution Channel, 2020-2035
  • Table 10: Global Market Volume (MT) Forecast by Distribution Channel, 2020-2035
  • Table 11: North America Market Value (USD Billion) Forecast by Country, 2020-2035
  • Table 12: North America Market Volume (MT) Forecast by Country, 2020-2035
  • Table 13: North America Market Value (USD Billion) Forecast by Product Type, 2020-2035
  • Table 14: North America Market Volume (MT) Forecast by Product Type, 2020-2035
  • Table 15: North America Market Value (USD Billion) Forecast by Form Type, 2020-2035
  • Table 16: North America Market Volume (MT) Forecast by Form Type, 2020-2035
  • Table 17: North America Market Value (USD Billion) Forecast by Application, 2020-2035
  • Table 18: North America Market Volume (MT) Forecast by Application, 2020-2035
  • Table 19: North America Market Value (USD Billion) Forecast by Distribution Channel, 2020-2035
  • Table 20: North America Market Volume (MT) Forecast by Distribution Channel, 2020-2035
  • Table 21: Latin America Market Value (USD Billion) Forecast by Country, 2020-2035
  • Table 22: Latin America Market Volume (MT) Forecast by Country, 2020-2035
  • Table 23: Latin America Market Value (USD Billion) Forecast by Product Type, 2020-2035
  • Table 24: Latin America Market Volume (MT) Forecast by Product Type, 2020-2035
  • Table 25: Latin America Market Value (USD Billion) Forecast by Form Type, 2020-2035
  • Table 26: Latin America Market Volume (MT) Forecast by Form Type, 2020-2035
  • Table 27: Latin America Market Value (USD Billion) Forecast by Application, 2020-2035
  • Table 28: Latin America Market Volume (MT) Forecast by Application, 2020-2035
  • Table 29: Latin America Market Value (USD Billion) Forecast by Distribution Channel, 2020-2035
  • Table 30: Latin America Market Volume (MT) Forecast by Distribution Channel, 2020-2035
  • Table 31: Western Europe Market Value (USD Billion) Forecast by Country, 2020-2035
  • Table 32: Western Europe Market Volume (MT) Forecast by Country, 2020-2035
  • Table 33: Western Europe Market Value (USD Billion) Forecast by Product Type, 2020-2035
  • Table 34: Western Europe Market Volume (MT) Forecast by Product Type, 2020-2035
  • Table 35: Western Europe Market Value (USD Billion) Forecast by Form Type, 2020-2035
  • Table 36: Western Europe Market Volume (MT) Forecast by Form Type, 2020-2035
  • Table 37: Western Europe Market Value (USD Billion) Forecast by Application, 2020-2035
  • Table 38: Western Europe Market Volume (MT) Forecast by Application, 2020-2035
  • Table 39: Western Europe Market Value (USD Billion) Forecast by Distribution Channel, 2020-2035
  • Table 40: Western Europe Market Volume (MT) Forecast by Distribution Channel, 2020-2035
  • Table 41: Eastern Europe Market Value (USD Billion) Forecast by Country, 2020-2035
  • Table 42: Eastern Europe Market Volume (MT) Forecast by Country, 2020-2035
  • Table 43: Eastern Europe Market Value (USD Billion) Forecast by Product Type, 2020-2035
  • Table 44: Eastern Europe Market Volume (MT) Forecast by Product Type, 2020-2035
  • Table 45: Eastern Europe Market Value (USD Billion) Forecast by Form Type, 2020-2035
  • Table 46: Eastern Europe Market Volume (MT) Forecast by Form Type, 2020-2035
  • Table 47: Eastern Europe Market Value (USD Billion) Forecast by Application, 2020-2035
  • Table 48: Eastern Europe Market Volume (MT) Forecast by Application, 2020-2035
  • Table 49: Eastern Europe Market Value (USD Billion) Forecast by Distribution Channel, 2020-2035
  • Table 50: Eastern Europe Market Volume (MT) Forecast by Distribution Channel, 2020-2035
  • Table 51: East Asia Market Value (USD Billion) Forecast by Country, 2020-2035
  • Table 52: East Asia Market Volume (MT) Forecast by Country, 2020-2035
  • Table 53: East Asia Market Value (USD Billion) Forecast by Product Type, 2020-2035
  • Table 54: East Asia Market Volume (MT) Forecast by Product Type, 2020-2035
  • Table 55: East Asia Market Value (USD Billion) Forecast by Form Type, 2020-2035
  • Table 56: East Asia Market Volume (MT) Forecast by Form Type, 2020-2035
  • Table 57: East Asia Market Value (USD Billion) Forecast by Application, 2020-2035
  • Table 58: East Asia Market Volume (MT) Forecast by Application, 2020-2035
  • Table 59: East Asia Market Value (USD Billion) Forecast by Distribution Channel, 2020-2035
  • Table 60: East Asia Market Volume (MT) Forecast by Distribution Channel, 2020-2035
  • Table 61: South Asia & Pacific Market Value (USD Billion) Forecast by Country, 2020-2035
  • Table 62: South Asia & Pacific Market Volume (MT) Forecast by Country, 2020-2035
  • Table 63: South Asia & Pacific Market Value (USD Billion) Forecast by Product Type, 2020-2035
  • Table 64: South Asia & Pacific Market Volume (MT) Forecast by Product Type, 2020-2035
  • Table 65: South Asia & Pacific Market Value (USD Billion) Forecast by Form Type, 2020-2035
  • Table 66: South Asia & Pacific Market Volume (MT) Forecast by Form Type, 2020-2035
  • Table 67: South Asia & Pacific Market Value (USD Billion) Forecast by Application, 2020-2035
  • Table 68: South Asia & Pacific Market Volume (MT) Forecast by Application, 2020-2035
  • Table 69: South Asia & Pacific Market Value (USD Billion) Forecast by Distribution Channel, 2020-2035
  • Table 70: South Asia & Pacific Market Volume (MT) Forecast by Distribution Channel, 2020-2035
  • Table 71: Middle East and Africa Market Value (USD Billion) Forecast by Country, 2020-2035
  • Table 72: Middle East and Africa Market Volume (MT) Forecast by Country, 2020-2035
  • Table 73: Middle East and Africa Market Value (USD Billion) Forecast by Product Type, 2020-2035
  • Table 74: Middle East and Africa Market Volume (MT) Forecast by Product Type, 2020-2035
  • Table 75: Middle East and Africa Market Value (USD Billion) Forecast by Form Type, 2020-2035
  • Table 76: Middle East and Africa Market Volume (MT) Forecast by Form Type, 2020-2035
  • Table 77: Middle East and Africa Market Value (USD Billion) Forecast by Application, 2020-2035
  • Table 78: Middle East and Africa Market Volume (MT) Forecast by Application, 2020-2035
  • Table 79: Middle East and Africa Market Value (USD Billion) Forecast by Distribution Channel, 2020-2035
  • Table 80: Middle East and Africa Market Volume (MT) Forecast by Distribution Channel, 2020-2035

List of Figures

  • Figure 1: Global Market Volume (MT) Forecast 2020- 2035
  • Figure 2: Global Market Pricing Analysis
  • Figure 3: Global Market Value (USD Billion) Forecast 2020- 2035
  • Figure 4: Global Market Value Share and BPS Analysis by Product Type, 2025 and 2035
  • Figure 5: Global Market Y-o-Y Growth Comparison by Product Type, 2025- 2035
  • Figure 6: Global Market Attractiveness Analysis by Product Type
  • Figure 7: Global Market Value Share and BPS Analysis by Form Type, 2025 and 2035
  • Figure 8: Global Market Y-o-Y Growth Comparison by Form Type, 2025- 2035
  • Figure 9: Global Market Attractiveness Analysis by Form Type
  • Figure 10: Global Market Value Share and BPS Analysis by Application, 2025 and 2035
  • Figure 11: Global Market Y-o-Y Growth Comparison by Application, 2025- 2035
  • Figure 12: Global Market Attractiveness Analysis by Application
  • Figure 13: Global Market Value Share and BPS Analysis by Distribution Channel, 2025 and 2035
  • Figure 14: Global Market Y-o-Y Growth Comparison by Distribution Channel, 2025- 2035
  • Figure 15: Global Market Attractiveness Analysis by Distribution Channel
  • Figure 16: Global Market Value (USD Billion) Share and BPS Analysis by Region, 2025 and 2035
  • Figure 17: Global Market Y-o-Y Growth Comparison by Region, 2025- 2035
  • Figure 18: Global Market Attractiveness Analysis by Region
  • Figure 19: North America Market Incremental $ Opportunity, 2025- 2035
  • Figure 20: Latin America Market Incremental $ Opportunity, 2025- 2035
  • Figure 21: Western Europe Market Incremental $ Opportunity, 2025- 2035
  • Figure 22: Eastern Europe Market Incremental $ Opportunity, 2025- 2035
  • Figure 23: East Asia Market Incremental $ Opportunity, 2025- 2035
  • Figure 24: South Asia & Pacific Market Incremental $ Opportunity, 2025- 2035
  • Figure 25: Middle East and Africa Market Incremental $ Opportunity, 2025- 2035
  • Figure 26: North America Market Value Share and BPS Analysis by Country, 2025 and 2035
  • Figure 27: North America Market Value Share and BPS Analysis by Product Type, 2025 and 2035
  • Figure 28: North America Market Y-o-Y Growth Comparison by Product Type, 2025- 2035
  • Figure 29: North America Market Attractiveness Analysis by Product Type
  • Figure 30: North America Market Value Share and BPS Analysis by Form Type, 2025 and 2035
  • Figure 31: North America Market Y-o-Y Growth Comparison by Form Type, 2025- 2035
  • Figure 32: North America Market Attractiveness Analysis by Form Type
  • Figure 33: North America Market Value Share and BPS Analysis by Application, 2025 and 2035
  • Figure 34: North America Market Y-o-Y Growth Comparison by Application, 2025- 2035
  • Figure 35: North America Market Attractiveness Analysis by Application
  • Figure 36: North America Market Value Share and BPS Analysis by Distribution Channel, 2025 and 2035
  • Figure 37: North America Market Y-o-Y Growth Comparison by Distribution Channel, 2025- 2035
  • Figure 38: North America Market Attractiveness Analysis by Distribution Channel
  • Figure 39: Latin America Market Value Share and BPS Analysis by Country, 2025 and 2035
  • Figure 40: Latin America Market Value Share and BPS Analysis by Product Type, 2025 and 2035
  • Figure 41: Latin America Market Y-o-Y Growth Comparison by Product Type, 2025- 2035
  • Figure 42: Latin America Market Attractiveness Analysis by Product Type
  • Figure 43: Latin America Market Value Share and BPS Analysis by Form Type, 2025 and 2035
  • Figure 44: Latin America Market Y-o-Y Growth Comparison by Form Type, 2025- 2035
  • Figure 45: Latin America Market Attractiveness Analysis by Form Type
  • Figure 46: Latin America Market Value Share and BPS Analysis by Application, 2025 and 2035
  • Figure 47: Latin America Market Y-o-Y Growth Comparison by Application, 2025- 2035
  • Figure 48: Latin America Market Attractiveness Analysis by Application
  • Figure 49: Latin America Market Value Share and BPS Analysis by Distribution Channel, 2025 and 2035
  • Figure 50: Latin America Market Y-o-Y Growth Comparison by Distribution Channel, 2025- 2035
  • Figure 51: Latin America Market Attractiveness Analysis by Distribution Channel
  • Figure 52: Western Europe Market Value Share and BPS Analysis by Country, 2025 and 2035
  • Figure 53: Western Europe Market Value Share and BPS Analysis by Product Type, 2025 and 2035
  • Figure 54: Western Europe Market Y-o-Y Growth Comparison by Product Type, 2025- 2035
  • Figure 55: Western Europe Market Attractiveness Analysis by Product Type
  • Figure 56: Western Europe Market Value Share and BPS Analysis by Form Type, 2025 and 2035
  • Figure 57: Western Europe Market Y-o-Y Growth Comparison by Form Type, 2025- 2035
  • Figure 58: Western Europe Market Attractiveness Analysis by Form Type
  • Figure 59: Western Europe Market Value Share and BPS Analysis by Application, 2025 and 2035
  • Figure 60: Western Europe Market Y-o-Y Growth Comparison by Application, 2025- 2035
  • Figure 61: Western Europe Market Attractiveness Analysis by Application
  • Figure 62: Western Europe Market Value Share and BPS Analysis by Distribution Channel, 2025 and 2035
  • Figure 63: Western Europe Market Y-o-Y Growth Comparison by Distribution Channel, 2025- 2035
  • Figure 64: Western Europe Market Attractiveness Analysis by Distribution Channel
  • Figure 65: Eastern Europe Market Value Share and BPS Analysis by Country, 2025 and 2035
  • Figure 66: Eastern Europe Market Value Share and BPS Analysis by Product Type, 2025 and 2035
  • Figure 67: Eastern Europe Market Y-o-Y Growth Comparison by Product Type, 2025- 2035
  • Figure 68: Eastern Europe Market Attractiveness Analysis by Product Type
  • Figure 69: Eastern Europe Market Value Share and BPS Analysis by Form Type, 2025 and 2035
  • Figure 70: Eastern Europe Market Y-o-Y Growth Comparison by Form Type, 2025- 2035
  • Figure 71: Eastern Europe Market Attractiveness Analysis by Form Type
  • Figure 72: Eastern Europe Market Value Share and BPS Analysis by Application, 2025 and 2035
  • Figure 73: Eastern Europe Market Y-o-Y Growth Comparison by Application, 2025- 2035
  • Figure 74: Eastern Europe Market Attractiveness Analysis by Application
  • Figure 75: Eastern Europe Market Value Share and BPS Analysis by Distribution Channel, 2025 and 2035
  • Figure 76: Eastern Europe Market Y-o-Y Growth Comparison by Distribution Channel, 2025- 2035
  • Figure 77: Eastern Europe Market Attractiveness Analysis by Distribution Channel
  • Figure 78: East Asia Market Value Share and BPS Analysis by Country, 2025 and 2035
  • Figure 79: East Asia Market Value Share and BPS Analysis by Product Type, 2025 and 2035
  • Figure 80: East Asia Market Y-o-Y Growth Comparison by Product Type, 2025- 2035
  • Figure 81: East Asia Market Attractiveness Analysis by Product Type
  • Figure 82: East Asia Market Value Share and BPS Analysis by Form Type, 2025 and 2035
  • Figure 83: East Asia Market Y-o-Y Growth Comparison by Form Type, 2025- 2035
  • Figure 84: East Asia Market Attractiveness Analysis by Form Type
  • Figure 85: East Asia Market Value Share and BPS Analysis by Application, 2025 and 2035
  • Figure 86: East Asia Market Y-o-Y Growth Comparison by Application, 2025- 2035
  • Figure 87: East Asia Market Attractiveness Analysis by Application
  • Figure 88: East Asia Market Value Share and BPS Analysis by Distribution Channel, 2025 and 2035
  • Figure 89: East Asia Market Y-o-Y Growth Comparison by Distribution Channel, 2025- 2035
  • Figure 90: East Asia Market Attractiveness Analysis by Distribution Channel
  • Figure 91: South Asia & Pacific Market Value Share and BPS Analysis by Country, 2025 and 2035
  • Figure 92: South Asia & Pacific Market Value Share and BPS Analysis by Product Type, 2025 and 2035
  • Figure 93: South Asia & Pacific Market Y-o-Y Growth Comparison by Product Type, 2025- 2035
  • Figure 94: South Asia & Pacific Market Attractiveness Analysis by Product Type
  • Figure 95: South Asia & Pacific Market Value Share and BPS Analysis by Form Type, 2025 and 2035
  • Figure 96: South Asia & Pacific Market Y-o-Y Growth Comparison by Form Type, 2025- 2035
  • Figure 97: South Asia & Pacific Market Attractiveness Analysis by Form Type
  • Figure 98: South Asia & Pacific Market Value Share and BPS Analysis by Application, 2025 and 2035
  • Figure 99: South Asia & Pacific Market Y-o-Y Growth Comparison by Application, 2025- 2035
  • Figure 100: South Asia & Pacific Market Attractiveness Analysis by Application
  • Figure 101: South Asia & Pacific Market Value Share and BPS Analysis by Distribution Channel, 2025 and 2035
  • Figure 102: South Asia & Pacific Market Y-o-Y Growth Comparison by Distribution Channel, 2025- 2035
  • Figure 103: South Asia & Pacific Market Attractiveness Analysis by Distribution Channel
  • Figure 104: Middle East and Africa Market Value Share and BPS Analysis by Country, 2025 and 2035
  • Figure 105: Middle East and Africa Market Value Share and BPS Analysis by Product Type, 2025 and 2035
  • Figure 106: Middle East and Africa Market Y-o-Y Growth Comparison by Product Type, 2025- 2035
  • Figure 107: Middle East and Africa Market Attractiveness Analysis by Product Type
  • Figure 108: Middle East and Africa Market Value Share and BPS Analysis by Form Type, 2025 and 2035
  • Figure 109: Middle East and Africa Market Y-o-Y Growth Comparison by Form Type, 2025- 2035
  • Figure 110: Middle East and Africa Market Attractiveness Analysis by Form Type
  • Figure 111: Middle East and Africa Market Value Share and BPS Analysis by Application, 2025 and 2035
  • Figure 112: Middle East and Africa Market Y-o-Y Growth Comparison by Application, 2025- 2035
  • Figure 113: Middle East and Africa Market Attractiveness Analysis by Application
  • Figure 114: Middle East and Africa Market Value Share and BPS Analysis by Distribution Channel, 2025 and 2035
  • Figure 115: Middle East and Africa Market Y-o-Y Growth Comparison by Distribution Channel, 2025- 2035
  • Figure 116: Middle East and Africa Market Attractiveness Analysis by Distribution Channel
  • Figure 117: Global Market - Tier Structure Analysis
  • Figure 118: Global Market - Company Share Analysis

Frequently Asked Questions

What is the projected size of the dairy ingredients market in 2025?

The industry is projected to reach USD 74.1 billion in 2025.

What is the growth rate of the dairy ingredients market from 2025 to 2035?

The industry is expected to grow at a CAGR of 6.0% from 2025 to 2035.

Which product type will dominate the dairy ingredients market in 2025?

Milk powder is expected to hold a 28% share in 2025.

What is the industry share of dairy products in the dairy ingredients market by 2025?

Dairy products will account for 38% of the market in 2025.

Which country will have the highest growth in the dairy ingredients market by 2035?

India is projected to have the highest CAGR of 7.8% from 2025 to 2035.

Explore Similar Insights

Future Market Insights

Dairy Ingredients Market