Cultured Non-Fat Dairy Ingredients Market Size and Share Forecast Outlook 2025 to 2035

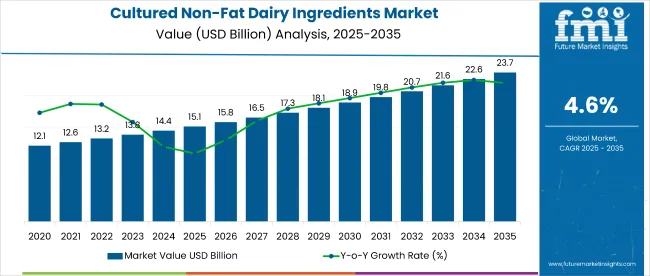
The global cultured non-fat dairy ingredients market is valued at USD 15.1 billion by 2025 and USD 23.7 billion by 2035, reflecting a CAGR of 4.6%. Factors driving this growth include rising demand for healthy, low-fat dairy alternatives. The market is also benefiting from the rising popularity of functional foods and dairy products with longer shelf life, which is attributed to fermentation processes used in cultured non-fat dairy ingredients.
Quick Stats Of Cultured Non-Fat Dairy Ingredients Market

  • Market Value (2025): USD 15.1 billion
  • Market Value (2035): USD 23.7 billion
  • Forecast CAGR: 4.6%
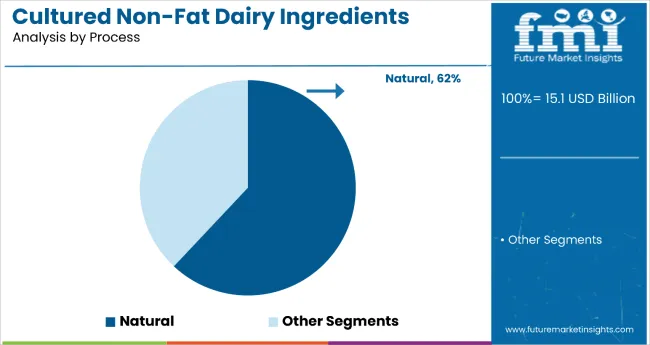
  • Leading Process in 2025: Natural Process (62% Market Share)
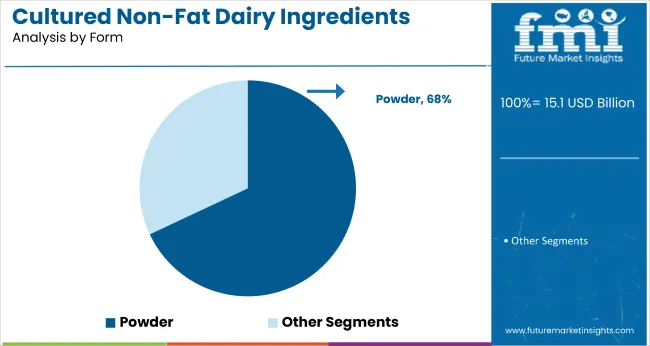
  • Top Form Segment: Powdered Form (68% Market Share)
  • Key Growth Region: North America (fastest-growing market in the USA with 6.0% CAGR)

Cultured Non Fat Dairy Ingredients Market

Metric Value
Estimated Size (2025E) USD 15.1 billion
Projected Value (2035F) USD 23.7 billion
CAGR (2025 to 2035) 4.6%

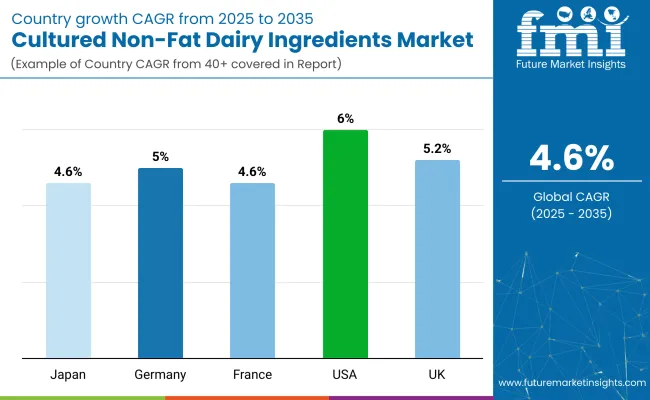
North America is expected to remain the dominant market for cultured non-fat dairy ingredients, particularly in the USA, growing at a CAGR of 6.0%. Meanwhile, the UK and Germany closely follow this rapid growth with prominent CAGRs of 5.2% and 5.0% from 2025 to 2035. Natural process leads the process segment with 62% of the market share. Meanwhile, the powdered form segment accounts for a significant share of 68% in 2025.

The market holds a significant share in several related parent markets. Within the dairy ingredients market, it accounts for approximately 12-15%, driven by the increasing demand for health-conscious and low-fat dairy options. In the functional dairy ingredients market, it contributes around 10-12%, as consumers seek functional benefits such as probiotics in cultured dairy products.

The market holds about 8-10% of the fermented dairy ingredients market, supported by the growing popularity of fermented products like yogurt. Additionally, in the reduced-fat dairy market, it makes up approximately 14-16%, reflecting the rising preference for low-fat dairy alternatives. These percentages highlight the growing prominence of cultured non-fat dairy ingredients across various dairy-related segments.

Recent innovations in the cultured non-fat dairy ingredients market include advancements in fermentation technology, which have led to improvements in the taste, texture, and shelf life of dairy products. These innovations are expected to expand the product offerings available to consumers, enhancing market appeal.

Government regulations promoting healthier food choices, coupled with increased consumer awareness about the health benefits of low-fat dairy, will continue to drive the growth of the cultured non-fat dairy ingredients market in the coming years. Additionally, there is growing investment in R&D for new product formulations and cleaner production processes, which will contribute to market competitiveness.

Cultured Non-Fat Dairy Ingredients Market Analysis by Top Investment Segment

The global cultured non-fat dairy ingredients market is segmented by process, nature, form, distribution channel, and region. The key segments under process include natural and artificial, while the nature segment is divided into organic compliant and certified, kosher certified, and conventional.

The form segment consists of liquid and powder options. Distribution channels are categorized into direct sales, indirect sales, store-based retailing, hypermarkets/supermarkets, convenience stores, discount stores, independent small groceries, and online retail. Geographically, the market is analyzed across North America, Latin America, Europe, the Middle East & Africa, East Asia, South Asia, and Oceania.
By Process, Natural Process Accounts for 62% of the Market Share

Cultured Non Fat Dairy Ingredients Market Analysis By Process

The natural process segment will continue to dominate the cultured non-fat dairy ingredients market in 2025 and 2035, accounting for 62% of the market share. This is primarily driven by the increasing demand for clean-label and minimally processed products, as consumers continue to seek healthier and more natural food options. With greater consumer focus on natural, healthy alternatives and the growing trend of avoiding artificial additives, the natural process segment’s market share is expected to expand.
  • Growth is driven by the clean-label trend and consumer preference for natural, healthy products.
  • Increasing regulatory support for natural food ingredients boosts segment expansion.
  • Natural cultured dairy ingredients are favored for their health benefits and clean-label appeal.

By Nature, the Organic Compliant and Certified Segment Accounts for 40% of the Market Share

Cultured Non Fat Dairy Ingredients Market Analysis By Nature

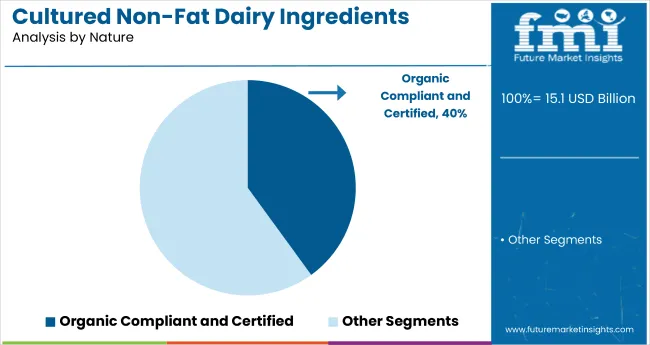
The organic, compliant, and certified segment is expected to lead the market with a 40% share in 2025, as demand for organic and clean food options continues to rise. Consumers are increasingly turning to organic products as they offer healthier, sustainable, and eco-friendly options. Organic dairy ingredients are highly valued, particularly in regions with high consumer health consciousness, such as North America and Europe.
  • The shift towards sustainable agriculture and increased consumer awareness of health benefits support organic growth.
  • The popularity of organic yogurt and dairy-based snacks is contributing to market expansion.
  • Certifications, such as USDA Organic, enhance consumer trust and drive demand.

By Form, the Powdered Segment Accounts for 68% of the market Share

Cultured Non Fat Dairy Ingredients Market Analysis By Form

Among the form segments, powdered cultured non-fat dairy ingredients will maintain their position as the largest segment with a 68% market share in 2025. This form’s popularity is driven by its extended shelf life, ease of transport, and versatility in various applications, such as food processing, nutritional supplements, and ready-to-eat meals. The increasing preference for convenience and cost-effective solutions will further bolster the powder segment’s share.
  • The growth is supported by powder's superior shelf life, ease of storage, and cost-effectiveness.
  • Rising demand from the bakery, snack foods, and nutritional supplements sectors will fuel this segment's growth.
  • Powdered dairy ingredients are preferred for their convenience, especially in large-scale food production.

By Distribution Channel, Direct Sales Accounts for 55% of the Market Share

Cultured Non Fat Dairy Ingredients Market Analysis By Distribution Channel

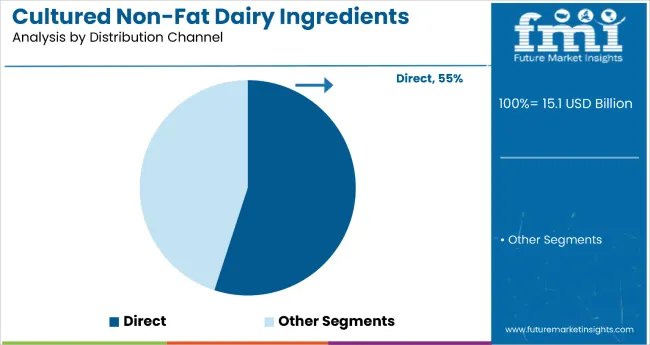
The direct sales channel will remain the leading distribution method for cultured non-fat dairy ingredients, accounting for 55% market share in 2025. Direct sales cater to bulk buyers, including food manufacturers and retailers, allowing for long-term contracts and large-scale orders. With increasing demand for functional ingredients, direct sales will remain crucial for market expansion, especially in developed regions.

  • Long-term contracts with food manufacturers and large-scale orders ensure steady demand.
  • Direct sales are driven by rising demand for functional ingredients in food products.
  • Customization and direct engagement with commercial buyers will further enhance the segment's growth.

Top Cultured Non-Fat Dairy Ingredients Market Dynamics
Recent Trends in the Cultured Non-Fat Dairy Ingredients Market

  • Increasing demand for clean-label and minimally processed dairy products.
  • Rise in consumer preference for organic and sustainable food options.
  • Growth in the use of cultured non-fat dairy ingredients in functional foods and beverages.
  • Advancements in fermentation technology are improving product shelf life and taste.

Challenges in the Cultured Non-Fat Dairy Ingredients Market

  • High competition from traditional dairy ingredients and plant-based alternatives.
  • Limited consumer awareness of cultured non-fat dairy ingredient benefits in emerging markets.
  • Regulatory hurdles in some regions for product certifications and ingredient approval.
  • Price sensitivity in price-conscious markets is hindering widespread adoption.

Analyzing Top Countries Producing, Using and Supplying Cultured Non-Fat Dairy Ingredients

Cultured Non Fat Dairy Ingredients Market Cagr Analysis By Country

The growth rates in the market vary across countries. The USA leads with a projected CAGR of 6.0%, driven by a strong demand for health-conscious products among millennials and government initiatives. The UK follows closely with a 5.2% CAGR, supported by a preference for organic and clean-label foods.

Germany is expected to grow at 5.0%, driven by consumer interest in health-focused dairy alternatives. France shows a steady growth rate of 4.6%, fueled by the demand for premium dairy products. Japan also exhibits a 4.6% CAGR, driven by an aging population and a focus on wellness.

The report covers an in-depth analysis of 40+ countries; five top-performing OECD countries are highlighted below.
United States Cultured Non-Fat Dairy Ingredients Market Analysis

Cultured Non Fat Dairy Ingredients Market Country Value Analysis

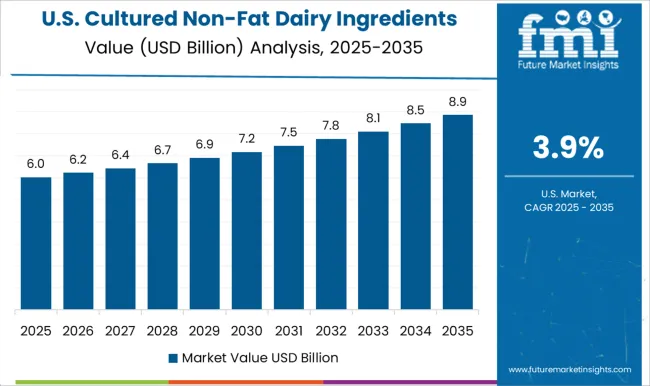
The cultured non-fat dairy ingredients market in the United States is projected to grow at a CAGR of 6.0% from 2025 to 2035. The demand for health-conscious and low-fat alternatives has significantly increased, especially among the millennial population. This shift is further supported by government initiatives promoting healthier dietary habits and the growing popularity of functional foods.

  • Growing awareness of health and wellness among the population.
  • Strong presence of leading dairy manufacturers and innovators.
  • Expansion of direct and online sales channels catering to a health-conscious market.

Cultured Non-Fat Dairy Ingredients Demand Analysis in the United Kingdom

The cultured non-fat dairy ingredients market in the UK is projected to grow at a CAGR of 5.2% from 2025 to 2035. The UK has seen an increasing shift towards organic and clean-label food products, with a growing preference for low-fat dairy alternatives. The country’s regulatory support for organic food certification and its highly competitive retail environment contribute to the rapid distribution of cultured non-fat dairy ingredients.
  • Strong consumer preference for organic and clean-label dairy products.
  • Government initiatives supporting the growth of organic food markets.
  • Proliferation of health and wellness trends in mainstream grocery stores.

Germany Cultured Non-Fat Dairy Ingredients Sales Analysis

Cultured Non Fat Dairy Ingredients Market Europe Country Market Share Analysis, 2025 & 2035

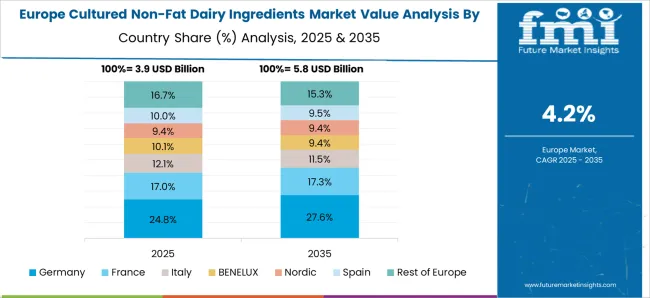
The sales of cultured non-fat dairy ingredients in Germany are anticipated to grow at a CAGR of 5.0% from 2025 to 2035. The German market is supported by an increasing demand for healthier food products, particularly within the dairy sector. German consumers are highly receptive to the health benefits associated with non-fat dairy ingredients, which aligns with the country’s broader focus on sustainability and nutritional wellness.

  • High demand for health-focused food products, especially dairy alternatives.
  • A robust dairy processing industry contributes to domestic production.
  • Rising popularity of functional foods with a focus on digestive health.

Cultured Non-Fat Dairy Ingredients Demand Analysis in France

The revenue from cultured non-fat dairy ingredients in France is projected to experience a steady growth rate of 4.6% CAGR from 2025 to 2035 in the cultured non-fat dairy ingredients market. The French market is characterized by a high preference for premium dairy products, including those with health benefits.

  • Increasing demand for premium, organic, and low-fat dairy products.
  • Strong retail networks for efficient product distribution.
  • Consumer education is driving the adoption of health-focused food choices.

Japan Cultured Non-Fat Dairy Ingredients Market Analysis

Japan’s cultured non-fat dairy ingredients market is expected to grow at a CAGR of 4.6% from 2025 to 2035. Japan has seen a growing preference for non-fat dairy products driven by an aging population and a strong focus on health and wellness. As Japanese consumers increasingly seek functional food ingredients, the demand for cultured non-fat dairy products is expected to rise.
  • Aging population driving demand for low-fat, functional dairy ingredients.
  • Consumer shift toward healthier, low-fat food products.
  • Robust technological advancements in food production and distribution.

Leading Cultured Non-Fat Dairy Ingredients Suppliers

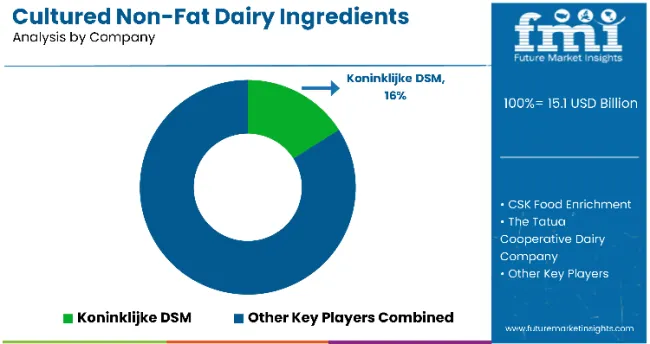
Cultured Non Fat Dairy Ingredients Market Analysis By Company

The cultured non-fat dairy ingredients market is moderately fragmented, with numerous global players competing on the basis of pricing, innovation, and distribution reach. Key companies like Koninklijke DSM, CSK Food Enrichment, and Arla Foods Ingredients Group are investing heavily in new product development and expanding their presence through strategic partnerships and acquisitions. These companies are working to provide high-quality dairy ingredients that meet the growing demand for clean-label, organic, and functional food products.

The competitive landscape is marked by significant efforts from these top suppliers to stay ahead through diversification of product portfolios, expansion into emerging markets, and increasing investment in R&D. Companies such as Cargill Incorporated and Chr.

Hansen Holding is leveraging its global distribution networks and technological advancements in fermentation to cater to the increasing demand for non-fat dairy ingredients. With growing demand for functional foods, companies are also focusing on improving the nutritional profiles of their offerings.

Recent Cultured Non-Fat Dairy Ingredients Industry News

  • Arla Foods Ingredients launched two new recipe concepts in 2024 that enable manufacturers to create cheese products with higher protein and calcium content while reducing fat. These concepts use high-quality whey proteins (Nutrilac® QU-7650 and CH-4560) and milk mineral concentrate (Capolac®), delivering essential amino acids and as much calcium as a large glass of milk per cheese slice.
  • In 2024, Chr. Hansen Holding and Novozymes announced a statutory merger, combining their strengths in natural ingredient solutions and fermentation-derived products. This merger aims to accelerate innovation in dairy cultures and enzymes, supporting the development of high-quality, functional, and clean-label cultured non-fat dairy ingredients for global food manufacturers.

Cultured Non-Fat Dairy Ingredients Market Report Scope

Report Attributes Details
Current Total Market Size (2025) USD 15.1 billion
Projected Market Size (2035) USD 23.7 billion
CAGR (2025 to 2035) 4.6%
Base Year for Estimation 2024
Historical Period 2020 to 2024
Projections Period 2025 to 2035
Market Analysis Parameters Revenue in USD billions/Volume in kilotons
By Process Natural, Artificial
By Nature Organic Compliant and Certified, Kosher Certified, Conventional
By Form Liquid, Powder
By Distribution Channel Direct Sales, Indirect Sales, Store-based Retailing, Hypermarkets/Supermarkets, Convenience Stores, Discount Stores, Independent Small Groceries, Online Retail
Regions Covered North America, Latin America, Europe, Middle East and Africa, East Asia, South Asia, Oceania
Countries Covered United States, Canada, United Kingdom, Germany, France, China, Japan, South Korea, Brazil, Australia
Key Players Koninklijke DSM, CSK Food Enrichment, The Tatua Cooperative Dairy Company, Arla Foods Ingredients Group, Cargill Incorporated, Archer Daniels Midland Company, Chr. Hansen Holding, DairyChem, Epi Ingredients, Ingredion Incorporated, Dairy Connection, Novozymes, Socius Ingredients
Additional Attributes Dollar sales by value, market share analysis by region, and country-wise analysis

Cultured Non-Fat Dairy Ingredients by Category

By Process:

  • Natural
  • Artificial

By Nature:

  • Organic Compliant and Citified
  • Kosher Certified
  • Conventional

By Form:

  • Liquid
  • Powder

By Distribution Channel:

  • Direct Sales
  • Indirect Sales
  • Store-based retailing
  • Hypermarkets/Supermarkets
  • Convenience stores
  • Discount stores
  • Independent Small Groceries
  • Online retail

By Region:

  • North America
  • Latin America
  • Europe
  • Middle East and Africa
  • East Asia
  • South Asia
  • Oceania

Frequently Asked Questions

How big is the cultured non-fat dairy ingredients market in 2025?

The global cultured non-fat dairy ingredients market is estimated to be valued at USD 15.1 billion in 2025.

What will be the size of cultured non-fat dairy ingredients market in 2035?

The market size for the cultured non-fat dairy ingredients market is projected to reach USD 23.7 billion by 2035.

How much will be the cultured non-fat dairy ingredients market growth between 2025 and 2035?

The cultured non-fat dairy ingredients market is expected to grow at a 4.6% CAGR between 2025 and 2035.

What are the key product types in the cultured non-fat dairy ingredients market?

The key product types in cultured non-fat dairy ingredients market are natural and artificial.

Which nature segment to contribute significant share in the cultured non-fat dairy ingredients market in 2025?

In terms of nature, organic compliant and citified segment to command 47.6% share in the cultured non-fat dairy ingredients market in 2025.

Table of Content

  1. Executive Summary
    • Global Market Outlook
    • Demand-side Trends
    • Supply-side Trends
    • Technology Roadmap Analysis
    • Analysis and Recommendations
  2. Market Overview
    • Market Coverage / Taxonomy
    • Market Definition / Scope / Limitations
  3. Market Background
    • Market Dynamics
      • Drivers
      • Restraints
      • Opportunity
      • Trends
    • Scenario Forecast
      • Demand in Optimistic Scenario
      • Demand in Likely Scenario
      • Demand in Conservative Scenario
    • Opportunity Map Analysis
    • Product Life Cycle Analysis
    • Supply Chain Analysis
    • Investment Feasibility Matrix
    • Value Chain Analysis
    • PESTLE and Porter’s Analysis
    • Regulatory Landscape
    • Regional Parent Market Outlook
    • Production and Consumption Statistics
    • Import and Export Statistics
  4. Global Market Analysis 2020 to 2024 and Forecast, 2025 to 2035
    • Historical Market Size Value (USD Million) Analysis, 2020 to 2024
    • Current and Future Market Size Value (USD Million) Projections, 2025 to 2035
      • Y-o-Y Growth Trend Analysis
      • Absolute $ Opportunity Analysis
  5. Global Market Pricing Analysis 2020 to 2024 and Forecast 2025 to 2035
  6. Global Market Analysis 2020 to 2024 and Forecast 2025 to 2035, By Process
    • Introduction / Key Findings
    • Historical Market Size Value (USD Million) Analysis By Process , 2020 to 2024
    • Current and Future Market Size Value (USD Million) Analysis and Forecast By Process , 2025 to 2035
      • Natural
      • Artificial
    • Y-o-Y Growth Trend Analysis By Process , 2020 to 2024
    • Absolute $ Opportunity Analysis By Process , 2025 to 2035
  7. Global Market Analysis 2020 to 2024 and Forecast 2025 to 2035, By Nature
    • Introduction / Key Findings
    • Historical Market Size Value (USD Million) Analysis By Nature, 2020 to 2024
    • Current and Future Market Size Value (USD Million) Analysis and Forecast By Nature, 2025 to 2035
      • Organic Compliant and Citified
      • Kosher Certified
      • Conventional
    • Y-o-Y Growth Trend Analysis By Nature, 2020 to 2024
    • Absolute $ Opportunity Analysis By Nature, 2025 to 2035
  8. Global Market Analysis 2020 to 2024 and Forecast 2025 to 2035, By Form
    • Introduction / Key Findings
    • Historical Market Size Value (USD Million) Analysis By Form, 2020 to 2024
    • Current and Future Market Size Value (USD Million) Analysis and Forecast By Form, 2025 to 2035
      • Liquid
      • Powder
    • Y-o-Y Growth Trend Analysis By Form, 2020 to 2024
    • Absolute $ Opportunity Analysis By Form, 2025 to 2035
  9. Global Market Analysis 2020 to 2024 and Forecast 2025 to 2035, By Distribution Channel
    • Introduction / Key Findings
    • Historical Market Size Value (USD Million) Analysis By Distribution Channel, 2020 to 2024
    • Current and Future Market Size Value (USD Million) Analysis and Forecast By Distribution Channel, 2025 to 2035
      • Direct Sales
      • Indirect Sales
      • Store-Based Retailing
      • Hypermarkets/Supermarkets
      • Convenience Stores
      • Discount Stores
      • Independent Small Groceries
      • Online Retail
    • Y-o-Y Growth Trend Analysis By Distribution Channel, 2020 to 2024
    • Absolute $ Opportunity Analysis By Distribution Channel, 2025 to 2035
  10. Global Market Analysis 2020 to 2024 and Forecast 2025 to 2035, By Region
    • Introduction
    • Historical Market Size Value (USD Million) Analysis By Region, 2020 to 2024
    • Current Market Size Value (USD Million) Analysis and Forecast By Region, 2025 to 2035
      • North America
      • Latin America
      • Western Europe
      • Eastern Europe
      • East Asia
      • South Asia and Pacific
      • Middle East & Africa
    • Market Attractiveness Analysis By Region
  11. North America Market Analysis 2020 to 2024 and Forecast 2025 to 2035, By Country
    • Historical Market Size Value (USD Million) Trend Analysis By Market Taxonomy, 2020 to 2024
    • Market Size Value (USD Million) Forecast By Market Taxonomy, 2025 to 2035
      • By Country
        • USA
        • Canada
        • Mexico
      • By Process
      • By Nature
      • By Form
      • By Distribution Channel
    • Market Attractiveness Analysis
      • By Country
      • By Process
      • By Nature
      • By Form
      • By Distribution Channel
    • Key Takeaways
  12. Latin America Market Analysis 2020 to 2024 and Forecast 2025 to 2035, By Country
    • Historical Market Size Value (USD Million) Trend Analysis By Market Taxonomy, 2020 to 2024
    • Market Size Value (USD Million) Forecast By Market Taxonomy, 2025 to 2035
      • By Country
        • Brazil
        • Chile
        • Rest of Latin America
      • By Process
      • By Nature
      • By Form
      • By Distribution Channel
    • Market Attractiveness Analysis
      • By Country
      • By Process
      • By Nature
      • By Form
      • By Distribution Channel
    • Key Takeaways
  13. Western Europe Market Analysis 2020 to 2024 and Forecast 2025 to 2035, By Country
    • Historical Market Size Value (USD Million) Trend Analysis By Market Taxonomy, 2020 to 2024
    • Market Size Value (USD Million) Forecast By Market Taxonomy, 2025 to 2035
      • By Country
        • Germany
        • UK
        • Italy
        • Spain
        • France
        • Nordic
        • BENELUX
        • Rest of Western Europe
      • By Process
      • By Nature
      • By Form
      • By Distribution Channel
    • Market Attractiveness Analysis
      • By Country
      • By Process
      • By Nature
      • By Form
      • By Distribution Channel
    • Key Takeaways
  14. Eastern Europe Market Analysis 2020 to 2024 and Forecast 2025 to 2035, By Country
    • Historical Market Size Value (USD Million) Trend Analysis By Market Taxonomy, 2020 to 2024
    • Market Size Value (USD Million) Forecast By Market Taxonomy, 2025 to 2035
      • By Country
        • Russia
        • Poland
        • Hungary
        • Balkan & Baltic
        • Rest of Eastern Europe
      • By Process
      • By Nature
      • By Form
      • By Distribution Channel
    • Market Attractiveness Analysis
      • By Country
      • By Process
      • By Nature
      • By Form
      • By Distribution Channel
    • Key Takeaways
  15. East Asia Market Analysis 2020 to 2024 and Forecast 2025 to 2035, By Country
    • Historical Market Size Value (USD Million) Trend Analysis By Market Taxonomy, 2020 to 2024
    • Market Size Value (USD Million) Forecast By Market Taxonomy, 2025 to 2035
      • By Country
        • China
        • Japan
        • South Korea
      • By Process
      • By Nature
      • By Form
      • By Distribution Channel
    • Market Attractiveness Analysis
      • By Country
      • By Process
      • By Nature
      • By Form
      • By Distribution Channel
    • Key Takeaways
  16. South Asia and Pacific Market Analysis 2020 to 2024 and Forecast 2025 to 2035, By Country
    • Historical Market Size Value (USD Million) Trend Analysis By Market Taxonomy, 2020 to 2024
    • Market Size Value (USD Million) Forecast By Market Taxonomy, 2025 to 2035
      • By Country
        • India
        • ASEAN
        • Australia & New Zealand
        • Rest of South Asia and Pacific
      • By Process
      • By Nature
      • By Form
      • By Distribution Channel
    • Market Attractiveness Analysis
      • By Country
      • By Process
      • By Nature
      • By Form
      • By Distribution Channel
    • Key Takeaways
  17. Middle East & Africa Market Analysis 2020 to 2024 and Forecast 2025 to 2035, By Country
    • Historical Market Size Value (USD Million) Trend Analysis By Market Taxonomy, 2020 to 2024
    • Market Size Value (USD Million) Forecast By Market Taxonomy, 2025 to 2035
      • By Country
        • Kingdom of Saudi Arabia
        • Other GCC Countries
        • Turkiye
        • South Africa
        • Other African Union
        • Rest of Middle East & Africa
      • By Process
      • By Nature
      • By Form
      • By Distribution Channel
    • Market Attractiveness Analysis
      • By Country
      • By Process
      • By Nature
      • By Form
      • By Distribution Channel
    • Key Takeaways
  18. Key Countries Market Analysis
    • USA
      • Pricing Analysis
      • Market Share Analysis, 2024
        • By Process
        • By Nature
        • By Form
        • By Distribution Channel
    • Canada
      • Pricing Analysis
      • Market Share Analysis, 2024
        • By Process
        • By Nature
        • By Form
        • By Distribution Channel
    • Mexico
      • Pricing Analysis
      • Market Share Analysis, 2024
        • By Process
        • By Nature
        • By Form
        • By Distribution Channel
    • Brazil
      • Pricing Analysis
      • Market Share Analysis, 2024
        • By Process
        • By Nature
        • By Form
        • By Distribution Channel
    • Chile
      • Pricing Analysis
      • Market Share Analysis, 2024
        • By Process
        • By Nature
        • By Form
        • By Distribution Channel
    • Germany
      • Pricing Analysis
      • Market Share Analysis, 2024
        • By Process
        • By Nature
        • By Form
        • By Distribution Channel
    • UK
      • Pricing Analysis
      • Market Share Analysis, 2024
        • By Process
        • By Nature
        • By Form
        • By Distribution Channel
    • Italy
      • Pricing Analysis
      • Market Share Analysis, 2024
        • By Process
        • By Nature
        • By Form
        • By Distribution Channel
    • Spain
      • Pricing Analysis
      • Market Share Analysis, 2024
        • By Process
        • By Nature
        • By Form
        • By Distribution Channel
    • France
      • Pricing Analysis
      • Market Share Analysis, 2024
        • By Process
        • By Nature
        • By Form
        • By Distribution Channel
    • India
      • Pricing Analysis
      • Market Share Analysis, 2024
        • By Process
        • By Nature
        • By Form
        • By Distribution Channel
    • ASEAN
      • Pricing Analysis
      • Market Share Analysis, 2024
        • By Process
        • By Nature
        • By Form
        • By Distribution Channel
    • Australia & New Zealand
      • Pricing Analysis
      • Market Share Analysis, 2024
        • By Process
        • By Nature
        • By Form
        • By Distribution Channel
    • China
      • Pricing Analysis
      • Market Share Analysis, 2024
        • By Process
        • By Nature
        • By Form
        • By Distribution Channel
    • Japan
      • Pricing Analysis
      • Market Share Analysis, 2024
        • By Process
        • By Nature
        • By Form
        • By Distribution Channel
    • South Korea
      • Pricing Analysis
      • Market Share Analysis, 2024
        • By Process
        • By Nature
        • By Form
        • By Distribution Channel
    • Russia
      • Pricing Analysis
      • Market Share Analysis, 2024
        • By Process
        • By Nature
        • By Form
        • By Distribution Channel
    • Poland
      • Pricing Analysis
      • Market Share Analysis, 2024
        • By Process
        • By Nature
        • By Form
        • By Distribution Channel
    • Hungary
      • Pricing Analysis
      • Market Share Analysis, 2024
        • By Process
        • By Nature
        • By Form
        • By Distribution Channel
    • Kingdom of Saudi Arabia
      • Pricing Analysis
      • Market Share Analysis, 2024
        • By Process
        • By Nature
        • By Form
        • By Distribution Channel
    • Turkiye
      • Pricing Analysis
      • Market Share Analysis, 2024
        • By Process
        • By Nature
        • By Form
        • By Distribution Channel
    • South Africa
      • Pricing Analysis
      • Market Share Analysis, 2024
        • By Process
        • By Nature
        • By Form
        • By Distribution Channel
  19. Market Structure Analysis
    • Competition Dashboard
    • Competition Benchmarking
    • Market Share Analysis of Top Players
      • By Regional
      • By Process
      • By Nature
      • By Form
      • By Distribution Channel
  20. Competition Analysis
    • Competition Deep Dive
      • Koninklijke DSM
        • Overview
        • Product Portfolio
        • Profitability by Market Segments (Product/Age /Sales Channel/Region)
        • Sales Footprint
        • Strategy Overview
          • Marketing Strategy
          • Product Strategy
          • Channel Strategy
      • CSK Food Enrichment
      • The Tatua Cooperative Dairy Company
      • Arla Foods Ingredients Group
      • Cargill Incorporated
      • Archer Daniels Midland Company
      • Chr. Hansen Holding
      • DairyChem
      • Epi Ingredients
      • Ingredion Incorporated
      • Dairy Connection
      • Novozymes
      • Socius Ingredients
  21. Assumptions & Acronyms Used
  22. Research Methodology

List of Tables

  • Table 1: Global Market Value (USD Million) Forecast by Region, 2020-2035
  • Table 2: Global Market Value (USD Million) Forecast by Process , 2020-2035
  • Table 3: Global Market Value (USD Million) Forecast by Nature, 2020-2035
  • Table 4: Global Market Value (USD Million) Forecast by Form, 2020-2035
  • Table 5: Global Market Value (USD Million) Forecast by Distribution Channel, 2020-2035
  • Table 6: North America Market Value (USD Million) Forecast by Country, 2020-2035
  • Table 7: North America Market Value (USD Million) Forecast by Process , 2020-2035
  • Table 8: North America Market Value (USD Million) Forecast by Nature, 2020-2035
  • Table 9: North America Market Value (USD Million) Forecast by Form, 2020-2035
  • Table 10: North America Market Value (USD Million) Forecast by Distribution Channel, 2020-2035
  • Table 11: Latin America Market Value (USD Million) Forecast by Country, 2020-2035
  • Table 12: Latin America Market Value (USD Million) Forecast by Process , 2020-2035
  • Table 13: Latin America Market Value (USD Million) Forecast by Nature, 2020-2035
  • Table 14: Latin America Market Value (USD Million) Forecast by Form, 2020-2035
  • Table 15: Latin America Market Value (USD Million) Forecast by Distribution Channel, 2020-2035
  • Table 16: Western Europe Market Value (USD Million) Forecast by Country, 2020-2035
  • Table 17: Western Europe Market Value (USD Million) Forecast by Process , 2020-2035
  • Table 18: Western Europe Market Value (USD Million) Forecast by Nature, 2020-2035
  • Table 19: Western Europe Market Value (USD Million) Forecast by Form, 2020-2035
  • Table 20: Western Europe Market Value (USD Million) Forecast by Distribution Channel, 2020-2035
  • Table 21: Eastern Europe Market Value (USD Million) Forecast by Country, 2020-2035
  • Table 22: Eastern Europe Market Value (USD Million) Forecast by Process , 2020-2035
  • Table 23: Eastern Europe Market Value (USD Million) Forecast by Nature, 2020-2035
  • Table 24: Eastern Europe Market Value (USD Million) Forecast by Form, 2020-2035
  • Table 25: Eastern Europe Market Value (USD Million) Forecast by Distribution Channel, 2020-2035
  • Table 26: East Asia Market Value (USD Million) Forecast by Country, 2020-2035
  • Table 27: East Asia Market Value (USD Million) Forecast by Process , 2020-2035
  • Table 28: East Asia Market Value (USD Million) Forecast by Nature, 2020-2035
  • Table 29: East Asia Market Value (USD Million) Forecast by Form, 2020-2035
  • Table 30: East Asia Market Value (USD Million) Forecast by Distribution Channel, 2020-2035
  • Table 31: South Asia and Pacific Market Value (USD Million) Forecast by Country, 2020-2035
  • Table 32: South Asia and Pacific Market Value (USD Million) Forecast by Process , 2020-2035
  • Table 33: South Asia and Pacific Market Value (USD Million) Forecast by Nature, 2020-2035
  • Table 34: South Asia and Pacific Market Value (USD Million) Forecast by Form, 2020-2035
  • Table 35: South Asia and Pacific Market Value (USD Million) Forecast by Distribution Channel, 2020-2035
  • Table 36: Middle East & Africa Market Value (USD Million) Forecast by Country, 2020-2035
  • Table 37: Middle East & Africa Market Value (USD Million) Forecast by Process , 2020-2035
  • Table 38: Middle East & Africa Market Value (USD Million) Forecast by Nature, 2020-2035
  • Table 39: Middle East & Africa Market Value (USD Million) Forecast by Form, 2020-2035
  • Table 40: Middle East & Africa Market Value (USD Million) Forecast by Distribution Channel, 2020-2035

List of Figures

  • Figure 1: Global Market Pricing Analysis
  • Figure 2: Global Market Value (USD Million) Forecast 2020-2035
  • Figure 3: Global Market Value (USD Million) Share and BPS Analysis by Region, 2025 and 2035
  • Figure 4: Global Market Y-o-Y Growth Comparison by Region, 2025-2035
  • Figure 5: Global Market Attractiveness Analysis by Region
  • Figure 6: North America Market Incremental Dollar Opportunity, 2025-2035
  • Figure 7: Latin America Market Incremental Dollar Opportunity, 2025-2035
  • Figure 8: Western Europe Market Incremental Dollar Opportunity, 2025-2035
  • Figure 9: Eastern Europe Market Incremental Dollar Opportunity, 2025-2035
  • Figure 10: East Asia Market Incremental Dollar Opportunity, 2025-2035
  • Figure 11: South Asia and Pacific Market Incremental Dollar Opportunity, 2025-2035
  • Figure 12: Middle East & Africa Market Incremental Dollar Opportunity, 2025-2035
  • Figure 13: North America Market Value Share and BPS Analysis by Country, 2025 and 2035
  • Figure 14: Latin America Market Value Share and BPS Analysis by Country, 2025 and 2035
  • Figure 15: Western Europe Market Value Share and BPS Analysis by Country, 2025 and 2035
  • Figure 16: Eastern Europe Market Value Share and BPS Analysis by Country, 2025 and 2035
  • Figure 17: East Asia Market Value Share and BPS Analysis by Country, 2025 and 2035
  • Figure 18: South Asia and Pacific Market Value Share and BPS Analysis by Country, 2025 and 2035
  • Figure 19: Middle East & Africa Market Value Share and BPS Analysis by Country, 2025 and 2035
  • Figure 20: Global Market - Tier Structure Analysis
  • Figure 21: Global Market - Company Share Analysis
Dashboard
Dashboard
Dashboard
Dashboard
Dashboard
Dashboard

Full Research Suite comprises of:

Market outlook & trends analysis

Market outlook & trends analysis

Interviews & case studies

Interviews & case studies

Strategic recommendations

Strategic recommendations

Vendor profiles & capabilities analysis

Vendor profiles & capabilities analysis

5-year forecasts

5-year forecasts

8 regions and 60+ country-level data splits

8 regions and 60+ country-level data splits

Market segment data splits

Market segment data splits

12 months of continuous data updates

12 months of continuous data updates

DELIVERED AS:

PDF EXCEL ONLINE

Full Research Suite


$3500

$5000

$6500

Buy Report Now
Similar Industry Reports

Similar Industry Reports

Cultured Wheat Market

Cultured Wheat Market Analysis - Size, Share, and Forecast Outlook 2025 to 2035

Cultured Meat Market

Cultured Meat Market Insights - Lab-Grown Innovation & Market Expansion 2025 to 2035

Cultured Wheat Flour Market

Cultured Wheat Flour Market Analysis by Bread, Bakery Products, Pasta, and Others Through 2035

Cultured Wheat Market Share Analysis

Market Share Distribution Among Cultured Wheat Manufacturers

Cultured Buttermilk Market

Cultured Buttermilk Market Insights - Size, Share & Growth Forecast 2025-2035

Cultured Dairy Product Market

Cultured Dairy Product Market Size and Share Forecast Outlook 2025 to 2035

Cultured Dairy Blends Market

Cultured Dairy Blends Market

UK Cultured Wheat Market

UK Cultured Wheat Market Analysis – Size, Share & Forecast 2025–2035

ASEAN Cultured Wheat Market

ASEAN Cultured Wheat Market Report – Trends, Demand & Industry Forecast 2025–2035

Tissue Cultured Date Palm Market

Tissue Cultured Date Palm Market Trends – Growth & Industry Forecast 2024 to 2034

Australia Cultured Wheat Market

Australia Cultured Wheat Market Report – Growth, Demand & Innovations 2025-2035

Naturally Cultured Beverages Market

Naturally Cultured Beverages Market

Latin America Cultured Wheat Market

Latin America Cultured Wheat Market Outlook – Growth, Demand & Forecast 2025–2035

Ingredients Market for Plant-based Food & Beverages

Ingredients Market for Plant-based Food & Beverages Size and Share Forecast Outlook 2025 to 2035

Bean Ingredients Market

Bean Ingredients Market Size and Share Forecast Outlook 2025 to 2035

Milk Ingredients Market

Milk Ingredients Market Analysis - Size, Share, and Forecast Outlook 2025 to 2035

Malt Ingredients Market

Malt Ingredients Market Analysis by Raw Material, Product Type, Grade, End-use, and Region through 2035

Aroma Ingredients Market

Aroma Ingredients Market Size and Share Forecast Outlook 2025 to 2035

Pulse Ingredients Market

Pulse Ingredients Market Analysis – Size, Share, and Forecast 2025 to 2035

Smoke Ingredients for Food Market

Smoke Ingredients for Food Market Analysis - Size, Share & Forecast 2025 to 2035

Future Market Insights

Cultured Non-Fat Dairy Ingredients Market

Chat With MaRIA

Chat With

MaRIA

Hi There, I am MaRIA, Your Market Research Intelligence Assistant. How may I help you?