Dairy Containers Market
Market Insights on Dairy Containers covering sales outlook, demand forecast & up-to-date key trends
Dairy Containers Market by Raw Material, Product, Application & Region - Forecast 2022 - 2032
Dairy Containers Market Overview (2022-2032)
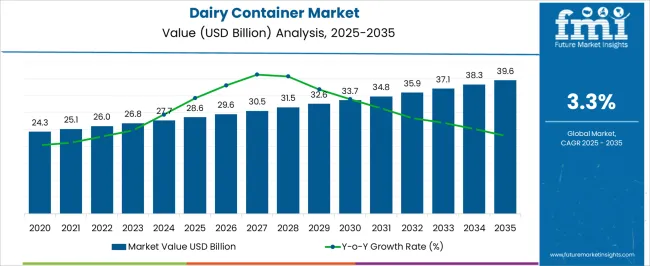
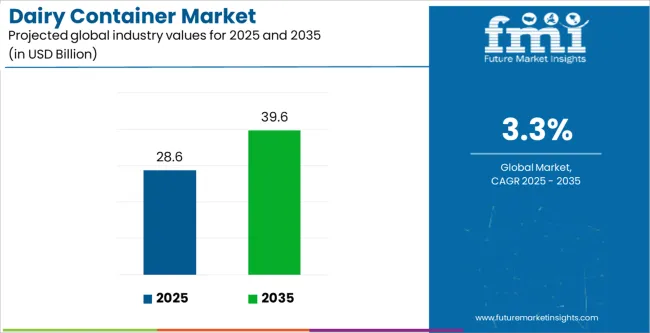
[250 Pages Report] The global dairy containers market size is expected to reach US$ 66.4 Billion in 2022 and exhibit growth at a CAGR of 5.1% in the forecast period from 2022 to 2032. It is anticipated to be valued at US$ 81.6 Billion in 2032. The rising consumer preference towards butter, ice-cream, and yogurt is likely to drive the sales of dairy containers in the near future.
Report Attribute |
Details |
Dairy Containers Market Estimated Base Year Value (2021) |
US$ 65.1 Billion |
Dairy Containers Market Expected Market Value (2022) |
US$ 66.4 Billion |
Dairy Containers Market Anticipated Forecast Value (2032) |
US$ 81.6 Billion |
Dairy Containers Market Projected Growth Rate (2022-2032) |
5.1% CAGR |
Packaging provides various benefits, such as security, information, and protection to the content. Several manufacturers worldwide are aiming to deliver unique packaging to consumers so that the products are in perfect condition.
The growing preference for transparent packaging providing detailed information about the ingredients, production process, and product content is expected to boost the market. The dairy packaging industry is anticipated to exhibit advanced packaging technologies as per the convenience and requirements of consumers.
The increasing concerns about food safety and quality are likely to result in the high demand for novel packaging. As dairy products have very short shelf life, packaging plays a crucial role in their distribution.
Effective packaging is capable of preventing contamination and helpful in transportation, as well as storage. Spurred by the aforementioned factors, the dairy containers market size is set to expand in the evaluation period.
Let us know your requirement to get
100% FREE customization
Which are Some Prominent Drivers Spearheading Dairy Containers Market Growth?
The high demand from consumers for cost-effective, sustainable, and convenient packaging solutions is anticipated to propel the demand for dairy containers in the upcoming years. The dairy packaging sector is likely to evolve and grow at a rapid pace owing to the surging demand for dairy products worldwide.
The rising number of awareness programs about food safety conducted by government bodies is compelling dairy processors to pack their products in innovative packaging formats, including dairy containers. In addition, the increasing per capita milk consumption, expansion of the modern retail sector, and rising disposable income are some of the other factors that are expected to augur well for the market.
What are the Challenges Faced by the Dairy Containers Industry?
The increasing usage of plastic and various other non-biodegradable packaging materials in dairy containers is expected to raise concerns among manufacturers and consumers globally. Governments of numerous countries are also implementing strict norms to ban the usage of plastic in food packaging solutions to protect the environment. These factors may hamper the global dairy containers market growth in the forthcoming years.
Find your sweet spots for generating winning opportunities in this market.
Talk to AnalystWhy is Asia Pacific Emerging as an Opportunistic Dairy Containers Market?
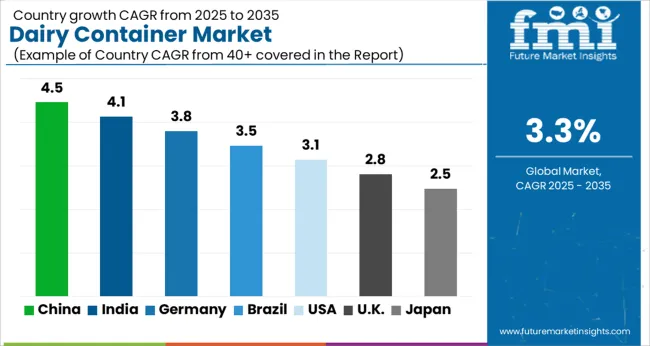
The ever-increasing population and the rising consumption of dairy products in emerging economies, such as China and India is projected to bode well for the Asia Pacific dairy containers market share in the future years. The high popularity of smaller multipacks for the storage of cheese and yogurt in these countries is another vital factor that is set to drive the market.
Governments of various developing countries are aiming to support the dairy industry by providing monetary assistance, as well as conducting awareness programs. For instance, in February 2022, the 3rd DFA - All India and International Dairy and Agri Expo 2022 was organized in Haryana. Many companies showcased their new agricultural machines and livestock animals in this fair. Thus, the rising number of similar other expos in India is likely to fuel the Asia Pacific market.
How is North America Contributing to Growth of the Dairy Containers Market?
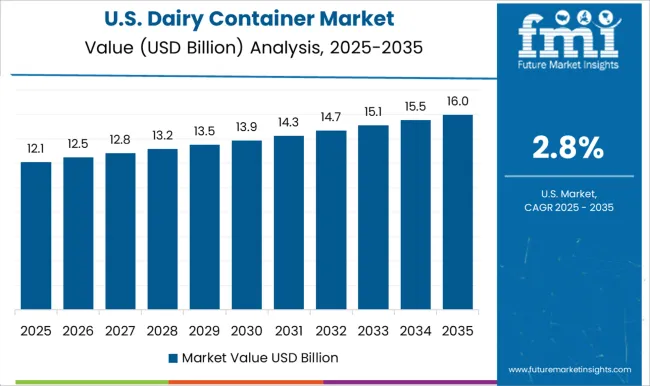
The increasing sales and production of dairy products, such as yogurt, cheese, and milk in the U.S. and Canada is anticipated to bolster the North America dairy containers market growth in the assessment period. The surging consumption of mozzarella, provolone, and parmesan cheese in these countries is anticipated to spur the market.
The rising popularity of packaged food and the rapidly changing economic scenarios are estimated to affect the North America market positively. The ongoing expansion of the dairy product portfolio by numerous key players, especially into sports nutrition is also projected to bode well for the market.

An unified Market Research Subscription Platform, built for today’s disparate research needs.
Market Competition
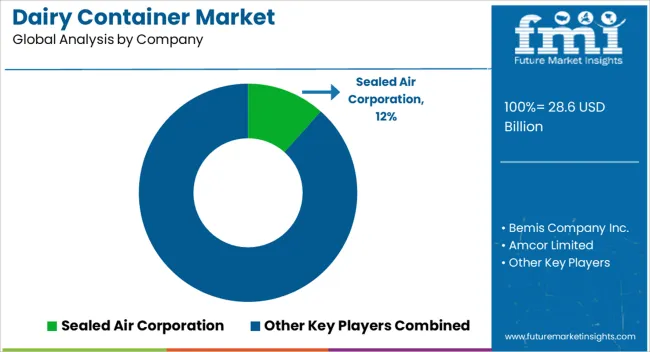
Some of the leading companies present in the global dairy containers market include Sealed Air Corporation, Bemis Company Inc., Amcor Limited, Huhtamaki, Tetra Pak International S.A., WestRock Company, Berry Global Group, Inc., Mondi Group, and Nampak Ltd, Ball Corporation among others.
Leading manufacturers are increasingly focusing on the development of convenient and attractive packaging solutions for various dairy products to generate more sales. Meanwhile, some of the other key players are engaging in the manufacturing of tailor-made solutions to fulfill the high unmet need for specific features from customers.
Report Scope
Report Attribute |
Details |
Growth Rate |
CAGR of 5.1% from 2022 to 2032 |
Base Year for Estimation |
2021 |
Historical Data |
2015-2020 |
Forecast Period |
2022-2032 |
Quantitative Units |
Revenue in USD Million and CAGR from 2022-2032 |
Report Coverage |
Revenue Forecast, Volume Forecast, Company Ranking, Competitive Landscape, Growth Factors, Trends and Pricing Analysis |
Segments Covered |
|
Regions Covered |
|
Key Countries Profiled |
|
Key Companies Profiled |
|
Customization |
Available Upon Request |
Key Segments Profiled in the Dairy Containers Industry Survey
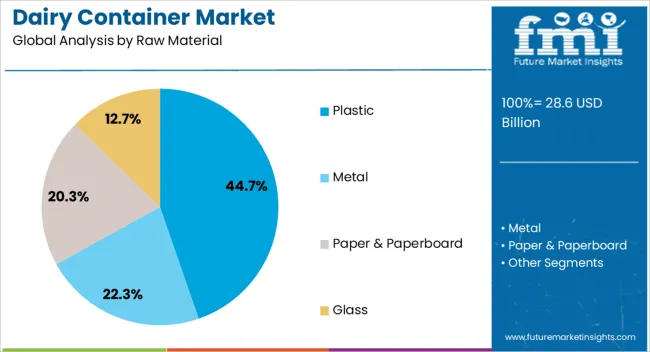
By Raw Material:
- Metal
- Paper & Paperboard
- Plastic
- Glass
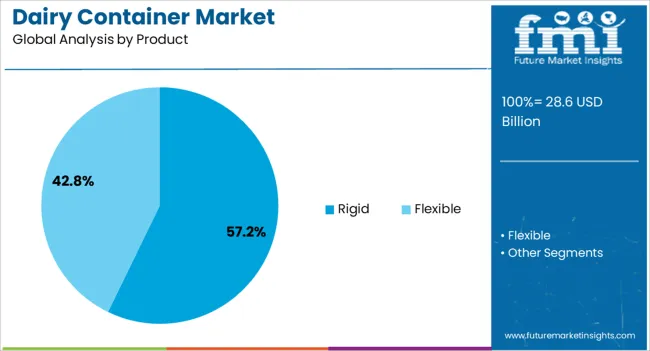
By Product:
- Flexible
- Rigid
By Application:
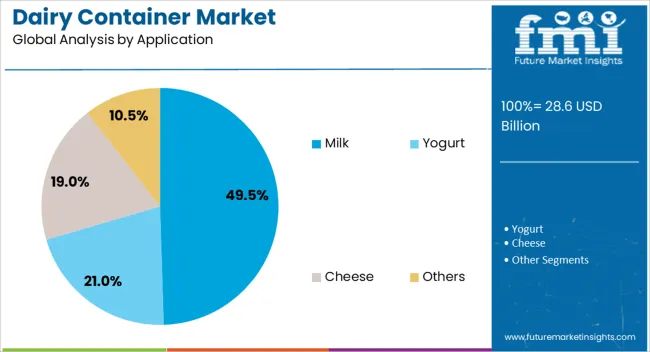
- Yogurt
- Milk
- Cheese
- Others
By Region:
- North America
- Latin America
- Western Europe
- Eastern Europe
- APEJ
- Japan
- Middle East and Africa
Frequently Asked Questions
The global dairy containers market is projected to be valued at US$ 81.6 Billion by 2032.
Asia Pacific is expected to be the most opportunistic dairy containers market, expanding at a 5% CAGR.
Sealed Air Corporation, Bemis Company Inc., Amcor Limited, Huhtamaki, Tetra Pak International S.A., and WestRock Company are some of the prominent manufacturers of dairy containers.
1. Executive Summary
1.1. Global Market Outlook
1.2. Demand-side Trends
1.3. Supply-side Trends
1.4. Technology Roadmap Analysis
1.5. Analysis and Recommendations
2. Market Overview
2.1. Market Coverage / Taxonomy
2.2. Market Definition / Scope / Limitations
3. Market Background
3.1. Market Dynamics
3.1.1. Drivers
3.1.2. Restraints
3.1.3. Opportunity
3.1.4. Trends
3.2. Impact of Covid-19
3.2.1. Demand in Optimistic Scenario
3.2.2. Demand in Likely Scenario
3.2.3. Demand in Conservative Scenario
3.3. Macro Factors and Forecast Factors
3.4. Value Chain Analysis
3.4.1. Profit Margin Analysis
3.4.2. Raw Material Suppliers
3.4.3. Manufacturers, Wholesalers and Distributors
3.4.4. End Users/ Customers
3.5. Regional Parent Market Outlook
3.6. Production and Consumption Statistics
3.7. Global Average Pricing Analysis Benchmark
4. Global Dairy Containers Market Analysis 2015-2021 and Forecast, 2022-2032
4.1. Historical Market Size Value (US$ Mn) & Volume (Units) Analysis, 2015-2021
4.2. Current and Future Market Size Value (US$ Mn) & Volume (Units) Projections, 2022-2032
4.2.1. Y-o-Y Growth Trend Analysis
4.2.2. Absolute $ Opportunity Analysis
5. Global Dairy Containers Market Analysis 2015–2021 and Forecast 2022–2032, By Material
5.1. Introduction / Key Findings
5.2. Historical Market Size Value (US$ Mn) & Volume (Units) Analysis By Material, 2015-2021
5.3. Current and Future Market Size Value (US$ Mn) & Volume (Units) Analysis and Forecast By Material, 2022-2032
5.3.1. Plastic
5.3.2. Paper & Paperboard
5.3.3. Glass
5.3.4. Metal
5.4. Y-o-Y Growth Trend Analysis By Material, 2015-2021
5.5. Absolute $ Opportunity Analysis By Material, 2022-2032
6. Global Dairy Containers Market Analysis 2015–2021 and Forecast 2022–2032, By Product Type
6.1. Introduction / Key Findings
6.2. Historical Market Size Value (US$ Mn) & Volume (Units) Analysis By Product Type, 2015-2021
6.3. Current and Future Market Size Value (US$ Mn) & Volume (Units) Analysis and Forecast By Product Type, 2022-2032
6.3.1. Bottles & Jars
6.3.2. Cans
6.3.3. Clamshells
6.3.4. Cartons & Boxes
6.4. Y-o-Y Growth Trend Analysis By Product Type, 2015-2021
6.5. Absolute $ Opportunity Analysis By Product Type, 2022-2032
7. Global Dairy Containers Market Analysis 2015–2021 and Forecast 2022–2032, By Application
7.1. Introduction / Key Findings
7.2. Historical Market Size Value (US$ Mn) & Volume (Units) Analysis By Application, 2015-2021
7.3. Current and Future Market Size Value (US$ Mn) & Volume (Units) Analysis and Forecast By Application, 2022-2032
7.3.1. Milk
7.3.2. Butter & Ghee
7.3.3. Cheese
7.3.4. Cream
7.3.5. Yogurt
7.3.6. Frozen Products
7.3.7. Ice-cream
7.4. Y-o-Y Growth Trend Analysis By Application, 2015-2021
7.5. Absolute $ Opportunity Analysis By Application, 2022-2032
8. Global Dairy Containers Market Analysis 2015–2021 and Forecast 2022–2032, By Region
8.1. Introduction / Key Findings
8.2. Historical Market Size Value (US$ Mn) & Volume (Units) Analysis By Region, 2015-2021
8.3. Current and Future Market Size Value (US$ Mn) & Volume (Units) Analysis and Forecast By Region, 2022-2032
8.3.1. North America
8.3.2. Latin America
8.3.3. Europe
8.3.4. East Asia
8.3.5. South Asia
8.3.6. Oceania
8.3.7. Middle East and Africa (MEA)
8.4. Market Attractiveness Analysis, by Region
9. North America Dairy Containers Market Analysis 2015–2021 and Forecast 2022–2032, By Country
9.1. Historical Market Size Value (US$ Mn) & Volume (Units) Trend Analysis By Market Taxonomy, 2015-2021
9.2. Market Size Value (US$ Mn) & Volume (Units) Forecast By Market Taxonomy, 2022-2032
9.2.1. By Country
9.2.1.1. U.S.
9.2.1.2. Canada
9.2.2. By Material
9.2.3. By Product Type
9.2.4. By Application
9.3. Market Attractiveness Analysis
9.3.1. By Country
9.3.2. By Material
9.3.3. By Product Type
9.3.4. By Application
9.4. Key Takeaways
10. Latin America Dairy Containers Market Analysis 2015–2021 and Forecast 2022–2032, By Country
10.1. Historical Market Size Value (US$ Mn) & Volume (Units) Trend Analysis By Market Taxonomy, 2015-2021
10.2. Market Size Value (US$ Mn) & Volume (Units) Forecast By Market Taxonomy, 2022-2032
10.2.1. By Country
10.2.1.1. Brazil
10.2.1.2. Mexico
10.2.1.3. Argentina
10.2.1.4. Chile
10.2.1.5. Peru
10.2.1.6. Rest of Latin America
10.2.2. By Material
10.2.3. By Product Type
10.2.4. By Application
10.3. Market Attractiveness Analysis
10.3.1. By Country
10.3.2. By Material
10.3.3. By Product Type
10.3.4. By Application
10.4. Key Takeaways
11. Europe Dairy Containers Market Analysis 2015–2021 and Forecast 2022–2032, By Country
11.1. Historical Market Size Value (US$ Mn) & Volume (Units) Trend Analysis By Market Taxonomy, 2015-2021
11.2. Market Size Value (US$ Mn) & Volume (Units) Forecast By Market Taxonomy, 2022-2032
11.2.1. By Country
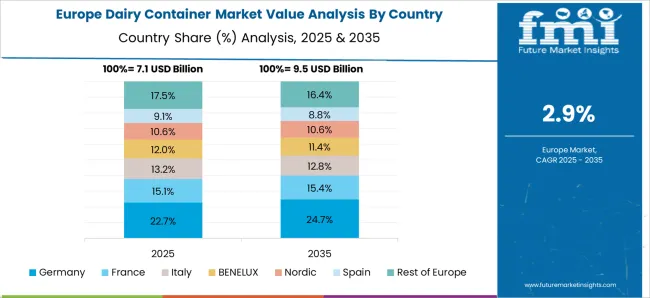
11.2.1.1. Germany
11.2.1.2. Italy
11.2.1.3. France
11.2.1.4. U.K.
11.2.1.5. Spain
11.2.1.6. BENELUX
11.2.1.7. Nordic
11.2.1.8. Russia
11.2.1.9. Poland
11.2.1.10. Rest of Europe
11.2.2. By Material
11.2.3. By Product Type
11.2.4. By Application
11.3. Market Attractiveness Analysis
11.3.1. By Country
11.3.2. By Material
11.3.3. By Product Type
11.3.4. By Application
11.4. Key Takeaways
12. East Asia Dairy Containers Market Analysis 2015–2021 and Forecast 2022–2032, By Country
12.1. Historical Market Size Value (US$ Mn) & Volume (Units) Trend Analysis By Market Taxonomy, 2015-2021
12.2. Market Size Value (US$ Mn) & Volume (Units) Forecast By Market Taxonomy, 2022-2032
12.2.1. By Country
12.2.1.1. China
12.2.1.2. Japan
12.2.1.3. South Korea
12.2.2. By Material
12.2.3. By Product Type
12.2.4. By Application
12.3. Market Attractiveness Analysis
12.3.1. By Country
12.3.2. By Material
12.3.3. By Product Type
12.3.4. By Application
12.4. Key Takeaways
13. South Asia Dairy Containers Market Analysis 2015–2021 and Forecast 2022–2032, By Country
13.1. Historical Market Size Value (US$ Mn) & Volume (Units) Trend Analysis By Market Taxonomy, 2015-2021
13.2. Market Size Value (US$ Mn) & Volume (Units) Forecast By Market Taxonomy, 2022-2032
13.2.1. By Country
13.2.1.1. India
13.2.1.2. Thailand
13.2.1.3. Malaysia
13.2.1.4. Indonesia
13.2.1.5. Rest of South Asia
13.2.2. By Material
13.2.3. By Product Type
13.2.4. By Application
13.3. Market Attractiveness Analysis
13.3.1. By Country
13.3.2. By Material
13.3.3. By Product Type
13.3.4. By Application
13.4. Key Takeaways
14. Oceania Dairy Containers Market Analysis 2015–2021 and Forecast 2022–2032, By Country
14.1. Historical Market Size Value (US$ Mn) & Volume (Units) Trend Analysis By Market Taxonomy, 2015-2021
14.2. Market Size Value (US$ Mn) & Volume (Units) Forecast By Market Taxonomy, 2022-2032
14.2.1. By Country
14.2.1.1. Australia
14.2.1.2. New Zealand
14.2.2. By Material
14.2.3. By Product Type
14.2.4. By Application
14.3. Market Attractiveness Analysis
14.3.1. By Country
14.3.2. By Material
14.3.3. By Product Type
14.3.4. By Application
14.4. Key Takeaways
15. Middle East & Africa Dairy Containers Market Analysis 2015–2021 and Forecast 2022–2032, By Country
15.1. Historical Market Size Value (US$ Mn) & Volume (Units) Trend Analysis By Market Taxonomy, 2015-2021
15.2. Market Size Value (US$ Mn) & Volume (Units) Forecast By Market Taxonomy, 2022-2032
15.2.1. By Country
15.2.1.1. GCC Countries
15.2.1.2. Turkey
15.2.1.3. Northern Africa
15.2.1.4. South Africa
15.2.1.5. Rest of MEA
15.2.2. By Material
15.2.3. By Product Type
15.2.4. By Application
15.3. Market Attractiveness Analysis
15.3.1. By Country
15.3.2. By Material
15.3.3. By Product Type
15.3.4. By Application
15.4. Key Takeaways
16. Country wise Dairy Containers Market Analysis
16.1. United States (U.S.)
16.1.1. Market Share Analysis, 2022
16.1.2. By Material
16.1.3. By Product Type
16.1.4. By Application
16.2. Canada
16.2.1. Market Share Analysis, 2022
16.2.2. By Material
16.2.3. By Product Type
16.2.4. By Application
16.3. Brazil
16.3.1. Market Share Analysis, 2022
16.3.2. By Material
16.3.3. By Product Type
16.3.4. By Application
16.4. Mexico
16.4.1. Market Share Analysis, 2022
16.4.2. By Material
16.4.3. By Product Type
16.4.4. By Application
16.5. Germany
16.5.1. Market Share Analysis, 2022
16.5.2. By Material
16.5.3. By Product Type
16.5.4. By Application
16.6. Italy
16.6.1. Market Share Analysis, 2022
16.6.2. By Material
16.6.3. By Product Type
16.6.4. By Application
16.7. France
16.7.1. Market Share Analysis, 2022
16.7.2. By Material
16.7.3. By Product Type
16.7.4. By Application
16.8. Spain
16.8.1. Market Share Analysis, 2022
16.8.2. By Material
16.8.3. By Product Type
16.8.4. By Application
16.9. U.K.
16.9.1. Market Share Analysis, 2022
16.9.2. By Material
16.9.3. By Product Type
16.9.4. By Application
16.10. Russia
16.10.1. Market Share Analysis, 2022
16.10.2. By Material
16.10.3. By Product Type
16.10.4. By Application
16.11. China
16.11.1. Market Share Analysis, 2022
16.11.2. By Material
16.11.3. By Product Type
16.11.4. By Application
16.12. Japan
16.12.1. Market Share Analysis, 2022
16.12.2. By Material
16.12.3. By Product Type
16.12.4. By Application
16.13. India
16.13.1. Market Share Analysis, 2022
16.13.2. By Material
16.13.3. By Product Type
16.13.4. By Application
16.14. GCC Countries
16.14.1. Market Share Analysis, 2022
16.14.2. By Material
16.14.3. By Product Type
16.14.4. By Application
16.15. Australia
16.15.1. Market Share Analysis, 2022
16.15.2. By Material
16.15.3. By Product Type
16.15.4. By Application
17. Market Structure Analysis
17.1. Competition Dashboard
17.2. Competition Benchmarking
17.3. Market Share Analysis of Top Players
17.3.1. By Region
17.3.2. By Product Portfolio
18. Competition Analysis
18.1. Competition Deep Dive
18.1.1. Nampak Ltd.
18.1.1.1. Overview
18.1.1.2. Product Portfolio
18.1.1.3. Profitability by Market Segments (Product/Channel/Region)
18.1.1.4. Sales Footprint
18.1.1.5. Strategy Overview
18.1.1.5.1. Marketing Strategy
18.1.1.5.2. Product Strategy
18.1.1.5.3. Channel Strategy
18.1.2. Mondi group
18.1.2.1. Overview
18.1.2.2. Product Portfolio
18.1.2.3. Profitability by Market Segments (Product/Channel/Region)
18.1.2.4. Sales Footprint
18.1.2.5. Strategy Overview
18.1.2.5.1. Marketing Strategy
18.1.2.5.2. Product Strategy
18.1.2.5.3. Channel Strategy
18.1.3. Berry Global Group, Inc.
18.1.3.1. Overview
18.1.3.2. Product Portfolio
18.1.3.3. Profitability by Market Segments (Product/Channel/Region)
18.1.3.4. Sales Footprint
18.1.3.5. Strategy Overview
18.1.3.5.1. Marketing Strategy
18.1.3.5.2. Product Strategy
18.1.3.5.3. Channel Strategy
18.1.4. WestRock Company
18.1.4.1. Overview
18.1.4.2. Product Portfolio
18.1.4.3. Profitability by Market Segments (Product/Channel/Region)
18.1.4.4. Sales Footprint
18.1.4.5. Strategy Overview
18.1.4.5.1. Marketing Strategy
18.1.4.5.2. Product Strategy
18.1.4.5.3. Channel Strategy
18.1.5. Tetra Pak International S.A.
18.1.5.1. Overview
18.1.5.2. Product Portfolio
18.1.5.3. Profitability by Market Segments (Product/Channel/Region)
18.1.5.4. Sales Footprint
18.1.5.5. Strategy Overview
18.1.5.5.1. Marketing Strategy
18.1.5.5.2. Product Strategy
18.1.5.5.3. Channel Strategy
18.1.6. Huhtamaki Oyj
18.1.6.1. Overview
18.1.6.2. Product Portfolio
18.1.6.3. Profitability by Market Segments (Product/Channel/Region)
18.1.6.4. Sales Footprint
18.1.6.5. Strategy Overview
18.1.6.5.1. Marketing Strategy
18.1.6.5.2. Product Strategy
18.1.6.5.3. Channel Strategy
18.1.7. Amcor plc
18.1.7.1. Overview
18.1.7.2. Product Portfolio
18.1.7.3. Profitability by Market Segments (Product/Channel/Region)
18.1.7.4. Sales Footprint
18.1.7.5. Strategy Overview
18.1.7.5.1. Marketing Strategy
18.1.7.5.2. Product Strategy
18.1.7.5.3. Channel Strategy
18.1.8. Sealed Air Corporation
18.1.8.1. Overview
18.1.8.2. Product Portfolio
18.1.8.3. Profitability by Market Segments (Product/Channel/Region)
18.1.8.4. Sales Footprint
18.1.8.5. Strategy Overview
18.1.8.5.1. Marketing Strategy
18.1.8.5.2. Product Strategy
18.1.8.5.3. Channel Strategy
18.1.9. INEOS Olefins & Polymers Europe
18.1.9.1. Overview
18.1.9.2. Product Portfolio
18.1.9.3. Profitability by Market Segments (Product/Channel/Region)
18.1.9.4. Sales Footprint
18.1.9.5. Strategy Overview
18.1.9.5.1. Marketing Strategy
18.1.9.5.2. Product Strategy
18.1.9.5.3. Channel Strategy
18.1.10. SUKANO
18.1.10.1. Overview
18.1.10.2. Product Portfolio
18.1.10.3. Profitability by Market Segments (Product/Channel/Region)
18.1.10.4. Sales Footprint
18.1.10.5. Strategy Overview
18.1.10.5.1. Marketing Strategy
18.1.10.5.2. Product Strategy
18.1.10.5.3. Channel Strategy
18.1.11. Greiner Packaging international GmbH
18.1.11.1. Overview
18.1.11.2. Product Portfolio
18.1.11.3. Profitability by Market Segments (Product/Channel/Region)
18.1.11.4. Sales Footprint
18.1.11.5. Strategy Overview
18.1.11.5.1. Marketing Strategy
18.1.11.5.2. Product Strategy
18.1.11.5.3. Channel Strategy
18.1.12. Kothari Group
18.1.12.1. Overview
18.1.12.2. Product Portfolio
18.1.12.3. Profitability by Market Segments (Product/Channel/Region)
18.1.12.4. Sales Footprint
18.1.12.5. Strategy Overview
18.1.12.5.1. Marketing Strategy
18.1.12.5.2. Product Strategy
18.1.12.5.3. Channel Strategy
18.1.13. Fabri-Kal
18.1.13.1. Overview
18.1.13.2. Product Portfolio
18.1.13.3. Profitability by Market Segments (Product/Channel/Region)
18.1.13.4. Sales Footprint
18.1.13.5. Strategy Overview
18.1.13.5.1. Marketing Strategy
18.1.13.5.2. Product Strategy
18.1.13.5.3. Channel Strategy
19. Assumptions and Acronyms Used
20. Research Methodology
Let us know your requirement to get
100% FREE customization
Table 01: Global Dairy Containers Market Value (US$ Mn) Forecast by Region, 2015-2032
Table 02: Global Dairy Containers Market Volume (Units) Forecast by Region, 2015-2032
Table 03: Global Dairy Containers Market Value (US$ Mn) Forecast by Material, 2015-2032
Table 04: Global Dairy Containers Market Volume (Units) Forecast by Material, 2015-2032
Table 05: Global Dairy Containers Market Value (US$ Mn) Forecast by Product Type, 2015-2032
Table 06: Global Dairy Containers Market Volume (Units) Forecast by Product Type, 2015-2032
Table 07: Global Dairy Containers Market Value (US$ Mn) Forecast by Application, 2015-2032
Table 08: Global Dairy Containers Market Volume (Units) Forecast by Application, 2015-2032
Table 09: North America Dairy Containers Market Value (US$ Mn) Forecast by Country, 2015-2032
Table 10: North America Dairy Containers Market Volume (Units) Forecast by Country, 2015-2032
Table 11: North America Dairy Containers Market Value (US$ Mn) Forecast by Material, 2015-2032
Table 12: North America Dairy Containers Market Volume (Units) Forecast by Material, 2015-2032
Table 13: North America Dairy Containers Market Value (US$ Mn) Forecast by Product Type, 2015-2032
Table 14: North America Dairy Containers Market Volume (Units) Forecast by Product Type, 2015-2032
Table 15: North America Dairy Containers Market Value (US$ Mn) Forecast by Application, 2015-2032
Table 16: North America Dairy Containers Market Volume (Units) Forecast by Application, 2015-2032
Table 17: Latin America Dairy Containers Market Value (US$ Mn) Forecast by Country, 2015-2032
Table 18: Latin America Dairy Containers Market Volume (Units) Forecast by Country, 2015-2032
Table 19: Latin America Dairy Containers Market Value (US$ Mn) Forecast by Material, 2015-2032
Table 20: Latin America Dairy Containers Market Volume (Units) Forecast by Material, 2015-2032
Table 21: Latin America Dairy Containers Market Value (US$ Mn) Forecast by Product Type, 2015-2032
Table 22: Latin America Dairy Containers Market Volume (Units) Forecast by Product Type, 2015-2032
Table 23: Latin America Dairy Containers Market Value (US$ Mn) Forecast by Application, 2015-2032
Table 24: Latin America Dairy Containers Market Volume (Units) Forecast by Application, 2015-2032
Table 25: Europe Dairy Containers Market Value (US$ Mn) Forecast by Country, 2015-2032
Table 26: Europe Dairy Containers Market Volume (Units) Forecast by Country, 2015-2032
Table 27: Europe Dairy Containers Market Value (US$ Mn) Forecast by Material, 2015-2032
Table 28: Europe Dairy Containers Market Volume (Units) Forecast by Material, 2015-2032
Table 29: Europe Dairy Containers Market Value (US$ Mn) Forecast by Product Type, 2015-2032
Table 30: Europe Dairy Containers Market Volume (Units) Forecast by Product Type, 2015-2032
Table 31: Europe Dairy Containers Market Value (US$ Mn) Forecast by Application, 2015-2032
Table 32: Europe Dairy Containers Market Volume (Units) Forecast by Application, 2015-2032
Table 33: East Asia Dairy Containers Market Value (US$ Mn) Forecast by Country, 2015-2032
Table 34: East Asia Dairy Containers Market Volume (Units) Forecast by Country, 2015-2032
Table 35: East Asia Dairy Containers Market Value (US$ Mn) Forecast by Material, 2015-2032
Table 36: East Asia Dairy Containers Market Volume (Units) Forecast by Material, 2015-2032
Table 37: East Asia Dairy Containers Market Value (US$ Mn) Forecast by Product Type, 2015-2032
Table 38: East Asia Dairy Containers Market Volume (Units) Forecast by Product Type, 2015-2032
Table 39: East Asia Dairy Containers Market Value (US$ Mn) Forecast by Application, 2015-2032
Table 40: East Asia Dairy Containers Market Volume (Units) Forecast by Application, 2015-2032
Table 41: South Asia Dairy Containers Market Value (US$ Mn) Forecast by Country, 2015-2032
Table 42: South Asia Dairy Containers Market Volume (Units) Forecast by Country, 2015-2032
Table 43: South Asia Dairy Containers Market Value (US$ Mn) Forecast by Material, 2015-2032
Table 44: South Asia Dairy Containers Market Volume (Units) Forecast by Material, 2015-2032
Table 45: South Asia Dairy Containers Market Value (US$ Mn) Forecast by Product Type, 2015-2032
Table 46: South Asia Dairy Containers Market Volume (Units) Forecast by Product Type, 2015-2032
Table 47: South Asia Dairy Containers Market Value (US$ Mn) Forecast by Application, 2015-2032
Table 48: South Asia Dairy Containers Market Volume (Units) Forecast by Application, 2015-2032
Table 49: Oceania Dairy Containers Market Value (US$ Mn) Forecast by Country, 2015-2032
Table 50: Oceania Dairy Containers Market Volume (Units) Forecast by Country, 2015-2032
Table 51: Oceania Dairy Containers Market Value (US$ Mn) Forecast by Material, 2015-2032
Table 52: Oceania Dairy Containers Market Volume (Units) Forecast by Material, 2015-2032
Table 53: Oceania Dairy Containers Market Value (US$ Mn) Forecast by Product Type, 2015-2032
Table 54: Oceania Dairy Containers Market Volume (Units) Forecast by Product Type, 2015-2032
Table 55: Oceania Dairy Containers Market Value (US$ Mn) Forecast by Application, 2015-2032
Table 56: Oceania Dairy Containers Market Volume (Units) Forecast by Application, 2015-2032
Table 57: MEA Dairy Containers Market Value (US$ Mn) Forecast by Country, 2015-2032
Table 58: MEA Dairy Containers Market Volume (Units) Forecast by Country, 2015-2032
Table 59: MEA Dairy Containers Market Value (US$ Mn) Forecast by Material, 2015-2032
Table 60: MEA Dairy Containers Market Volume (Units) Forecast by Material, 2015-2032
Table 61: MEA Dairy Containers Market Value (US$ Mn) Forecast by Product Type, 2015-2032
Table 62: MEA Dairy Containers Market Volume (Units) Forecast by Product Type, 2015-2032
Table 63: MEA Dairy Containers Market Value (US$ Mn) Forecast by Application, 2015-2032
Table 64: MEA Dairy Containers Market Volume (Units) Forecast by Application, 2015-2032
Table 65: U.S. Dairy Containers Market Value (US$ Mn) Forecast by Material, Product Type, and Application (2022(E) & 2032(F))
Table 66: Canada Dairy Containers Market Value (US$ Mn) Forecast by Material, Product Type, and Application (2022(E) & 2032(F))
Table 67: Brazil Dairy Containers Market Value (US$ Mn) Forecast by Material, Product Type, and Application (2022(E) & 2032(F))
Table 68: Mexico Dairy Containers Market Value (US$ Mn) Forecast by Material, Product Type, and Application (2022(E) & 2032(F))
Table 69: Germany Dairy Containers Market Value (US$ Mn) Forecast by Material, Product Type, and Application (2022(E) & 2032(F))
Table 70: Italy Dairy Containers Market Value (US$ Mn) Forecast by Material, Product Type, and Application (2022(E) & 2032(F))
Table 71: France Dairy Containers Market Value (US$ Mn) Forecast by Material, Product Type, and Application (2022(E) & 2032(F))
Table 72: Spain Dairy Containers Market Value (US$ Mn) Forecast by Material, Product Type, and Application (2022(E) & 2032(F))
Table 73: U.K. Dairy Containers Market Value (US$ Mn) Forecast by Material, Product Type, and Application (2022(E) & 2032(F))
Table 74: Russia Dairy Containers Market Value (US$ Mn) Forecast by Material, Product Type, and Application (2022(E) & 2032(F))
Table 75: China Dairy Containers Market Value (US$ Mn) Forecast by Material, Product Type, and Application (2022(E) & 2032(F))
Table 76: Japan Dairy Containers Market Value (US$ Mn) Forecast by Material, Product Type, and Application (2022(E) & 2032(F))
Table 77: India Dairy Containers Market Value (US$ Mn) Forecast by Material, Product Type, and Application (2022(E) & 2032(F))
Table 78: GCC Countries Dairy Containers Market Value (US$ Mn) Forecast by Material, Product Type, and Application (2022(E) & 2032(F))
Table 79: Australia Dairy Containers Market Value (US$ Mn) Forecast by Material, Product Type, and Application (2022(E) & 2032(F))
Find your sweet spots for generating winning opportunities in this market.
Talk to AnalystFigure 01: Global Dairy Containers Market Value (US$ Mn) by Material, 2022-2032
Figure 02: Global Dairy Containers Market Value (US$ Mn) by Product Type, 2022-2032
Figure 03: Global Dairy Containers Market Value (US$ Mn) by Application, 2022-2032
Figure 04: Global Dairy Containers Market Value (US$ Mn) by Region, 2022-2032
Figure 05: Global Dairy Containers Market Value (US$ Mn) Analysis by Region, 2015-2021
Figure 06: Global Dairy Containers Market Volume (Units) Analysis by Region, 2015-2032
Figure 07: Global Dairy Containers Market Value Share (%) and BPS Analysis by Region, 2022 & 2032
Figure 08: Global Dairy Containers Market Y-o-Y Growth (%) Projections by Region, 2022-2032
Figure 09: Global Dairy Containers Market Value (US$ Mn) Analysis by Material, 2015-2021
Figure 10: Global Dairy Containers Market Volume (Units) Analysis by Material, 2015-2032
Figure 11: Global Dairy Containers Market Value Share (%) and BPS Analysis by Material, 2022 & 2032
Figure 12: Global Dairy Containers Market Y-o-Y Growth (%) Projections by Material, 2022-2032
Figure 13: Global Dairy Containers Market Value (US$ Mn) Analysis by Product Type, 2015-2021
Figure 14: Global Dairy Containers Market Volume (Units) Analysis by Product Type, 2015-2032
Figure 15: Global Dairy Containers Market Value Share (%) and BPS Analysis by Product Type, 2022 & 2032
Figure 16: Global Dairy Containers Market Y-o-Y Growth (%) Projections by Product Type, 2022-2032
Figure 17: Global Dairy Containers Market Value (US$ Mn) Analysis by Application, 2015-2021
Figure 18: Global Dairy Containers Market Volume (Units) Analysis by Application, 2015-2032
Figure 19: Global Dairy Containers Market Value Share (%) and BPS Analysis by Application, 2022 & 2032
Figure 20: Global Dairy Containers Market Y-o-Y Growth (%) Projections by Application, 2022-2032
Figure 21: Global Dairy Containers Market Attractiveness by Material, 2022-2032
Figure 22: Global Dairy Containers Market Attractiveness by Product Type, 2022-2032
Figure 23: Global Dairy Containers Market Attractiveness by Application, 2022-2032
Figure 24: Global Dairy Containers Market Attractiveness by Application, 2022-2032
Figure 25: Global Dairy Containers Market Attractiveness by Region, 2022-2032
Figure 26: North America Dairy Containers Market Value (US$ Mn) by Material, 2022-2032
Figure 27: North America Dairy Containers Market Value (US$ Mn) by Product Type, 2022-2032
Figure 28: North America Dairy Containers Market Value (US$ Mn) by Application, 2022-2032
Figure 29: North America Dairy Containers Market Value (US$ Mn) by Country, 2022-2032
Figure 30: North America Dairy Containers Market Value (US$ Mn) Analysis by Country, 2015-2021
Figure 31: North America Dairy Containers Market Volume (Units) Analysis by Country, 2015-2032
Figure 32: North America Dairy Containers Market Value Share (%) and BPS Analysis by Country, 2022 & 2032
Figure 33: North America Dairy Containers Market Y-o-Y Growth (%) Projections by Country, 2022-2032
Figure 34: North America Dairy Containers Market Value (US$ Mn) Analysis by Material, 2015-2021
Figure 35: North America Dairy Containers Market Volume (Units) Analysis by Material, 2015-2032
Figure 36: North America Dairy Containers Market Value Share (%) and BPS Analysis by Material, 2022 & 2032
Figure 37: North America Dairy Containers Market Y-o-Y Growth (%) Projections by Material, 2022-2032
Figure 38: North America Dairy Containers Market Value (US$ Mn) Analysis by Product Type, 2015-2021
Figure 39: North America Dairy Containers Market Volume (Units) Analysis by Product Type, 2015-2032
Figure 40: North America Dairy Containers Market Value Share (%) and BPS Analysis by Product Type, 2022 & 2032
Figure 41: North America Dairy Containers Market Y-o-Y Growth (%) Projections by Product Type, 2022-2032
Figure 42: North America Dairy Containers Market Value (US$ Mn) Analysis by Application, 2015-2021
Figure 43: North America Dairy Containers Market Volume (Units) Analysis by Application, 2015-2032
Figure 44: North America Dairy Containers Market Value Share (%) and BPS Analysis by Application, 2022 & 2032
Figure 45: North America Dairy Containers Market Y-o-Y Growth (%) Projections by Application, 2022-2032
Figure 46: North America Dairy Containers Market Attractiveness by Material, 2022-2032
Figure 47: North America Dairy Containers Market Attractiveness by Product Type, 2022-2032
Figure 48: North America Dairy Containers Market Attractiveness by Application, 2022-2032
Figure 49: North America Dairy Containers Market Attractiveness by Country, 2022-2032
Figure 50: Latin America Dairy Containers Market Value (US$ Mn) by Material, 2022 & 2032
Figure 51: Latin America Dairy Containers Market Value (US$ Mn) by Product Type, 2022-2032
Figure 52: Latin America Dairy Containers Market Value (US$ Mn) by Application, 2022-2032
Figure 53: Latin America Dairy Containers Market Value (US$ Mn) by Country, 2022-2032
Figure 54: Latin America Dairy Containers Market Value (US$ Mn) Analysis by Country, 2015-2021
Figure 55: Latin America Dairy Containers Market Volume (Units) Analysis by Country, 2015-2032
Figure 56: Latin America Dairy Containers Market Value Share (%) and BPS Analysis by Country, 2022 & 2032
Figure 57: Latin America Dairy Containers Market Y-o-Y Growth (%) Projections by Country, 2022-2032
Figure 58: Latin America Dairy Containers Market Value (US$ Mn) Analysis by Material, 2015-2021
Figure 59: Latin America Dairy Containers Market Volume (Units) Analysis by Material, 2015-2032
Figure 60: Latin America Dairy Containers Market Value Share (%) and BPS Analysis by Material, 2022 & 2032
Figure 61: Latin America Dairy Containers Market Y-o-Y Growth (%) Projections by Material, 2022-2032
Figure 62: Latin America Dairy Containers Market Value (US$ Mn) Analysis by Product Type, 2015-2021
Figure 63: Latin America Dairy Containers Market Volume (Units) Analysis by Product Type, 2015-2032
Figure 64: Latin America Dairy Containers Market Value Share (%) and BPS Analysis by Product Type, 2022 & 2032
Figure 65: Latin America Dairy Containers Market Y-o-Y Growth (%) Projections by Product Type, 2022-2032
Figure 66: Latin America Dairy Containers Market Value (US$ Mn) Analysis by Application, 2015-2021
Figure 67: Latin America Dairy Containers Market Volume (Units) Analysis by Application, 2015-2032
Figure 68: Latin America Dairy Containers Market Value Share (%) and BPS Analysis by Application, 2022 & 2032
Figure 69: Latin America Dairy Containers Market Y-o-Y Growth (%) Projections by Application, 2022-2032
Figure 70: Latin America Dairy Containers Market Attractiveness by Material, 2022-2032
Figure 71: Latin America Dairy Containers Market Attractiveness by Product Type, 2022-2032
Figure 72: Latin America Dairy Containers Market Attractiveness by Application, 2022-2032
Figure 73: Latin America Dairy Containers Market Attractiveness by Country, 2022-2032
Figure 74: Europe Dairy Containers Market Value (US$ Mn) by Material, 2022-2032
Figure 75: Europe Dairy Containers Market Value (US$ Mn) by Product Type, 2022-2032
Figure 76: Europe Dairy Containers Market Value (US$ Mn) by Application, 2022-2032
Figure 77: Europe Dairy Containers Market Value (US$ Mn) by Country, 2022-2032
Figure 78: Europe Dairy Containers Market Value (US$ Mn) Analysis by Country, 2015-2021
Figure 79: Europe Dairy Containers Market Volume (Units) Analysis by Country, 2015-2032
Figure 80: Europe Dairy Containers Market Value Share (%) and BPS Analysis by Country, 2022 & 2032
Figure 81: Europe Dairy Containers Market Y-o-Y Growth (%) Projections by Country, 2022-2032
Figure 82: Europe Dairy Containers Market Value (US$ Mn) Analysis by Material, 2015-2021
Figure 83: Europe Dairy Containers Market Volume (Units) Analysis by Material, 2015-2032
Figure 84: Europe Dairy Containers Market Value Share (%) and BPS Analysis by Material, 2022 & 2032
Figure 85: Europe Dairy Containers Market Y-o-Y Growth (%) Projections by Material, 2022-2032
Figure 86: Europe Dairy Containers Market Value (US$ Mn) Analysis by Product Type, 2015-2021
Figure 87: Europe Dairy Containers Market Volume (Units) Analysis by Product Type, 2015-2032
Figure 88: Europe Dairy Containers Market Value Share (%) and BPS Analysis by Product Type, 2022 & 2032
Figure 89: Europe Dairy Containers Market Y-o-Y Growth (%) Projections by Product Type, 2022-2032
Figure 90: Europe Dairy Containers Market Value (US$ Mn) Analysis by Application, 2015-2021
Figure 91: Europe Dairy Containers Market Volume (Units) Analysis by Application, 2015-2032
Figure 92: Europe Dairy Containers Market Value Share (%) and BPS Analysis by Application, 2022 & 2032
Figure 93: Europe Dairy Containers Market Y-o-Y Growth (%) Projections by Application, 2022-2032
Figure 94: Europe Dairy Containers Market Attractiveness by Material, 2022-2032
Figure 95: Europe Dairy Containers Market Attractiveness by Product Type, 2022-2032
Figure 96: Europe Dairy Containers Market Attractiveness by Application, 2022-2032
Figure 97: Europe Dairy Containers Market Attractiveness by Country, 2022-2032
Figure 98: East Asia Dairy Containers Market Value (US$ Mn) by Material, 2022-2032
Figure 99: East Asia Dairy Containers Market Value (US$ Mn) by Product Type, 2022-2032
Figure 100: East Asia Dairy Containers Market Value (US$ Mn) by Application, 2022-2032
Figure 101: East Asia Dairy Containers Market Value (US$ Mn) by Country, 2022-2032
Figure 102: East Asia Dairy Containers Market Value (US$ Mn) Analysis by Country, 2015-2021
Figure 103: East Asia Dairy Containers Market Volume (Units) Analysis by Country, 2015-2032
Figure 104: East Asia Dairy Containers Market Value Share (%) and BPS Analysis by Country, 2022 & 2032
Figure 105: East Asia Dairy Containers Market Y-o-Y Growth (%) Projections by Country, 2022-2032
Figure 106: East Asia Dairy Containers Market Value (US$ Mn) Analysis by Material, 2015-2021
Figure 107: East Asia Dairy Containers Market Volume (Units) Analysis by Material, 2015-2032
Figure 108: East Asia Dairy Containers Market Value Share (%) and BPS Analysis by Material, 2022 & 2032
Figure 109: East Asia Dairy Containers Market Y-o-Y Growth (%) Projections by Material, 2022-2032
Figure 110: East Asia Dairy Containers Market Value (US$ Mn) Analysis by Product Type, 2015-2021
Figure 111: East Asia Dairy Containers Market Volume (Units) Analysis by Product Type, 2015-2032
Figure 112: East Asia Dairy Containers Market Value Share (%) and BPS Analysis by Product Type, 2022 & 2032
Figure 113: East Asia Dairy Containers Market Y-o-Y Growth (%) Projections by Product Type, 2022-2032
Figure 114: East Asia Dairy Containers Market Value (US$ Mn) Analysis by Application, 2015-2021
Figure 115: East Asia Dairy Containers Market Volume (Units) Analysis by Application, 2015-2032
Figure 116: East Asia Dairy Containers Market Value Share (%) and BPS Analysis by Application, 2022 & 2032
Figure 117: East Asia Dairy Containers Market Y-o-Y Growth (%) Projections by Application, 2022-2032
Figure 118: East Asia Dairy Containers Market Attractiveness by Material, 2022-2032
Figure 119: East Asia Dairy Containers Market Attractiveness by Product Type, 2022-2032
Figure 120: East Asia Dairy Containers Market Attractiveness by Application, 2022-2032
Figure 121: East Asia Dairy Containers Market Attractiveness by Country, 2022-2032
Figure 122: South Asia Dairy Containers Market Value (US$ Mn) by Material, 2022-2032
Figure 123: South Asia Dairy Containers Market Value (US$ Mn) by Product Type, 2022-2032
Figure 124: South Asia Dairy Containers Market Value (US$ Mn) by Application, 2022-2032
Figure 125: South Asia Dairy Containers Market Value (US$ Mn) by Country, 2022-2032
Figure 126: South Asia Dairy Containers Market Value (US$ Mn) Analysis by Country, 2015-2021
Figure 127: South Asia Dairy Containers Market Volume (Units) Analysis by Country, 2015-2032
Figure 128: South Asia Dairy Containers Market Value Share (%) and BPS Analysis by Country, 2022 & 2032
Figure 129: South Asia Dairy Containers Market Y-o-Y Growth (%) Projections by Country, 2022-2032
Figure 130: South Asia Dairy Containers Market Value (US$ Mn) Analysis by Material, 2015-2021
Figure 131: South Asia Dairy Containers Market Volume (Units) Analysis by Material, 2015-2032
Figure 132: South Asia Dairy Containers Market Value Share (%) and BPS Analysis by Material, 2022 & 2032
Figure 133: South Asia Dairy Containers Market Y-o-Y Growth (%) Projections by Material, 2022-2032
Figure 134: South Asia Dairy Containers Market Value (US$ Mn) Analysis by Product Type, 2015-2021
Figure 135: South Asia Dairy Containers Market Volume (Units) Analysis by Product Type, 2015-2032
Figure 136: South Asia Dairy Containers Market Value Share (%) and BPS Analysis by Product Type, 2022 & 2032
Figure 137: South Asia Dairy Containers Market Y-o-Y Growth (%) Projections by Product Type, 2022-2032
Figure 138: South Asia Dairy Containers Market Value (US$ Mn) Analysis by Application, 2015-2021
Figure 139: South Asia Dairy Containers Market Volume (Units) Analysis by Application, 2015-2032
Figure 140: South Asia Dairy Containers Market Value Share (%) and BPS Analysis by Application, 2022 & 2032
Figure 141: South Asia Dairy Containers Market Y-o-Y Growth (%) Projections by Application, 2022-2032
Figure 142: South Asia Dairy Containers Market Attractiveness by Material, 2022-2032
Figure 143: South Asia Dairy Containers Market Attractiveness by Product Type, 2022-2032
Figure 144: South Asia Dairy Containers Market Attractiveness by Application, 2022-2032
Figure 145: South Asia Dairy Containers Market Attractiveness by Country, 2022-2032
Figure 146: Oceania Dairy Containers Market Value (US$ Mn) by Material, 2022-2032
Figure 147: Oceania Dairy Containers Market Value (US$ Mn) by Product Type, 2022-2032
Figure 148: Oceania Dairy Containers Market Value (US$ Mn) by Application, 2022-2032
Figure 149: Oceania Dairy Containers Market Value (US$ Mn) by Country, 2022-2032
Figure 150: Oceania Dairy Containers Market Value (US$ Mn) Analysis by Country, 2015-2021
Figure 151: Oceania Dairy Containers Market Volume (Units) Analysis by Country, 2015-2032
Figure 152: Oceania Dairy Containers Market Value Share (%) and BPS Analysis by Country, 2022 & 2032
Figure 153: Oceania Dairy Containers Market Y-o-Y Growth (%) Projections by Country, 2022-2032
Figure 154: Oceania Dairy Containers Market Value (US$ Mn) Analysis by Material, 2015-2021
Figure 155: Oceania Dairy Containers Market Volume (Units) Analysis by Material, 2015-2032
Figure 156: Oceania Dairy Containers Market Value Share (%) and BPS Analysis by Material, 2022 & 2032
Figure 157: Oceania Dairy Containers Market Y-o-Y Growth (%) Projections by Material, 2022-2032
Figure 158: Oceania Dairy Containers Market Value (US$ Mn) Analysis by Product Type, 2015-2021
Figure 159: Oceania Dairy Containers Market Volume (Units) Analysis by Product Type, 2015-2032
Figure 160: Oceania Dairy Containers Market Value Share (%) and BPS Analysis by Product Type, 2022 & 2032
Figure 161: Oceania Dairy Containers Market Y-o-Y Growth (%) Projections by Product Type, 2022-2032
Figure 162: Oceania Dairy Containers Market Value (US$ Mn) Analysis by Application, 2015-2021
Figure 163: Oceania Dairy Containers Market Volume (Units) Analysis by Application, 2015-2032
Figure 164: Oceania Dairy Containers Market Value Share (%) and BPS Analysis by Application, 2022 & 2032
Figure 165: Oceania Dairy Containers Market Y-o-Y Growth (%) Projections by Application, 2022-2032
Figure 166: Oceania Dairy Containers Market Attractiveness by Material, 2022-2032
Figure 167: Oceania Dairy Containers Market Attractiveness by Product Type, 2022-2032
Figure 168: Oceania Dairy Containers Market Attractiveness by Application, 2022-2032
Figure 169 Oceania Dairy Containers Market Attractiveness by Country, 2022-2032
Figure 170: MEA Dairy Containers Market Value (US$ Mn) by Material, 2022-2032
Figure 171: MEA Dairy Containers Market Value (US$ Mn) by Product Type, 2022-2032
Figure 172: MEA Dairy Containers Market Value (US$ Mn) by Application, 2022-2032
Figure 173: MEA Dairy Containers Market Value (US$ Mn) by Country, 2022-2032
Figure 174: MEA Dairy Containers Market Value (US$ Mn) Analysis by Country, 2015-2021
Figure 175: MEA Dairy Containers Market Volume (Units) Analysis by Country, 2015-2032
Figure 176: MEA Dairy Containers Market Value Share (%) and BPS Analysis by Country, 2022 & 2032
Figure 177: MEA Dairy Containers Market Y-o-Y Growth (%) Projections by Country, 2022-2032
Figure 178: MEA Dairy Containers Market Value (US$ Mn) Analysis by Material, 2015-2021
Figure 179: MEA Dairy Containers Market Volume (Units) Analysis by Material, 2015-2032
Figure 180: MEA Dairy Containers Market Value Share (%) and BPS Analysis by Material, 2022 & 2032
Figure 181: MEA Dairy Containers Market Y-o-Y Growth (%) Projections by Material, 2022-2032
Figure 182: MEA Dairy Containers Market Value (US$ Mn) Analysis by Product Type, 2015-2021
Figure 183: MEA Dairy Containers Market Volume (Units) Analysis by Product Type, 2015-2032
Figure 184: MEA Dairy Containers Market Value Share (%) and BPS Analysis by Product Type, 2022 & 2032
Figure 185: MEA Dairy Containers Market Y-o-Y Growth (%) Projections by Product Type, 2022-2032
Figure 186: MEA Dairy Containers Market Value (US$ Mn) Analysis by Application, 2015-2021
Figure 187: MEA Dairy Containers Market Volume (Units) Analysis by Application, 2015-2032
Figure 188: MEA Dairy Containers Market Value Share (%) and BPS Analysis by Application, 2022 & 2032
Figure 189: MEA Dairy Containers Market Y-o-Y Growth (%) Projections by Application, 2022-2032
Figure 190: MEA Dairy Containers Market Attractiveness by Material, 2022-2032
Figure 191: MEA Dairy Containers Market Attractiveness by Product Type, 2022-2032
Figure 192: MEA Dairy Containers Market Attractiveness by Application, 2022-2032
Figure 193: MEA Dairy Containers Market Attractiveness by Country, 2022-2032
Need specific information?
Request CustomizationExplore Packaging Insights
View Reports