Dairy-Free Spreads Market Size and Share Forecast 2025 to 2035

The global dairy-free spreads market is set to grow from USD 4.4 billion in 2025 to USD 9.02 billion by 2035, at a CAGR of 7.4%.This expansion is primarily driven by the growing consumer shift towards plant-based and dairy-free alternatives, particularly as health-conscious choices and dietary restrictions such as lactose intolerance and veganism continue to rise.
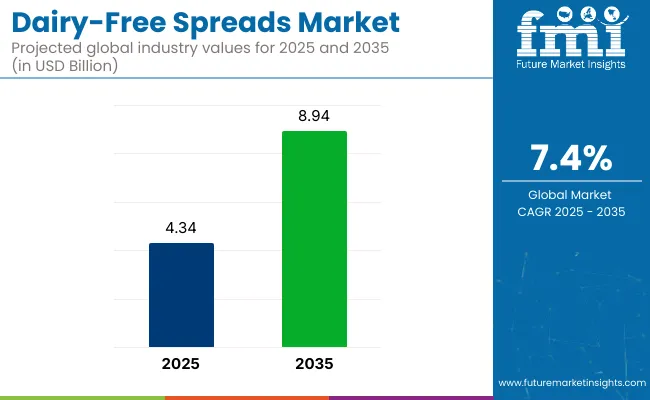
Dairy-Free Spreads Market Quick Stats

  • Market Value (2025): USD 4.4 billion
  • Forecast Value (2035): USD 9.02 billion
  • Global CAGR: 7.4%
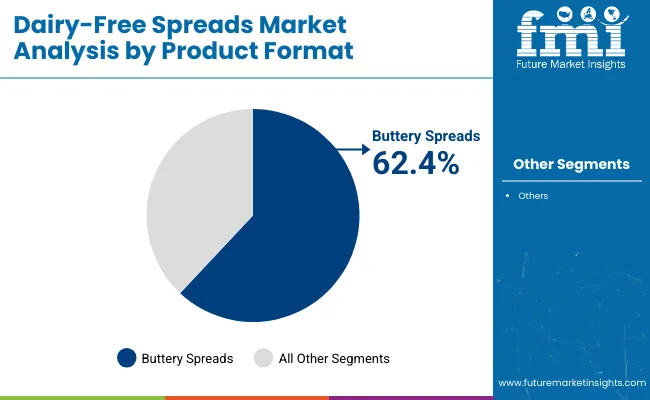
  • Leading Segment in 2025: Buttery Spreads (~62.4% share)
  • Key Growth Regions:Asia Pacific (India, 5.8% of CAGR)
  • Key Players:Upfield, Nutiva, Conagra Brands, Miyoko's Creamery, Califia Farms, Earth Balance, Follow Your Heart, Melt Organic, Good Planet Foods

Dairy Free Spreads Market

Metric Value
Market Value (2025) USD 4.4 billion
Market Value (2035) USD 9.02 billion
CAGR (2025 to 2035) 7.4%

As consumers become more mindful of their health and the environmental impact of their choices, this spreads are becoming increasingly popular as substitutes for traditional butter and margarine.

Dairy-free spreads accounted for an estimated 11.4% share of the plant-based food products industry, reflecting rising cross-category use. Within vegan dairy alternatives, the segment held a 16.2% share, driven by demand for allergen-free and cholesterol-free formulations. A 9.7% share was recorded in the specialty food ingredients category, supported by clean-label positioning and customization.

In the margarine and fats industry, dairy-free spreads claimed 13.5%, as vegetable oil-based substitutes replaced traditional fat sources. Lastly, the segment captured 8.9% of the functional food products space, where value was driven by fortification and fiber inclusions. These shares reflect structural overlap across processing categories and shifting purchase drivers linked to dietary preference segmentation and channel diversification.

In April 2025, Miyoko’s Creamery introduced its new Jalapeño PlantMilk Cheese Spread. Stuart Kronauge, CEO, remarked,“As more consumers dabble in eating and drinking dairyfree, it’s important that we keep our innovation approachable, familiar and just as delicious as traditional dairy options. Jalapeño Plant Milk Cheese Spread checks off all of those boxes, and is another testament to our unwavering commitment to pushing the boundaries of plantbased innovation.”

Geographically, North America and Europe are expected to remain the largest industry for this spreads, with a significant share of the demand coming from the United States and the United Kingdom. These regions are leading the charge in the adoption of plant-based diets and the shift towards more organic food options. In Asia-Pacific, countries like India are seeing a growing preference for dairy-free products, further driving the global industry.

Analyzing Dairy-Free Spreads Market by Top Investment Segments

The dairy-free spreads market is segmented by primary ingredient into legume-based, nut-based, seed-based, coconut-based, and oil-based ingredients. By product format, the segment includes buttery spreads, nut & seed butters, cream cheese alternatives, and specialty spreads. By functional claim, the segmentation covers basic alternatives, fortified/enhanced, allergen-free, and organic/non-GMO functional claims.

By distribution channel, the industry is segmented into supermarkets/hypermarkets, convenience stores, specialty stores, online retail, and direct-to-consumer channels. Industry analysis has been conducted in key regions including North America, Latin America, Western Europe, Eastern Europe, Asia Pacific, Middle East, and Africa.

Buttery Spreads Guide 2025 Product-Type Leadership

Buttery formats are expected to command 62.4% share in 2025. Recipe functionality has been retained by blending coconut, shea, and canola oils with natural emulsifiers, giving cooks a like-for-like butter swap. Violife, Miyoko’s Creamery, and Earth Balance have increased batch capacity in North America and Europe, allowing food-service distributors to secure pallet-scale orders.

Product lines have been diversified into salted blocks, whipped tubs, and baking sticks, ensuring cross-category placement. Retail sell-through has been strengthened by coupon programs that encourage trial adoption.
  • Adoption of buttery spreads has been driven by recipe versatility.
  • Production expansion has been undertaken to secure distributor continuity.
  • Household penetration has been lifted through multipack promotions.

Dairy Free Spreads Market Analysis By Product Format

Legume-Based Blends Capture One-Third Ingredient Share

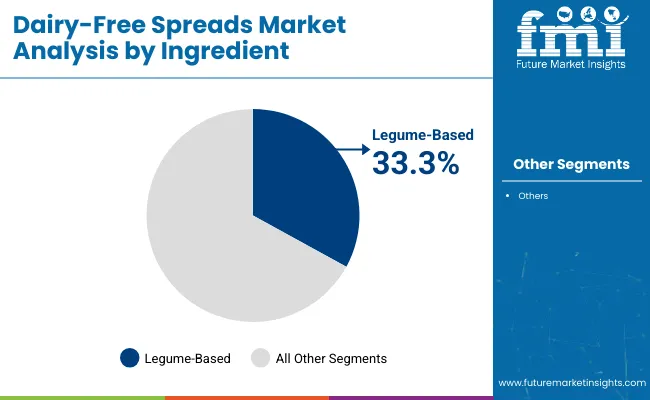
Legume inputs are projected to secure a 33.3% share by 2025. Pea, lentil, and chickpea proteins have been combined with sunflower and rapeseed oils, producing spreads with elevated amino-acid density. Ripple Foods and J.M. Smucker have scaled extrusion and micro-milling, improving mouthfeel while avoiding allergen warnings linked to nuts. Food-service buyers have adopted legume spreads for school menus where dairy exclusion policies apply. Retail trial rates have been supported by clear plant-protein claims on front panels.
  • Nutritional density has been enhanced by pea-protein enrichment.
  • Allergen-aware menus have been served with legume-oil spreads.
  • Ingredient transparency has been promoted through front-of-pack claims.

Dairy Free Spreads Market Analysis By Ingredient

Basic Alternatives Dominate Functional-Claim Positioning

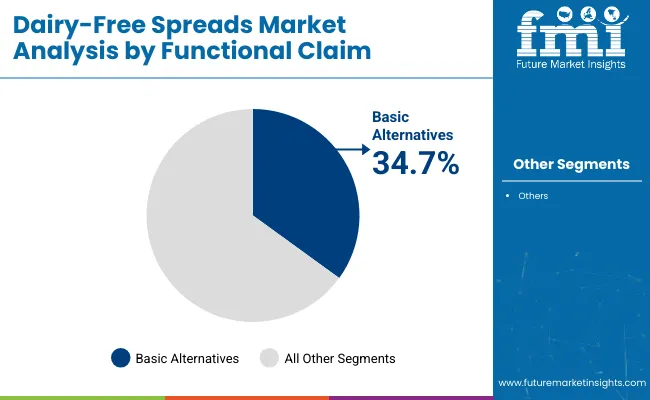
Unfortified dairy-free spreads are anticipated to hold a 34.7% share within functional claims. Formulators have concentrated on healthy fats and moderate protein without supplement additions, keeping labels concise.

Earth Balance and Miyoko’s have trimmed ingredient counts, aiding shoppers who avoid gums and synthetic flavors. Pricing has remained competitive against dairy margarine, encouraging bulk purchase by budget-focused households. Channel partners have emphasised “simple plant butter” shelf tags to attract first-time buyers.
  • Ingredient lists have been shortened to improve shopper confidence.
  • Price parity with dairy margarine has been approached in multipacks
  • Shelf tags citing “simple plant butter” have been deployed for visibility.

Dairy Free Spreads Market Analysis By Functional Claim

Convenience Stores Retain Lead in Distribution Share

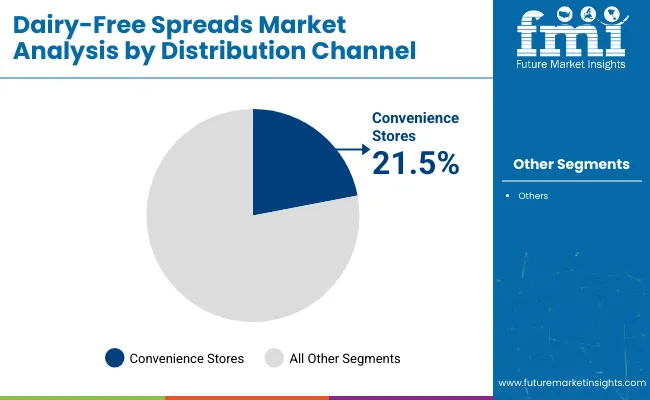
Convenience outlets are expected to contribute 21.5% of the 2025 turnover. Single-serve pouches and 100 g tubs have been stocked near sandwich stations, serving commuters seeking non-dairy condiments. Operators such as 7-Eleven and Circle K have negotiated direct-store-delivery terms with Upfield and Violife, ensuring refrigerated facings remain full during peak hours. Higher unit pricing, typical of c-stores, has preserved margins for brand owners despite smaller volumes.
  • Single-serve portions have been placed by checkout chillers.
  • Direct-store delivery has been adopted to maintain fresh facings.
  • Margin preservation has been enabled by premium c-store pricing.

Dairy Free Spreads Market Analysis By Distribution Channel

Top Dairy-Free Spreads Market Dynamics

Reformulated oil matrices, clean-label positioning, and allergen-conscious branding have helped expand these dairy-free products into mainstream usage. Industrial kitchens and retail shelves have absorbed a wider variety of plant-based formats across margarine, seed-oil spreads, and butter substitutes.

Clean Label Reformulation Reshapes Spread Preferences

Substitution of dairy with legume proteins and specialty oils has been carried out to appeal to ingredient-conscious buyers. Simpler compositions with no artificial additives have gained shelf space in Europe and North America. Spread ability, taste retention, and neutral flavor profiles have been engineered to match traditional butter usage in both households and bakery production

  • Melt Organic and Upfield have launched oat- and avocado-oil spreads across natural grocers.
  • Short ingredient lists have been adopted as a default strategy in USA retail lines.
  • Modified oil-in-water emulsions have improved stability without synthetic stabilizers.

Price Sensitivity Constrains Value-Added Spread Sales

Retail and foodservice channels have shifted toward cost-effective plant-oil blends as input costs fluctuate. Seed-based spreads with higher oil content have faced slower adoption in commercial baking due to margin compression. In low- and mid-tier grocery, the willingness to pay for dairy-free labels has remained limited despite branding efforts.
  • Industrial kitchens have preferred bulk margarine over dairy-free specialty products
  • Mass retail formats have limited shelf allocation to higher-cost oil blends.
  • Procurement contracts have prioritized price predictability over functional innovation.

Analyzing Top Countries Producing, Distributing, and Supplying Dairy-Free Spreads

Country Wise Analysis Of Dairy Free Spreads Market

Countries CAGR (2025 to 2035)
USA 3.9%
Germany 4.1%
China 5.3%
Japan 4.8%
India 5.8%

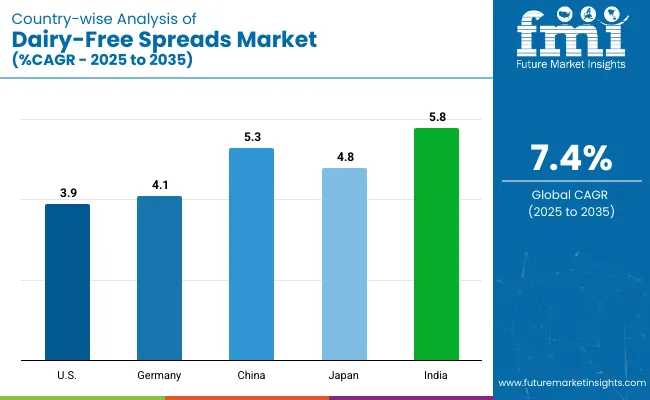
Global dairy-free spreads demand is projected to expand at a 4.8% CAGR from 2025 to 2035. Of the five profiled countries, India leads at 5.8%, followed by China at 5.3% and Japan at 4.8%, while Germany posts 4.1% and the United States records 3.9%.

These rates translate to a growth premium of +21% for India, +10% for China, and baseline alignment for Japan, whereas Germany and the United States trail by -15% and -19%, respectively. Divergence stems from regional factors. Plant-fat substitution in Indian bakery applications, soy-based innovation scale in China, functional dairy-alternative blends in Japan, retail price ceilings in Germany, and industry consolidation across mature USA vegan brands.

The report covers detailed analysis of 40+ countries and the top five countries have been shared as a reference.

Growth Outlook for Dairy-Free Spreads Market in the United States

The dairy-free spreads market in the USA is projected to expand at a CAGR of 3.9% from 2025 to 2035. Growth has been shaped by private-label expansion and continued retail alignment with allergen-free shelf-space strategies. Buttery-style substitutes have remained dominant, driven by consumer familiarity and ease of recipe integration.

Refrigerated sections have been optimized by national retailers to accommodate multiple formats, including tubs and bricks. While health-conscious segments drive innovation, pricing dynamics remain sensitive. Legume-based alternatives have been selectively introduced into public nutrition programs and specialty grocers to address dietary preferences across regional populations.

  • Club stores have introduced larger SKUs of dairy-free butter alternatives.
  • Plant-based labelling standards have been updated for retailer consistency.
  • Public foodservice channels have piloted soy-fat blends in school menus.

In-Depth Analysis of Dairy-Free Spreads Market in Germany

Demand for dairy-free spreads is forecast to grow at a CAGR of 4.1% through 2035. Clean-label expectations have driven demand for reduced-ingredient formats, particularly oat-oil and sunflower-based emulsions. The shift away from margarine with artificial stabilizers has redirected bakery procurement toward dairy-free fats with enhanced mouthfeel.

Strong retail support for natural spreads has increased listings in bio and Rewe-format stores. Regulatory clarity on plant-fat definitions has helped streamline product approvals, supporting faster product launches in the vegan category.

  • Bio industries have prioritized spreads with no emulsifiers or artificial thickeners
  • Dairy-free baking blocks have replaced margarine in gluten-free bakeries.
  • National chains have expanded facings for soy- and oat-fat products.

Demand Forecast for Dairy-Free Spreads Market in China

Sales of dairy-free spreads in China is expected to grow at a CAGR of 5.3% between 2025 and 2035. Growth has been enabled by the adoption of western-style diets and increased lactose intolerance diagnoses. Imported blends have entered via e-commerce, with domestic production ramping up via partnerships.

Breakfast spreads and bakery inclusions have seen significant uptake, especially in second-tier cities. Retailers have aligned promotions with wellness-oriented campaigns, creating visibility for plant-oil alternatives that meet evolving nutritional expectations.

  • E-commerce listings of imported dairy-free butter have tripled since 2023.
  • Second-tier urban centers have added spreads to western-style breakfast aisles.
  • Local brands have introduced soy-fat options under wellness label ranges.

Expansion Forecast for Dairy-Free Spreads Market in Japan

Demand for dairy-free spreads in Japan is projected to expand at a CAGR of 4.8% from 2025 to 2035. Small-format packaging and functional simplicity have guided retail uptake. Convenience stores have adopted mini-tubs and sachets for sandwich preparation, especially among lactose-sensitive consumers.

High-fat margarine replacements using soy and rice oil have entered bakery channels with mild taste profiles. Ingredient lists have been scrutinized by shoppers, prompting brands to eliminate synthetic emulsifiers. Growth remains tied to innovations in umami-forward flavors and spread ability in both refrigerated and ambient segments.

  • 100g packs have gained traction in konbini retail formats.
  • Rice-oil emulsions have been selected by bakery chains for dairy-free fillings.
  • Ingredient minimalism has remained critical to domestic consumer trust.

Dairy-Free Spreads Market Growth Trajectory in India

Sales of dairy-free spreads in India areset to grow at 5.8% CAGR between 2025 and 2035. Demand has been influenced by vegetarian dietary practices and the expansion of urban retail formats. Coconut- and peanut-oil-based spreads have been marketed as ghee replacements, securing entry into home cooking. Regional brands have localized flavor profiles such as masala and curry-leaf infusions, to align with traditional meal routines. The rising availability in kirana stores and online grocery platforms has supported access across income tiers.

  • Coconut-oil spreads have been positioned as ghee alternatives in rural campaigns.
  • Online platforms have enabled direct-to-door dairy-free spread delivery.
  • Regional variants have adopted spice-infused plant-fat combinations.

Leading Dairy-Free Spreads Market Suppliers

The industry is moderately fragmented, with leading, key, and emerging players shaping competition through differentiated formulation, brand positioning, and multi-channel expansion. Dominant players such as Upfield (Flora Food Group), Conagra Brands, and Earth Balance command significant share through scale manufacturing, wide retail presence, and legacy plant-based portfolios.

Upfield leads with brands like Flora and Country Crock, backed by investments in plastic-free packaging and clean-label reformulation. Key players including Miyoko's Creamery, Califia Farms, and Follow Your Heart drive growth via flavor innovation, oat- and nut-based product development, and retail diversification. Emerging companies like Nutiva, Melt Organic, and Good Planet Foods are gaining ground through allergen-free offerings, regional distribution gains, and functional nutrition strategies that meet evolving consumer demand.

Recent Industry News

  • In mid-2025, Miyoko’s Creamery launched a Jalapeño Plant-Milk Cheese Spread made from cashew milk, targeting demand for dairy-free, bold-flavored spreads. As reported by Dairy News. Today (June 2025), the product emphasizes clean-label ingredients and is being distributed through major USA retailers including H-E-B, Publix, Kroger, and Nugget Industry.
  • In June 2024, Miyoko's Creamery, a prominent name in the dairy-free cheese and butter segment, announced the launch of two new oat milk butter flavors-Garlic Parm and Cinnamon Brown Sugar. These additions reinforced the brand’s strategy of delivering premium, plant-based alternatives designed to replicate the taste and texture of traditional dairy while expanding flavor variety in the spreads category.

Leading Players in Dairy-Free Spreads Market

  • Upfield
  • Nutiva
  • Conagra Brands
  • Miyoko's Creamery
  • Califia Farms
  • Earth Balance
  • Follow Your Heart
  • Melt Organic
  • Good Planet Foods
  • Others

Report Coverage and Scope Summary

Report Attributes Details
Industry Size (2025) USD 4.4 billion
Projected Industry Size (2035) USD 9.02 billion
CAGR (2025 to 2035) 7.4%
Base Year for Estimation 2024
Historical Period 2020 to 2024
Projections Period 2025 to 2035
Quantitative Units USD billion for value and thousand metric tons for volume
Primary Ingredients Analyzed (Segment 1) Legume-Based, Nut-Based, Seed-Based, Coconut-Based, Oil-Based
Product Formats Analyzed (Segment 2) Buttery Spreads, Nut & Seed Butters, Cream Cheese Alternatives, Specialty Spreads
Functional Claims Analyzed (Segment 3) Basic Alternatives, Fortified/Enhanced, Allergen-Free, Organic/Non-GMO
Distribution Channels Analyzed (Segment 4) Supermarkets/Hypermarkets, Convenience Stores, Specialty Stores, Online Retail, Direct-to-Consumer Channels
Regions Covered North America, Latin America, Western Europe, Eastern Europe, Asia Pacific, Middle East, Africa
Countries Covered United States, Canada, Germany, United Kingdom, France, Italy, Spain, China, India, Japan, South Korea, Australia, Brazil, Mexico, Argentina, Saudi Arabia, UAE, South Africa
Key Players Upfield, Nutiva, Conagra Brands, Miyoko's Creamery, Califia Farms, Earth Balance, Follow Your Heart, Melt Organic, Good Planet Foods, Others
Additional Attributes Dollar sales, share by format and functional claim, product innovations in plant-based butter, expansion of allergen-free variants, growth in e-commerce and DTC formats, regional trends in dairy-alternative adoption

Key Segments

By Primary Ingredient:

As per primary ingredient, the industry has been categorized into Legume-Based, Nut-Based, Seed-Based, Coconut-Based, and Oil-Based ingredients.

By Product Format:

The segment is further categorized into Buttery Spreads, Nut & Seed Butters, Cream Cheese Alternatives, and Specialty Spreads.

By Functional Claim:

This segment includes categorizations of Basic Alternatives, Fortified/Enhanced, Allergen-Free, and Organic/Non-GMO functional claims.

By Distribution Channel:

Industry analysis has been conducted across Supermarkets/Hypermarkets, Convenience Stores, Specialty Stores, Online Retail, and Direct-to-Consumer Channels.

By Region:

Industry analysis has been conducted in key regions including North America, Latin America, Western Europe, Eastern Europe, Asia Pacific, Middle East, and Africa.

Table of Content

  1. Executive Summary
    • Global Market Outlook
    • Demand-side Trends
    • Supply-side Trends
    • Technology Roadmap Analysis
    • Analysis and Recommendations
  2. Market Overview
    • Market Coverage/Taxonomy
    • Market Definition/Scope/Limitations
  3. Market Background
    • Market Dynamics
      • Drivers
      • Restraints
      • Opportunity
      • Trends
    • Scenario Forecast
      • Demand in Optimistic Scenario
      • Demand in Likely Scenario
      • Demand in Conservative Scenario
    • Opportunity Map Analysis
    • Product Life Cycle Analysis
    • Supply Chain Analysis
      • Supply Side Participants and their Roles
        • Producers
        • Mid-Level Participants (Traders/ Agents/ Brokers)
        • Wholesalers and Distributors
      • Value Added and Value Created at Node in the Supply Chain
      • List of Raw Material Suppliers
      • List of Existing and Potential Buyer’s
    • Investment Feasibility Matrix
    • Value Chain Analysis
      • Profit Margin Analysis
      • Wholesalers and Distributors
      • Retailers
    • PESTLE and Porter’s Analysis
    • Regulatory Landscape
      • By Key Regions
      • By Key Countries
    • Regional Parent Market Outlook
    • Production and Consumption Statistics
    • Import and Export Statistics
  4. Global Market Analysis 2020 to 2024 and Forecast, 2025 to 2035
    • Historical Market Size Value (USD Billion) & Volume (Mt Ton) Analysis, 2020 to 2024
    • Current and Future Market Size Value (USD Billion) & Volume (Mt Ton) Projections, 2025 to 2035
      • Y-o-Y Growth Trend Analysis
      • Absolute $ Opportunity Analysis
  5. Global Market Pricing Analysis 2020 to 2024 and Forecast 2025 to 2035
  6. Global Market Analysis 2020 to 2024 and Forecast 2025 to 2035, By Primary Ingredient
    • Introduction/Key Findings
    • Historical Market Size Value (USD Billion) & Volume (Mt Ton) Analysis By Primary Ingredient, 2020 to 2024
    • Current and Future Market Size Value (USD Billion) & Volume (Mt Ton) Analysis and Forecast By Primary Ingredient, 2025 to 2035
      • Legume-Based
      • Nut-Based
      • Seed-Based
      • Coconut-Based
      • Oil-Based
    • Y-o-Y Growth Trend Analysis By Primary Ingredient, 2020 to 2024
    • Absolute $ Opportunity Analysis By Primary Ingredient, 2025 to 2035
  7. Global Market Analysis 2020 to 2024 and Forecast 2025 to 2035, By Product Format
    • Introduction/Key Findings
    • Historical Market Size Value (USD Billion) & Volume (Mt Ton) Analysis By Product Format, 2020 to 2024
    • Current and Future Market Size Value (USD Billion) & Volume (Mt Ton) Analysis and Forecast By Product Format, 2025 to 2035
      • Buttery Spreads
      • Nut & Seed Butters
      • Cream Cheese Alternatives
      • Specialty Spreads
    • Y-o-Y Growth Trend Analysis By Product Format, 2020 to 2024
    • Absolute $ Opportunity Analysis By Product Format, 2025 to 2035
  8. Global Market Analysis 2020 to 2024 and Forecast 2025 to 2035, By Functional Claim
    • Introduction/Key Findings
    • Historical Market Size Value (USD Billion) & Volume (Mt Ton) Analysis By Functional Claim, 2020 to 2024
    • Current and Future Market Size Value (USD Billion) & Volume (Mt Ton) Analysis and Forecast By Functional Claim, 2025 to 2035
      • Basic Alternatives
      • Fortified/Enhanced
      • Allergen-Free
      • Organic/Non-GMO
    • Y-o-Y Growth Trend Analysis By Functional Claim, 2020 to 2024
    • Absolute $ Opportunity Analysis By Functional Claim, 2025 to 2035
  9. Global Market Analysis 2020 to 2024 and Forecast 2025 to 2035, By Distribution Channel
    • Introduction/Key Findings
    • Historical Market Size Value (USD Billion) & Volume (Mt Ton) Analysis By Distribution Channel, 2020 to 2024
    • Current and Future Market Size Value (USD Billion) & Volume (Mt Ton) Analysis and Forecast By Distribution Channel, 2025 to 2035
      • Supermarkets/Hypermarkets
      • Convenience Stores
      • Specialty Stores
      • Online Retail
      • Direct-to-Consumer
    • Y-o-Y Growth Trend Analysis By Distribution Channel, 2020 to 2024
    • Absolute $ Opportunity Analysis By Distribution Channel, 2025 to 2035
  10. Global Market Analysis 2020 to 2024 and Forecast 2025 to 2035, By Region
    • Introduction
    • Historical Market Size Value (USD Billion) & Volume (Mt Ton) Analysis By Region, 2020 to 2024
    • Current Market Size Value (USD Billion) & Volume (Mt Ton) Analysis and Forecast By Region, 2025 to 2035
      • North America
      • Latin America
      • Western Europe
      • Eastern Europe
      • East Asia
      • South Asia & Pacific
      • Middle East and Africa
    • Market Attractiveness Analysis By Region
  11. North America Market Analysis 2020 to 2024 and Forecast 2025 to 2035, By Country
    • Historical Market Size Value (USD Billion) & Volume (Mt Ton) Trend Analysis By Market Taxonomy, 2020 to 2024
    • Market Size Value (USD Billion) & Volume (Mt Ton) Forecast By Market Taxonomy, 2025 to 2035
      • By Country
        • USA
        • Canada
        • Mexico
      • By Primary Ingredient
      • By Product Format
      • By Functional Claim
      • By Distribution Channel
    • Market Attractiveness Analysis
      • By Country
      • By Primary Ingredient
      • By Product Format
      • By Functional Claim
      • By Distribution Channel
    • Key Takeaways
  12. Latin America Market Analysis 2020 to 2024 and Forecast 2025 to 2035, By Country
    • Historical Market Size Value (USD Billion) & Volume (Mt Ton) Trend Analysis By Market Taxonomy, 2020 to 2024
    • Market Size Value (USD Billion) & Volume (Mt Ton) Forecast By Market Taxonomy, 2025 to 2035
      • By Country
        • Brazil
        • Argentina
        • Rest of LATAM
      • By Primary Ingredient
      • By Product Format
      • By Functional Claim
      • By Distribution Channel
    • Market Attractiveness Analysis
      • By Country
      • By Primary Ingredient
      • By Product Format
      • By Functional Claim
      • By Distribution Channel
    • Key Takeaways
  13. Western Europe Market Analysis 2020 to 2024 and Forecast 2025 to 2035, By Country
    • Historical Market Size Value (USD Billion) & Volume (Mt Ton) Trend Analysis By Market Taxonomy, 2020 to 2024
    • Market Size Value (USD Billion) & Volume (Mt Ton) Forecast By Market Taxonomy, 2025 to 2035
      • By Country
        • Germany
        • Italy
        • France
        • UK
        • Spain
        • BENELUX
        • Nordic
        • Rest of W. Europe
      • By Primary Ingredient
      • By Product Format
      • By Functional Claim
      • By Distribution Channel
    • Market Attractiveness Analysis
      • By Country
      • By Primary Ingredient
      • By Product Format
      • By Functional Claim
      • By Distribution Channel
    • Key Takeaways
  14. Eastern Europe Market Analysis 2020 to 2024 and Forecast 2025 to 2035, By Country
    • Historical Market Size Value (USD Billion) & Volume (Mt Ton) Trend Analysis By Market Taxonomy, 2020 to 2024
    • Market Size Value (USD Billion) & Volume (Mt Ton) Forecast By Market Taxonomy, 2025 to 2035
      • By Country
        • Russia
        • Hungary
        • Poland
        • Balkan & Baltics
        • Rest of E. Europe
      • By Primary Ingredient
      • By Product Format
      • By Functional Claim
      • By Distribution Channel
    • Market Attractiveness Analysis
      • By Country
      • By Primary Ingredient
      • By Product Format
      • By Functional Claim
      • By Distribution Channel
    • Key Takeaways
  15. East Asia Market Analysis 2020 to 2024 and Forecast 2025 to 2035, By Country
    • Historical Market Size Value (USD Billion) & Volume (Mt Ton) Trend Analysis By Market Taxonomy, 2020 to 2024
    • Market Size Value (USD Billion) & Volume (Mt Ton) Forecast By Market Taxonomy, 2025 to 2035
      • By Country
        • China
        • Japan
        • South Korea
      • By Primary Ingredient
      • By Product Format
      • By Functional Claim
      • By Distribution Channel
    • Market Attractiveness Analysis
      • By Country
      • By Primary Ingredient
      • By Product Format
      • By Functional Claim
      • By Distribution Channel
    • Key Takeaways
  16. South Asia & Pacific Market Analysis 2020 to 2024 and Forecast 2025 to 2035, By Country
    • Historical Market Size Value (USD Billion) & Volume (Mt Ton) Trend Analysis By Market Taxonomy, 2020 to 2024
    • Market Size Value (USD Billion) & Volume (Mt Ton) Forecast By Market Taxonomy, 2025 to 2035
      • By Country
        • India
        • Australia & New Zealand
        • ASEAN
        • Rest of SAP
      • By Primary Ingredient
      • By Product Format
      • By Functional Claim
      • By Distribution Channel
    • Market Attractiveness Analysis
      • By Country
      • By Primary Ingredient
      • By Product Format
      • By Functional Claim
      • By Distribution Channel
    • Key Takeaways
  17. Middle East and Africa Market Analysis 2020 to 2024 and Forecast 2025 to 2035, By Country
    • Historical Market Size Value (USD Billion) & Volume (Mt Ton) Trend Analysis By Market Taxonomy, 2020 to 2024
    • Market Size Value (USD Billion) & Volume (Mt Ton) Forecast By Market Taxonomy, 2025 to 2035
      • By Country
        • GCC Countries
        • Northern Africa
        • South Africa
        • Turkiye
        • Rest of MEA
      • By Primary Ingredient
      • By Product Format
      • By Functional Claim
      • By Distribution Channel
    • Market Attractiveness Analysis
      • By Country
      • By Primary Ingredient
      • By Product Format
      • By Functional Claim
      • By Distribution Channel
    • Key Takeaways
  18. Key Countries Market Analysis
    • USA
      • Pricing Analysis
      • Market Share Analysis, 2024
        • By Primary Ingredient
        • By Product Format
        • By Functional Claim
        • By Distribution Channel
    • Canada
      • Pricing Analysis
      • Market Share Analysis, 2024
        • By Primary Ingredient
        • By Product Format
        • By Functional Claim
        • By Distribution Channel
    • Brazil
      • Pricing Analysis
      • Market Share Analysis, 2024
        • By Primary Ingredient
        • By Product Format
        • By Functional Claim
        • By Distribution Channel
    • Mexico
      • Pricing Analysis
      • Market Share Analysis, 2024
        • By Primary Ingredient
        • By Product Format
        • By Functional Claim
        • By Distribution Channel
    • Argentina
      • Pricing Analysis
      • Market Share Analysis, 2024
        • By Primary Ingredient
        • By Product Format
        • By Functional Claim
        • By Distribution Channel
  19. Market Structure Analysis
    • Competition Dashboard
    • Competition Benchmarking
    • Market Share Analysis of Top Players
      • By Regional
      • By Primary Ingredient
      • By Product Format
      • By Functional Claim
      • By Distribution Channel
  20. Competition Analysis
    • Competition Deep Dive
      • Upfield
        • Overview
        • Product Portfolio
        • Profitability by Market Segments (Product/Age /Sales Channel/Region)
        • Sales Footprint
        • Strategy Overview
          • Marketing Strategy
          • Product Strategy
          • Channel Strategy
      • Nutiva
        • Overview
        • Product Portfolio
        • Profitability by Market Segments (Product/Age /Sales Channel/Region)
        • Sales Footprint
        • Strategy Overview
          • Marketing Strategy
          • Product Strategy
          • Channel Strategy
      • Conagra Brands
        • Overview
        • Product Portfolio
        • Profitability by Market Segments (Product/Age /Sales Channel/Region)
        • Sales Footprint
        • Strategy Overview
          • Marketing Strategy
          • Product Strategy
          • Channel Strategy
      • Miyoko's Creamery
        • Overview
        • Product Portfolio
        • Profitability by Market Segments (Product/Age /Sales Channel/Region)
        • Sales Footprint
        • Strategy Overview
          • Marketing Strategy
          • Product Strategy
          • Channel Strategy
      • Califia Farms
        • Overview
        • Product Portfolio
        • Profitability by Market Segments (Product/Age /Sales Channel/Region)
        • Sales Footprint
        • Strategy Overview
          • Marketing Strategy
          • Product Strategy
          • Channel Strategy
      • Earth Balance
        • Overview
        • Product Portfolio
        • Profitability by Market Segments (Product/Age /Sales Channel/Region)
        • Sales Footprint
        • Strategy Overview
          • Marketing Strategy
          • Product Strategy
          • Channel Strategy
      • Follow Your Heart
        • Overview
        • Product Portfolio
        • Profitability by Market Segments (Product/Age /Sales Channel/Region)
        • Sales Footprint
        • Strategy Overview
          • Marketing Strategy
          • Product Strategy
          • Channel Strategy
      • Melt Organic
        • Overview
        • Product Portfolio
        • Profitability by Market Segments (Product/Age /Sales Channel/Region)
        • Sales Footprint
        • Strategy Overview
          • Marketing Strategy
          • Product Strategy
          • Channel Strategy
      • Good Planet Foods
        • Overview
        • Product Portfolio
        • Profitability by Market Segments (Product/Age /Sales Channel/Region)
        • Sales Footprint
        • Strategy Overview
          • Marketing Strategy
          • Product Strategy
          • Channel Strategy
  21. Assumptions & Acronyms Used
  22. Research Methodology

List of Tables

  • Table 1: Global Market Value (USD Billion) Forecast by Region, 2020-2035
  • Table 2: Global Market Volume (Mt Ton) Forecast by Region, 2020-2035
  • Table 3: Global Market Value (USD Billion) Forecast by Primary Ingredient, 2020-2035
  • Table 4: Global Market Volume (Mt Ton) Forecast by Primary Ingredient, 2020-2035
  • Table 5: Global Market Value (USD Billion) Forecast by Product Format, 2020-2035
  • Table 6: Global Market Volume (Mt Ton) Forecast by Product Format, 2020-2035
  • Table 7: Global Market Value (USD Billion) Forecast by Functional Claim, 2020-2035
  • Table 8: Global Market Volume (Mt Ton) Forecast by Functional Claim, 2020-2035
  • Table 9: Global Market Value (USD Billion) Forecast by Distribution Channel, 2020-2035
  • Table 10: Global Market Volume (Mt Ton) Forecast by Distribution Channel, 2020-2035
  • Table 11: North America Market Value (USD Billion) Forecast by Country, 2020-2035
  • Table 12: North America Market Volume (Mt Ton) Forecast by Country, 2020-2035
  • Table 13: North America Market Value (USD Billion) Forecast by Primary Ingredient, 2020-2035
  • Table 14: North America Market Volume (Mt Ton) Forecast by Primary Ingredient, 2020-2035
  • Table 15: North America Market Value (USD Billion) Forecast by Product Format, 2020-2035
  • Table 16: North America Market Volume (Mt Ton) Forecast by Product Format, 2020-2035
  • Table 17: North America Market Value (USD Billion) Forecast by Functional Claim, 2020-2035
  • Table 18: North America Market Volume (Mt Ton) Forecast by Functional Claim, 2020-2035
  • Table 19: North America Market Value (USD Billion) Forecast by Distribution Channel, 2020-2035
  • Table 20: North America Market Volume (Mt Ton) Forecast by Distribution Channel, 2020-2035
  • Table 21: Latin America Market Value (USD Billion) Forecast by Country, 2020-2035
  • Table 22: Latin America Market Volume (Mt Ton) Forecast by Country, 2020-2035
  • Table 23: Latin America Market Value (USD Billion) Forecast by Primary Ingredient, 2020-2035
  • Table 24: Latin America Market Volume (Mt Ton) Forecast by Primary Ingredient, 2020-2035
  • Table 25: Latin America Market Value (USD Billion) Forecast by Product Format, 2020-2035
  • Table 26: Latin America Market Volume (Mt Ton) Forecast by Product Format, 2020-2035
  • Table 27: Latin America Market Value (USD Billion) Forecast by Functional Claim, 2020-2035
  • Table 28: Latin America Market Volume (Mt Ton) Forecast by Functional Claim, 2020-2035
  • Table 29: Latin America Market Value (USD Billion) Forecast by Distribution Channel, 2020-2035
  • Table 30: Latin America Market Volume (Mt Ton) Forecast by Distribution Channel, 2020-2035
  • Table 31: Western Europe Market Value (USD Billion) Forecast by Country, 2020-2035
  • Table 32: Western Europe Market Volume (Mt Ton) Forecast by Country, 2020-2035
  • Table 33: Western Europe Market Value (USD Billion) Forecast by Primary Ingredient, 2020-2035
  • Table 34: Western Europe Market Volume (Mt Ton) Forecast by Primary Ingredient, 2020-2035
  • Table 35: Western Europe Market Value (USD Billion) Forecast by Product Format, 2020-2035
  • Table 36: Western Europe Market Volume (Mt Ton) Forecast by Product Format, 2020-2035
  • Table 37: Western Europe Market Value (USD Billion) Forecast by Functional Claim, 2020-2035
  • Table 38: Western Europe Market Volume (Mt Ton) Forecast by Functional Claim, 2020-2035
  • Table 39: Western Europe Market Value (USD Billion) Forecast by Distribution Channel, 2020-2035
  • Table 40: Western Europe Market Volume (Mt Ton) Forecast by Distribution Channel, 2020-2035
  • Table 41: Eastern Europe Market Value (USD Billion) Forecast by Country, 2020-2035
  • Table 42: Eastern Europe Market Volume (Mt Ton) Forecast by Country, 2020-2035
  • Table 43: Eastern Europe Market Value (USD Billion) Forecast by Primary Ingredient, 2020-2035
  • Table 44: Eastern Europe Market Volume (Mt Ton) Forecast by Primary Ingredient, 2020-2035
  • Table 45: Eastern Europe Market Value (USD Billion) Forecast by Product Format, 2020-2035
  • Table 46: Eastern Europe Market Volume (Mt Ton) Forecast by Product Format, 2020-2035
  • Table 47: Eastern Europe Market Value (USD Billion) Forecast by Functional Claim, 2020-2035
  • Table 48: Eastern Europe Market Volume (Mt Ton) Forecast by Functional Claim, 2020-2035
  • Table 49: Eastern Europe Market Value (USD Billion) Forecast by Distribution Channel, 2020-2035
  • Table 50: Eastern Europe Market Volume (Mt Ton) Forecast by Distribution Channel, 2020-2035
  • Table 51: East Asia Market Value (USD Billion) Forecast by Country, 2020-2035
  • Table 52: East Asia Market Volume (Mt Ton) Forecast by Country, 2020-2035
  • Table 53: East Asia Market Value (USD Billion) Forecast by Primary Ingredient, 2020-2035
  • Table 54: East Asia Market Volume (Mt Ton) Forecast by Primary Ingredient, 2020-2035
  • Table 55: East Asia Market Value (USD Billion) Forecast by Product Format, 2020-2035
  • Table 56: East Asia Market Volume (Mt Ton) Forecast by Product Format, 2020-2035
  • Table 57: East Asia Market Value (USD Billion) Forecast by Functional Claim, 2020-2035
  • Table 58: East Asia Market Volume (Mt Ton) Forecast by Functional Claim, 2020-2035
  • Table 59: East Asia Market Value (USD Billion) Forecast by Distribution Channel, 2020-2035
  • Table 60: East Asia Market Volume (Mt Ton) Forecast by Distribution Channel, 2020-2035
  • Table 61: South Asia & Pacific Market Value (USD Billion) Forecast by Country, 2020-2035
  • Table 62: South Asia & Pacific Market Volume (Mt Ton) Forecast by Country, 2020-2035
  • Table 63: South Asia & Pacific Market Value (USD Billion) Forecast by Primary Ingredient, 2020-2035
  • Table 64: South Asia & Pacific Market Volume (Mt Ton) Forecast by Primary Ingredient, 2020-2035
  • Table 65: South Asia & Pacific Market Value (USD Billion) Forecast by Product Format, 2020-2035
  • Table 66: South Asia & Pacific Market Volume (Mt Ton) Forecast by Product Format, 2020-2035
  • Table 67: South Asia & Pacific Market Value (USD Billion) Forecast by Functional Claim, 2020-2035
  • Table 68: South Asia & Pacific Market Volume (Mt Ton) Forecast by Functional Claim, 2020-2035
  • Table 69: South Asia & Pacific Market Value (USD Billion) Forecast by Distribution Channel, 2020-2035
  • Table 70: South Asia & Pacific Market Volume (Mt Ton) Forecast by Distribution Channel, 2020-2035
  • Table 71: Middle East and Africa Market Value (USD Billion) Forecast by Country, 2020-2035
  • Table 72: Middle East and Africa Market Volume (Mt Ton) Forecast by Country, 2020-2035
  • Table 73: Middle East and Africa Market Value (USD Billion) Forecast by Primary Ingredient, 2020-2035
  • Table 74: Middle East and Africa Market Volume (Mt Ton) Forecast by Primary Ingredient, 2020-2035
  • Table 75: Middle East and Africa Market Value (USD Billion) Forecast by Product Format, 2020-2035
  • Table 76: Middle East and Africa Market Volume (Mt Ton) Forecast by Product Format, 2020-2035
  • Table 77: Middle East and Africa Market Value (USD Billion) Forecast by Functional Claim, 2020-2035
  • Table 78: Middle East and Africa Market Volume (Mt Ton) Forecast by Functional Claim, 2020-2035
  • Table 79: Middle East and Africa Market Value (USD Billion) Forecast by Distribution Channel, 2020-2035
  • Table 80: Middle East and Africa Market Volume (Mt Ton) Forecast by Distribution Channel, 2020-2035

List of Figures

  • Figure 1: Global Market Volume (Mt Ton) Forecast 2020-2035
  • Figure 2: Global Market Pricing Analysis
  • Figure 3: Global Market Value (USD Billion) Forecast 2020-2035
  • Figure 4: Global Market Value Share and BPS Analysis by Primary Ingredient, 2025 and 2035
  • Figure 5: Global Market Y-o-Y Growth Comparison by Primary Ingredient, 2025-2035
  • Figure 6: Global Market Attractiveness Analysis by Primary Ingredient
  • Figure 7: Global Market Value Share and BPS Analysis by Product Format, 2025 and 2035
  • Figure 8: Global Market Y-o-Y Growth Comparison by Product Format, 2025-2035
  • Figure 9: Global Market Attractiveness Analysis by Product Format
  • Figure 10: Global Market Value Share and BPS Analysis by Functional Claim, 2025 and 2035
  • Figure 11: Global Market Y-o-Y Growth Comparison by Functional Claim, 2025-2035
  • Figure 12: Global Market Attractiveness Analysis by Functional Claim
  • Figure 13: Global Market Value Share and BPS Analysis by Distribution Channel, 2025 and 2035
  • Figure 14: Global Market Y-o-Y Growth Comparison by Distribution Channel, 2025-2035
  • Figure 15: Global Market Attractiveness Analysis by Distribution Channel
  • Figure 16: Global Market Value (USD Billion) Share and BPS Analysis by Region, 2025 and 2035
  • Figure 17: Global Market Y-o-Y Growth Comparison by Region, 2025-2035
  • Figure 18: Global Market Attractiveness Analysis by Region
  • Figure 19: North America Market Incremental $ Opportunity, 2025-2035
  • Figure 20: Latin America Market Incremental $ Opportunity, 2025-2035
  • Figure 21: Western Europe Market Incremental $ Opportunity, 2025-2035
  • Figure 22: Eastern Europe Market Incremental $ Opportunity, 2025-2035
  • Figure 23: East Asia Market Incremental $ Opportunity, 2025-2035
  • Figure 24: South Asia & Pacific Market Incremental $ Opportunity, 2025-2035
  • Figure 25: Middle East and Africa Market Incremental $ Opportunity, 2025-2035
  • Figure 26: North America Market Value Share and BPS Analysis by Country, 2025 and 2035
  • Figure 27: North America Market Value Share and BPS Analysis by Primary Ingredient, 2025 and 2035
  • Figure 28: North America Market Y-o-Y Growth Comparison by Primary Ingredient, 2025-2035
  • Figure 29: North America Market Attractiveness Analysis by Primary Ingredient
  • Figure 30: North America Market Value Share and BPS Analysis by Product Format, 2025 and 2035
  • Figure 31: North America Market Y-o-Y Growth Comparison by Product Format, 2025-2035
  • Figure 32: North America Market Attractiveness Analysis by Product Format
  • Figure 33: North America Market Value Share and BPS Analysis by Functional Claim, 2025 and 2035
  • Figure 34: North America Market Y-o-Y Growth Comparison by Functional Claim, 2025-2035
  • Figure 35: North America Market Attractiveness Analysis by Functional Claim
  • Figure 36: North America Market Value Share and BPS Analysis by Distribution Channel, 2025 and 2035
  • Figure 37: North America Market Y-o-Y Growth Comparison by Distribution Channel, 2025-2035
  • Figure 38: North America Market Attractiveness Analysis by Distribution Channel
  • Figure 39: Latin America Market Value Share and BPS Analysis by Country, 2025 and 2035
  • Figure 40: Latin America Market Value Share and BPS Analysis by Primary Ingredient, 2025 and 2035
  • Figure 41: Latin America Market Y-o-Y Growth Comparison by Primary Ingredient, 2025-2035
  • Figure 42: Latin America Market Attractiveness Analysis by Primary Ingredient
  • Figure 43: Latin America Market Value Share and BPS Analysis by Product Format, 2025 and 2035
  • Figure 44: Latin America Market Y-o-Y Growth Comparison by Product Format, 2025-2035
  • Figure 45: Latin America Market Attractiveness Analysis by Product Format
  • Figure 46: Latin America Market Value Share and BPS Analysis by Functional Claim, 2025 and 2035
  • Figure 47: Latin America Market Y-o-Y Growth Comparison by Functional Claim, 2025-2035
  • Figure 48: Latin America Market Attractiveness Analysis by Functional Claim
  • Figure 49: Latin America Market Value Share and BPS Analysis by Distribution Channel, 2025 and 2035
  • Figure 50: Latin America Market Y-o-Y Growth Comparison by Distribution Channel, 2025-2035
  • Figure 51: Latin America Market Attractiveness Analysis by Distribution Channel
  • Figure 52: Western Europe Market Value Share and BPS Analysis by Country, 2025 and 2035
  • Figure 53: Western Europe Market Value Share and BPS Analysis by Primary Ingredient, 2025 and 2035
  • Figure 54: Western Europe Market Y-o-Y Growth Comparison by Primary Ingredient, 2025-2035
  • Figure 55: Western Europe Market Attractiveness Analysis by Primary Ingredient
  • Figure 56: Western Europe Market Value Share and BPS Analysis by Product Format, 2025 and 2035
  • Figure 57: Western Europe Market Y-o-Y Growth Comparison by Product Format, 2025-2035
  • Figure 58: Western Europe Market Attractiveness Analysis by Product Format
  • Figure 59: Western Europe Market Value Share and BPS Analysis by Functional Claim, 2025 and 2035
  • Figure 60: Western Europe Market Y-o-Y Growth Comparison by Functional Claim, 2025-2035
  • Figure 61: Western Europe Market Attractiveness Analysis by Functional Claim
  • Figure 62: Western Europe Market Value Share and BPS Analysis by Distribution Channel, 2025 and 2035
  • Figure 63: Western Europe Market Y-o-Y Growth Comparison by Distribution Channel, 2025-2035
  • Figure 64: Western Europe Market Attractiveness Analysis by Distribution Channel
  • Figure 65: Eastern Europe Market Value Share and BPS Analysis by Country, 2025 and 2035
  • Figure 66: Eastern Europe Market Value Share and BPS Analysis by Primary Ingredient, 2025 and 2035
  • Figure 67: Eastern Europe Market Y-o-Y Growth Comparison by Primary Ingredient, 2025-2035
  • Figure 68: Eastern Europe Market Attractiveness Analysis by Primary Ingredient
  • Figure 69: Eastern Europe Market Value Share and BPS Analysis by Product Format, 2025 and 2035
  • Figure 70: Eastern Europe Market Y-o-Y Growth Comparison by Product Format, 2025-2035
  • Figure 71: Eastern Europe Market Attractiveness Analysis by Product Format
  • Figure 72: Eastern Europe Market Value Share and BPS Analysis by Functional Claim, 2025 and 2035
  • Figure 73: Eastern Europe Market Y-o-Y Growth Comparison by Functional Claim, 2025-2035
  • Figure 74: Eastern Europe Market Attractiveness Analysis by Functional Claim
  • Figure 75: Eastern Europe Market Value Share and BPS Analysis by Distribution Channel, 2025 and 2035
  • Figure 76: Eastern Europe Market Y-o-Y Growth Comparison by Distribution Channel, 2025-2035
  • Figure 77: Eastern Europe Market Attractiveness Analysis by Distribution Channel
  • Figure 78: East Asia Market Value Share and BPS Analysis by Country, 2025 and 2035
  • Figure 79: East Asia Market Value Share and BPS Analysis by Primary Ingredient, 2025 and 2035
  • Figure 80: East Asia Market Y-o-Y Growth Comparison by Primary Ingredient, 2025-2035
  • Figure 81: East Asia Market Attractiveness Analysis by Primary Ingredient
  • Figure 82: East Asia Market Value Share and BPS Analysis by Product Format, 2025 and 2035
  • Figure 83: East Asia Market Y-o-Y Growth Comparison by Product Format, 2025-2035
  • Figure 84: East Asia Market Attractiveness Analysis by Product Format
  • Figure 85: East Asia Market Value Share and BPS Analysis by Functional Claim, 2025 and 2035
  • Figure 86: East Asia Market Y-o-Y Growth Comparison by Functional Claim, 2025-2035
  • Figure 87: East Asia Market Attractiveness Analysis by Functional Claim
  • Figure 88: East Asia Market Value Share and BPS Analysis by Distribution Channel, 2025 and 2035
  • Figure 89: East Asia Market Y-o-Y Growth Comparison by Distribution Channel, 2025-2035
  • Figure 90: East Asia Market Attractiveness Analysis by Distribution Channel
  • Figure 91: South Asia & Pacific Market Value Share and BPS Analysis by Country, 2025 and 2035
  • Figure 92: South Asia & Pacific Market Value Share and BPS Analysis by Primary Ingredient, 2025 and 2035
  • Figure 93: South Asia & Pacific Market Y-o-Y Growth Comparison by Primary Ingredient, 2025-2035
  • Figure 94: South Asia & Pacific Market Attractiveness Analysis by Primary Ingredient
  • Figure 95: South Asia & Pacific Market Value Share and BPS Analysis by Product Format, 2025 and 2035
  • Figure 96: South Asia & Pacific Market Y-o-Y Growth Comparison by Product Format, 2025-2035
  • Figure 97: South Asia & Pacific Market Attractiveness Analysis by Product Format
  • Figure 98: South Asia & Pacific Market Value Share and BPS Analysis by Functional Claim, 2025 and 2035
  • Figure 99: South Asia & Pacific Market Y-o-Y Growth Comparison by Functional Claim, 2025-2035
  • Figure 100: South Asia & Pacific Market Attractiveness Analysis by Functional Claim
  • Figure 101: South Asia & Pacific Market Value Share and BPS Analysis by Distribution Channel, 2025 and 2035
  • Figure 102: South Asia & Pacific Market Y-o-Y Growth Comparison by Distribution Channel, 2025-2035
  • Figure 103: South Asia & Pacific Market Attractiveness Analysis by Distribution Channel
  • Figure 104: Middle East and Africa Market Value Share and BPS Analysis by Country, 2025 and 2035
  • Figure 105: Middle East and Africa Market Value Share and BPS Analysis by Primary Ingredient, 2025 and 2035
  • Figure 106: Middle East and Africa Market Y-o-Y Growth Comparison by Primary Ingredient, 2025-2035
  • Figure 107: Middle East and Africa Market Attractiveness Analysis by Primary Ingredient
  • Figure 108: Middle East and Africa Market Value Share and BPS Analysis by Product Format, 2025 and 2035
  • Figure 109: Middle East and Africa Market Y-o-Y Growth Comparison by Product Format, 2025-2035
  • Figure 110: Middle East and Africa Market Attractiveness Analysis by Product Format
  • Figure 111: Middle East and Africa Market Value Share and BPS Analysis by Functional Claim, 2025 and 2035
  • Figure 112: Middle East and Africa Market Y-o-Y Growth Comparison by Functional Claim, 2025-2035
  • Figure 113: Middle East and Africa Market Attractiveness Analysis by Functional Claim
  • Figure 114: Middle East and Africa Market Value Share and BPS Analysis by Distribution Channel, 2025 and 2035
  • Figure 115: Middle East and Africa Market Y-o-Y Growth Comparison by Distribution Channel, 2025-2035
  • Figure 116: Middle East and Africa Market Attractiveness Analysis by Distribution Channel
  • Figure 117: Global Market - Tier Structure Analysis
  • Figure 118: Global Market - Company Share Analysis

Frequently Asked Questions

What is the expected market size of the dairy-free spreads market by 2035?

The industry is projected to reach USD 9.02 billion by 2035.

How much CAGR will the dairy-free spreads market register from 2025 to 2035?

The industry will expand at a CAGR of 7.4% during the forecast period.

What share will buttery spreads hold in the dairy-free spreads market in 2025?

Buttery spreads are expected to account for approximately 62.4% in 2025.

What is the projected share of legume-based ingredients in the dairy-free spreads market by 2025?

Legume-based spreads will contribute around 33.3% to the industry in 2025.

Which country leads growth in the dairy-free spreads market with the highest CAGR?

India leads the industry with a CAGR of 5.8% from 2025 to 2035.

Explore Similar Insights

Future Market Insights

Dairy-Free Spreads Market