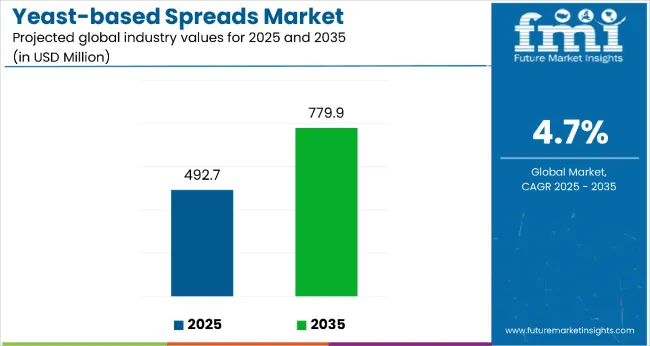
The yeast-based spreads market is estimated to be valued at USD 492.7 million in 2025 and is projected to reach USD 779.9 million by 2035, registering a compound annual growth rate (CAGR) of 4.7% over the forecast period. The market is projected to add an absolute dollar opportunity of approximately USD 0.29 billion over the forecast period. This reflects a 1.58 times growth at a compound annual growth rate of 4.7%. The market’s evolution is expected to be shaped by rising demand for plant-based nutrition, umami-rich flavor enhancers, and natural vitamin B sources, particularly where health-conscious consumption dominates.
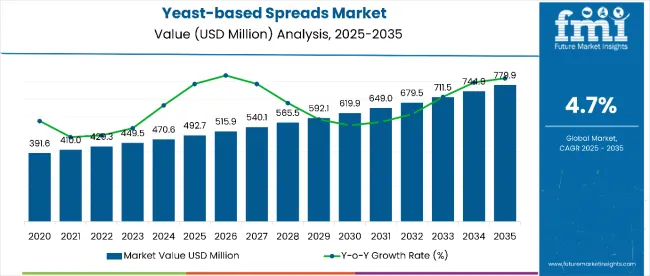
By 2030, the market is likely to reach approximately USD 0.6 billion, accounting for USD 0.1 billion in incremental value over the first half of the decade. The remaining USD 0.2 billion is expected during the second half, suggesting a moderately back-loaded growth pattern. Product innovation around organic formulations and clean-label variants is gaining traction due to yeast extracts’ favorable nutritional profile and natural umami enhancement properties.
Companies such as Unilever and Bega Cheese are advancing their competitive positions through investment in organic production technologies and certified ingredient sourcing systems. Health-focused procurement models are supporting expansion into plant-based nutrition, functional food applications, and premium organic product segments. Market performance will remain anchored in regulatory compliance, nutritional validation, and ingredient quality benchmarks.
The yeast-based spreads market holds approximately 38% of the savory spreads market, driven by its umami flavor profile, vitamin B content, and suitability for plant-based diets and health-conscious consumption. It accounts for around 32% of the functional food condiments market, supported by its natural glutamic acid content and nutritional enhancement properties.
The market contributes nearly 28% to the specialty yeast products market, particularly for bakery applications, flavor enhancement, and dietary supplement uses. It holds close to 24% of the plant-based protein spreads market, where yeast extracts are used for nutritional fortification and taste enhancement. The share in the organic condiments market reaches about 35%, reflecting its preference among manufacturers seeking natural alternatives to synthetic flavor enhancers in premium food formulations.
The market is undergoing structural change driven by rising demand for plant-based nutrition and clean-label food products. Advanced production methods using organic yeast cultivation and natural extraction processes have enhanced nutritional profiles, flavor consistency, and shelf stability, making yeast-based spreads a viable alternative to synthetic condiments and artificial flavor enhancers.
Manufacturers are introducing organic variants and specialized formulations tailored for vegan, vegetarian, and health-conscious consumers, expanding their role beyond traditional breakfast applications. Strategic collaborations between food manufacturers and health brands have accelerated adoption in functional food products. Online retail channels have widened consumer access and awareness, reshaping traditional distribution patterns and supporting premium product positioning.
Yeast-based spreads’ proven nutritional benefits, natural umami flavor enhancement, and high vitamin B content make them an attractive alternative to synthetic condiments and artificial flavor enhancers in health-conscious food consumption.
Growing awareness of plant-based nutrition and functional foods is further propelling adoption, especially among vegan and vegetarian consumers seeking natural protein sources and vitamin supplementation. Consumer demand for clean-label products, along with innovations in organic production and verified ingredient sourcing, are also enhancing product quality and market appeal.
As global food trends continue to prioritize health and natural ingredients, the market outlook remains favorable. With consumers and manufacturers prioritizing nutritional value, plant-based alternatives, and umami flavor enhancement, yeast-based spreads are well-positioned to expand across various food applications and demographic segments.
The market is segmented by product type, nature, end use, claims, and region. By product type, the market includes Aussiemite, Cenovis, Marmite, Marmite (New Zealand), Oxo (food), Promite, Vegemite, Vitam-R, and others. Based on nature, the market is divided into organic, non-GMO, and conventional.
In terms of end use, the market is characterized into food services (hotels, restaurants, and cafes) and business-to-consumer (hypermarkets/supermarkets, convenience stores, mom & pop stores, discount stores, food specialty stores, independent small groceries, online retail, and other retail formats). By claims, the market is segmented into vegan, vegetarian, gluten-free, dairy-free, halal, natural, kosher, fat-free, and others. Regionally, the market is analyzed across North America, Latin America, Europe, East Asia, South Asia, Oceania, and the Middle East and Africa.
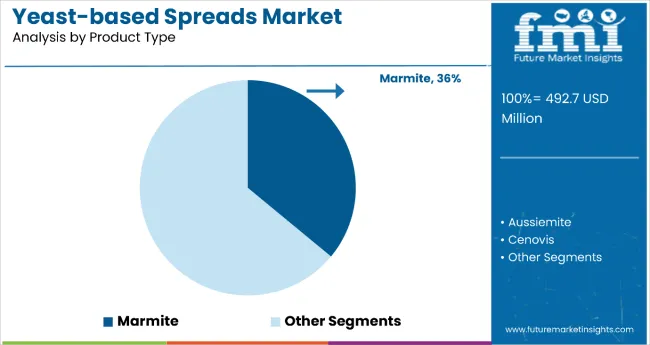
The Marmite segment holds a leading 36% share in the product type category, reflecting its strong brand recognition, established market presence, and Unilever’s effective marketing strategies. Marmite is increasingly preferred due to its distinctive flavor profile, nutritional benefits, and cultural significance in key markets like the United Kingdom and Australia.
The segment benefits from rising consumer familiarity with the brand and its proven health benefits, including high vitamin B content and natural umami properties. Unilever continues to invest in product innovation and marketing campaigns that emphasize Marmite’s unique nutritional advantages and versatile culinary applications.
As consumer awareness of functional foods increases and plant-based nutrition gains mainstream acceptance, Marmite’s role as a leading yeast-based spread is expected to strengthen, supporting steady market share retention despite increasing competition from organic and specialty variants.
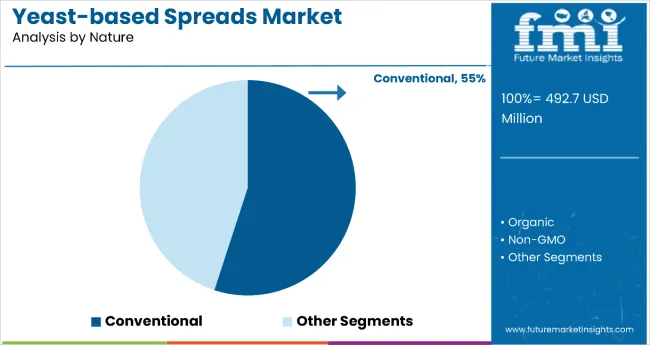
The conventional segment dominates the nature category with a 55% market share, driven by widespread availability, competitive pricing, and established consumer familiarity with yeast-based spreads containing traditional ingredients, including preservatives and synthetic additives. Conventional yeast-based spreads are preferred by cost-conscious consumers seeking affordable and long-lasting products.
The segment continues to benefit from strong distribution networks and brand loyalty, particularly in regions where organic certifications are less prevalent or where price sensitivity is higher. Manufacturers are optimizing formulations to reduce artificial components while maintaining shelf stability, catering to evolving consumer preferences without fully transitioning to organic standards.
As demand for clean-label products grows, the conventional segment faces increasing competition but maintains steady sales due to its accessibility and convenience. Regulatory frameworks for food safety support the continued presence of conventional spreads, especially in emerging markets.
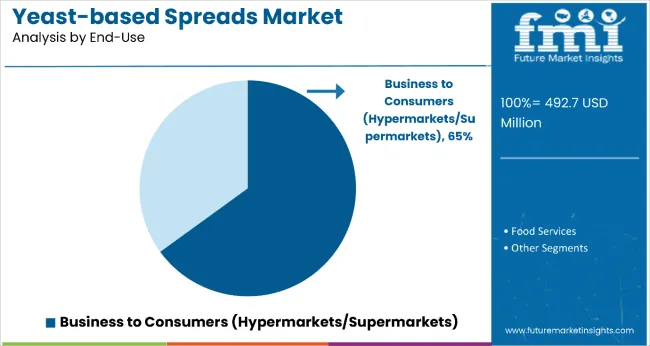
The business-to-consumer segment accounts for 65% of the end-use category, reflecting the primary retail nature of yeast-based spreads consumption and direct consumer purchasing patterns. Home consumption drives the majority of market demand, with consumers incorporating these products into daily meal preparation and snacking routines.
Manufacturers are enhancing retail capabilities within this segment by developing convenient packaging formats, extended shelf-life formulations, and targeted marketing strategies for household consumers across different age groups and dietary preferences.
The segment’s sustained dominance is supported by its alignment with home cooking trends and meal customization preferences. With increasing consumer interest in functional foods and plant-based nutrition, business-to-consumer distribution channels are positioned for continued expansion across multiple retail formats and geographic markets.
From 2025 to 2035, food manufacturers are adopting clean-label ingredient strategies to strengthen product positioning, improve nutritional profiles, and address consumer transparency demands. This shift positions yeast extract suppliers offering organic and naturally sourced materials as key partners for premium brands focused on health-oriented product development and regulatory compliance.
Rising Plant-Based Nutrition Awareness Drives Yeast-Based Spreads Market Growth
The growing adoption of plant-based diets and consumer preference for natural nutrition sources has emerged as a primary growth driver. In 2024, studies validating the health benefits of B vitamins and umami flavor enhancement prompted wider use of yeast-based spreads in daily diets. By 2025, manufacturers are expected to diversify product portfolios with fortified formulations and organic variants to meet increasing demand from health-conscious consumers.
These developments indicate that consistent adoption of health-driven diets, rather than short-term trends, is fueling sustained market growth. Brands delivering nutritionally rich, high-quality yeast-based spreads with proven benefits are positioned to capture long-term consumer loyalty and secure competitive advantage.
Regulatory Compliance and Price Sensitivity Restrain Market Expansion
Despite growing interest, the yeast-based spreads market faces challenges such as strict regulatory requirements for organic certification and clean-label compliance, which increase operational costs and extend product development timelines. Price sensitivity among consumers in emerging markets further limits adoption of premium variants, especially in low-income segments.
Fluctuating raw material costs associated with yeast extract sourcing create margin pressures for manufacturers. These constraints compel companies to optimize supply chain efficiencies and adopt cost-effective clean-label solutions without compromising product quality.
Clean-Label Product Innovation Creates Market Expansion Opportunity
In 2024, food brands began prioritizing transparency in ingredient sourcing and product formulation, enhancing consumer trust and reinforcing brand value. By 2025, organic certification and clean-label principles are becoming integral to new product development, ensuring real-time verification of nutritional claims.
These trends demonstrate that clean-label innovation significantly improves market acceptance and brand equity. Companies introducing organic yeast-based spreads with verified nutritional benefits and transparent sourcing practices are well-positioned to capture premium segments and strengthen consumer confidence in competitive retail environments.
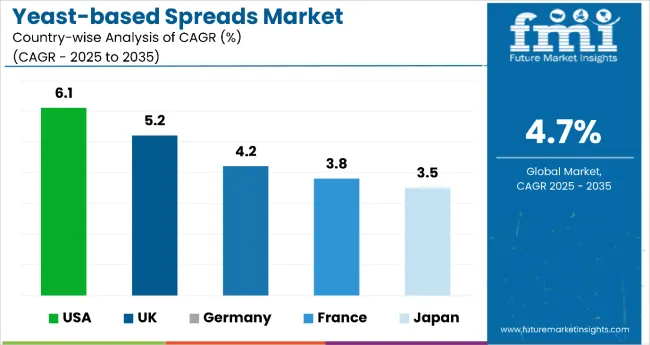
| Countries | CAGR 2025 to 2035 |
|---|---|
| USA | 6.1% |
| UK | 5.2% |
| Germany | 4.2% |
| France | 3.8% |
| Japan | 3.5% |
Among the key countries analyzed, the USA is projected to lead the yeast-based spreads market with the highest CAGR of 6.1% through 2035, driven by strong demand for plant-based, fortified, and clean-label products. The UK follows with a 5.2% CAGR, supported by entrenched brand loyalty and expanding culinary uses.
Germany’s market is forecast to grow at 4.2%, bolstered by its robust organic food infrastructure. France shows a more modest CAGR of 3.8%, influenced by gourmet culinary trends. Japan lags slightly with a 3.5% CAGR, where growth is slower but steady, aligned with premiumization and health-focused consumption preferences.
The report covers an in-depth analysis of 40+ countries; five top-performing OECD countries are highlighted below.
The USA yeast-based spreads market is projected to expand at a CAGR of 6.1% through 2035, driven by rising demand for plant-based diets, fortified foods, and growing awareness of vitamin B complex deficiencies. Urban millennials and Gen Z consumers are adopting yeast spreads as convenient, nutrient-dense additions to breakfast and snack routines. Manufacturers are launching fortified and clean-label variants to cater to health-conscious demographics and food-allergic consumers.
The yeast-based spreads market in the UK is anticipated to grow at 5.2%, shaped by established cultural familiarity with Marmite and strong consumer loyalty to traditional yeast-based spreads. British consumers are expanding usage beyond traditional breakfast applications into cooking and baking applications. Growing plant-based diet adoption supports continued market expansion among health-conscious and environmentally aware consumers.
The sales of yeast-based spreads in Germany are slated to rise at a 4.2% CAGR, driven by strong organic food regulations and consumer preference for natural, minimally processed food products. Premium health food retailers are incorporating organic yeast spreads into specialty product categories targeting health-conscious and environmentally aware consumers. Strong regulatory framework supports quality assurance and ingredient safety standards.
The revenue from yeast-based spreads in France is estimated to expand at 3.8% CAGR, supported by gourmet food culture and increasing interest in international specialty condiments. French consumers are incorporating yeast-based spreads into artisanal food preparations and gourmet cooking applications. Focus on culinary innovation and premium food experiences supports market expansion in urban food service and retail segments.
The yeast-based spreads market in Japan is expected to witness a CAGR of 3.5% through 2035, driven by rising demand for clean-label, umami-rich condiments that align with traditional taste profiles and modern health trends. Japanese consumers are showing a growing interest in organic and fortified yeast-based spreads, particularly those offering natural B-vitamin content and low-sodium formulations. Food manufacturers are innovating with local flavor infusions and premium packaging to appeal to health-conscious and gourmet-oriented demographics.
The yeast-based spreads market is moderately consolidated, featuring established food manufacturers with significant brand recognition and regional market expertise. Unilever Plc. leads through its Marmite brand, leveraging global distribution networks, strong marketing capabilities, and established consumer loyalty in key markets like the United Kingdom and Australia.
Bega Cheese and Sanitarium Health & Wellbeing differentiate through regional specialization and health-focused positioning, offering products tailored to local taste preferences and nutritional requirements. AussieMite and other regional players focus on organic formulations and premium market segments, addressing growing demand for clean-label and functionally enhanced food products.
Established food companies such as Mars Foods and Nature’s Blend emphasize product innovation and diversified distribution channels to maintain competitive positioning across different market segments. Meanwhile, specialty producers like All Natural Foods of Stirling and Three Threes Condiments are investing in organic production capabilities to capture premium market opportunities.
Entry barriers remain moderate, driven by challenges in brand building, distribution network establishment, and consumer taste preference development across different geographic markets. Competitiveness increasingly depends on brand recognition, distribution capabilities, and the ability to meet evolving consumer preferences for organic, clean-label, and nutritionally enriched food products.
Key Developments in Yeast-Based Spreads Market
Unilever reported 3.4% underlying sales growth in H1 2025, supported by strong gross margins and brand investment. Turnover declined 3.2% due to currency and disposals. EPS dipped slightly, while productivity savings reached € 650 Million. Ice Cream separation was completed, with a demerger set for November. Growth focus targets the USA, India, and premium segments.
| Item | Value |
|---|---|
| Quantitative Units | USD 492.7 million |
| Product Type | Aussiemite, Cenovis, Marmite, Marmite (New Zealand), Oxo (food), Promite, Vegemite, Vitam -R, and Others |
| Nature | Organic, Non-GMO, and Conventional |
| End Use | Food Services (Hotels, Restaurants, Cafes) and Business to Consumers (Hypermarkets/Supermarkets, Convenience Stores, Mom & Pop Stores, Discount Stores, Food Specialty Stores, Independent Small Groceries, Online Retail, Other Retail Formats) |
| Claims | Vegan, Vegetarian, Gluten-Free, Dairy-Free, Halal, Natural, Kosher, Fat-Free, and Others |
| Regions Covered | North America, Latin America, Europe, East Asia, South Asia, Oceania, and Middle East and Africa |
| Country Covered | United States, Canada, United Kingdom, Germany, France, China, Japan, South Korea, Brazil, Australia, and 40+ countries |
| Key Companies Profiled | All Natural Foods of Stirling, AussieMite, Bega Cheese, Jardox Ltd., Marmite (New Zealand), Mars Foods, Nature’s Blend, Sanitarium Health & Wellbeing, Three Threes Condiments Pty. Ltd., Unilever Plc., and VITAM |
| Additional Attributes | Dollar sales by product type and nature segment, growing usage in plant-based nutrition and functional food applications for health-conscious consumers, stable demand in traditional breakfast and culinary applications, innovations in organic production and clean-label formulations improve nutritional profiles, taste consistency, and consumer appeal |
The global yeast-based spreads market is estimated to be valued at USD 492.7 billion in 2025.
The market size for the yeast-based spreads market is projected to reach USD 779.9 billion by 2035.
The yeast-based spreads market is expected to grow at a 4.7% CAGR between 2025 and 2035.
The key product types in yeast-based spreads market are aussiemite, cenovis, marmite, oxo, promite, vegemite and vitam-r.
In terms of nature, organic segment to command 54.3% share in the yeast-based spreads market in 2025.


Full Research Suite comprises of:
Market outlook & trends analysis
Interviews & case studies
Strategic recommendations
Vendor profiles & capabilities analysis
5-year forecasts
8 regions and 60+ country-level data splits
Market segment data splits
12 months of continuous data updates
DELIVERED AS:
PDF EXCEL ONLINE
Demand for Yeast-Based Spreads in EU Size and Share Forecast Outlook 2025 to 2035
Spreads Market Size and Share Forecast Outlook 2025 to 2035
Spreads and Toppings Packaging Market Trends – Growth & Forecast 2025 to 2035
Dips and Spreads Market Size and Share Forecast Outlook 2025 to 2035
Dairy-Free Spreads Market Analysis - Size, Share, and Forecast Outlook 2025 to 2035
Demand for Plant-based Cheese & Spreads in CIS Size and Share Forecast Outlook 2025 to 2035

Thank you!
You will receive an email from our Business Development Manager. Please be sure to check your SPAM/JUNK folder too.
Chat With
MaRIA