The Ingredients Market for Plant-based Food & Beverages is estimated to be valued at USD 3.0 billion in 2025 and is projected to reach USD 12.3 billion by 2035, registering a compound annual growth rate (CAGR) of 15.0% over the forecast period.
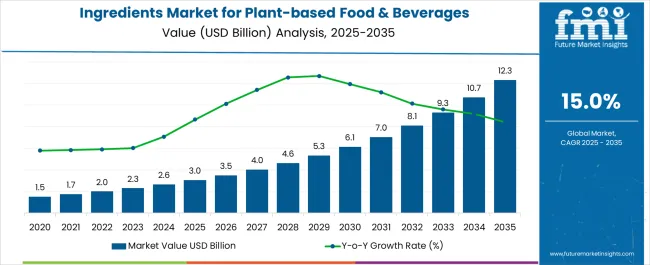
| Metric | Value |
|---|---|
| Ingredients Market for Plant-based Food & Beverages Estimated Value in (2025 E) | USD 3.0 billion |
| Ingredients Market for Plant-based Food & Beverages Forecast Value in (2035 F) | USD 12.3 billion |
| Forecast CAGR (2025 to 2035) | 15.0% |
The ingredients market for plant based food and beverages is expanding rapidly due to shifting consumer preferences toward healthier diets, rising lactose intolerance cases, and increasing awareness of environmental sustainability. Demand for plant based alternatives is being accelerated by investments in product innovation, particularly in functional ingredients that enhance taste, texture, and nutritional value.
Probiotic enriched formulations are gaining traction as consumers seek digestive health benefits and immune system support from plant based products. Advances in fermentation technology, clean label formulations, and fortification methods have expanded the scope of ingredient applications in dairy alternatives, functional drinks, and plant based snacks.
Additionally, the growing influence of vegan and flexitarian lifestyles, alongside strong support from retail distribution channels, is reinforcing this market’s growth trajectory. The long term outlook remains positive as both startups and established players focus on scaling innovation to meet diverse consumer expectations in the health and wellness space.
The market is segmented by Product Type and region. By Product Type, the market is divided into Probiotics, Phytochemicals, Protein & Amino Acids, Enzymes, Fatty Acids, Prebiotics, Vitamin, Specialty Carbohydrates, Fibers, and Minerals. Regionally, the market is classified into North America, Latin America, Western Europe, Eastern Europe, Balkan & Baltic Countries, Russia & Belarus, Central Asia, East Asia, South Asia & Pacific, and the Middle East & Africa.
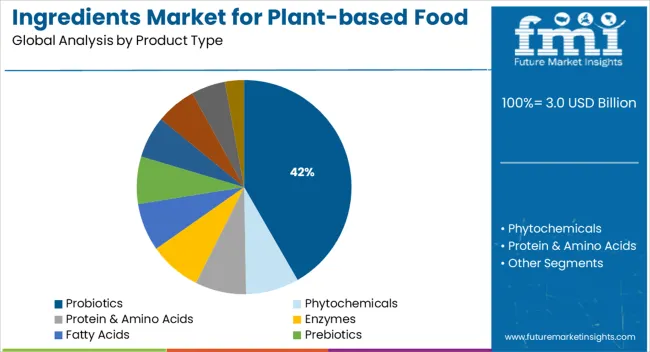
The probiotics segment is expected to account for 41.70% of the total market revenue by 2025 within the product type category, positioning it as the leading segment. This is being driven by heightened consumer demand for functional foods that promote digestive wellness, immunity enhancement, and overall gut health.
The compatibility of probiotics with a wide range of plant based beverages such as dairy alternatives and fortified juices has further supported their widespread adoption. Advances in microencapsulation and stability enhancing technologies have enabled longer shelf life and improved viability of probiotic strains in plant based matrices.
In addition, strong consumer trust in probiotic backed health claims has bolstered demand, while collaborations between food manufacturers and biotechnology firms have accelerated new product launches. As a result, probiotics continue to dominate the product type category, reinforcing their role as a key differentiator in the plant based food and beverage industry.
The rising fast-paced lifestyle, workaholic and busy schedules are shifting consumers' attention toward healthy food & beverages. The increasing prevalence of cardiovascular and other health-related diseases is surging the demand for plant-based food & beverage ingredients. Moreover, adopting functional food and Omega-3 fatty acids are influencing the ingredients market for plant-based food & beverages.
These food & beverages help to reduce cholesterol and triglyceride levels, increasing the market opportunities. As per a report by American Heart Association, around 8,00,000 people suffer from heart attacks in the United States annually. All these factors are influencing the global market and reducing the number of chronic diseases. Adopting ready-to-drink beverages with high proteins with organic plant-based ingredients increases market opportunities during the forecast period.
Adopting plant-based food & beverages also limit the chance of cancer, including cancer colon, diabetes and promotes weight loss. In addition, the patient's demand for plant-based food & beverage ingredients improve the lack of vitamins, protein, and essential fatty acids. These factors play a crucial role for disease patients and boost their healthy lifestyles. According to an article, vegan food & beverage ingredients consumers between the ages of 25 to 34 highly consume healthy vegan products.
| Attributes | Details |
|---|---|
| Market CAGR (2025 to 2035) | 15% |
| Market Valuation (2025) | USD 2.3 billion |
| Market Valuation (2035) | USD 9.30 billion |
According to Future Market Insights, the Ingredients Market for Plant-based Food & Beverage is predicted at a healthy 15% CAGR during the forecast period. Historically, the market registered a CAGR of 14.1% between 2020 and 2025.
The increasing number of vegans, ready-to-eat and ready-to-drink products are increasing consumers' awareness of healthy food & beverages in recent years. These consumers are fueling the demand for clean-label and highly standardized products, surging the market opportunities.
Adopting antioxidant beverages and value-added items is enhancing the quality of drinks and expanding the market growth. Several top companies are innovating products by increasing the adoption of advanced technologies, which in turn fuels market growth.
Due to the COVID-19 waves, marketers faced considerable challenges in the global market. The manufacturers can only provide a small quantity of food & beverage ingredients due to a lack of raw materials. However, due to government rules & regulations, the global market shut down its business temporarily to maintain social distancing. Therefore, the distribution and supply chain need more raw materials.
Consumers are more conscious about their health and there is growing demand for a better alternative source for a healthy lifestyle. Therefore, the companies focused on consumers' requirements for healthy diets, such as vegan and immunity booster supplements, are expected to surge the market growth. After the pandemic, the global market started growing, with consumers' popularity of vegan products increasing significantly.
Short Term (2025 to 2029): Increasing demand for high-quality, rich vitamins and organic foods, increasing the adoption of plant-based food & beverage ingredients.
Medium Term (2029 to 2035): Rising consumer preference, disposable income, and healthy lifestyle propel the market expansion.
Long Term (2035 to 2035): Manufacturers are launching healthy product items in the food & beverages to attract fitness freak consumers driving market opportunities.
The market is estimated to reach USD 1.50 billion during the forecast period. Historically, the market stood at USD 2.02 billion from 2020 to 2025.
Based on product type, probiotics dominate the global market by securing a high share during the forecast period. There is an increasing demand for vegan food & beverages for maintaining and influencing the body's immune system. Increasing the adoption of probiotics keeps harmful bacteria away, which creates digestion problems. Consumers are more conscious about their health, which drives their attention toward plant-based products.
Rising consumer problems related to lactose intolerance and improper digestion are increasing the demand for probiotics products. The popularity of vegan foods due to growing animal rights and environmental problems is increasing the adoption of probiotics products. Being a healthy substitute, consumers around the globe are boosting the demand for probiotics in recent times.
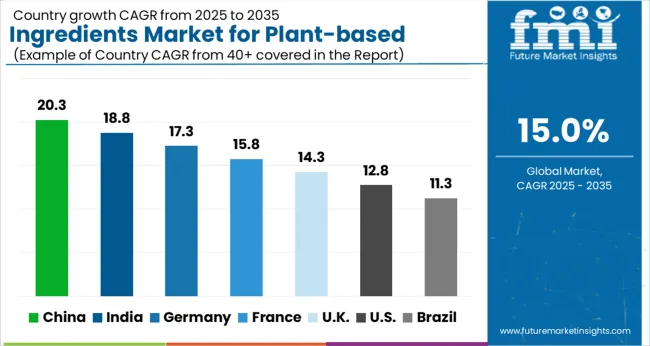
Asia Pacific is capturing a significant share of 14.5% of the global market during the forecast period. India and China are significantly growing the market due to increasing health awareness, disposable income, and demand for probiotics products. Growing innovative products, and advanced technologies, including microencapsulation, are driving the Asia Pacific ingredients market for plant-based food & beverages.
Manufacturers are developing better, highly standardized vegan products that are advancing the Asia Pacific market size. Growing population, urbanization, and rising consumer preference to avoid meat and high-cholesterol meals are increasing the adoption of plant-based food & beverage ingredients.
India is one of the prominent nations in producing vegan-based products due to the increasing vegan population. In India, around 30% of the population is entirely vegan, consequently driving market expansion. The key players are launching meat alternatives by launching plant-based meat and are influencing India's ingredients market for plant-based food & beverage. In Dec 2024, Evolved Food announced its plant-based protein and meat alternatives to promote a healthy lifestyle with excess protein.
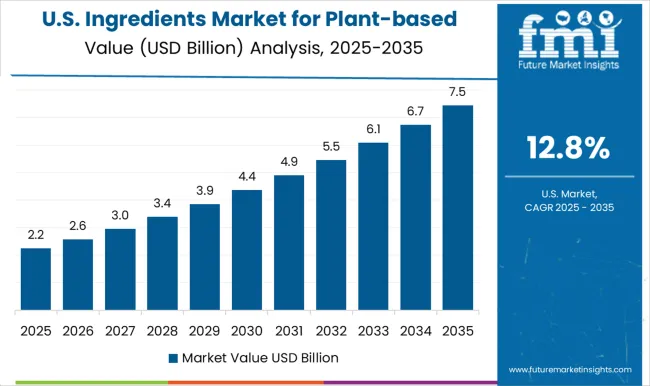
The United States is securing a maximum share of the global market during the forecast period. The rising demand for vegan foods and the popularity of vegan drinks drive the United States market size. Consumers are shifting their unhealthy lifestyles by increasing the adoption of plant-based food & beverage ingredients in the United States.
The rising demand for protein, low-fat, and vitamin-enriched products is fueling the demand for plant-based food & beverage ingredients. Moreover, innovations of plant-based meats, soya chunks, and dairy alternatives drive the United States ingredients market for plant-based food & beverages. The widespread dairy plant-based beverages such as pea, almond, rice, and hemp and oat milk further uplift the United States market.
The United Kingdom is registering a relevant global share during the forecast period. Increasing demand for plant-based products and dietary supplements drives the United Kingdom market. The manufacturers are developing newly launched plant-based products that add value and bring good taste for health-conscious consumers.
The rising heart-related issues and risk of stroke are increasing the adoption of plant-based food & beverage ingredients in the country. Furthermore, consumers' focus on the vegan diet and growing awareness of healthy plant-based food by various organizations fuel the United States' ingredients market for plant-based food & beverages.
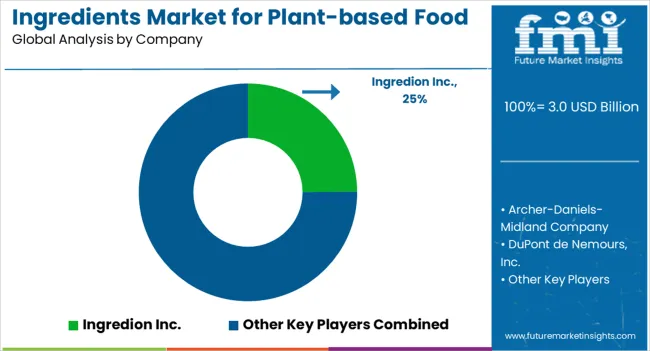
The market players are playing an essential role in the global market by capturing a maximum output by investing considerable amounts in research & development activities. These players are promoting vegan-based products for health by excluding low-quality lifestyles. The manufacturers are launching unique products through their market research and deep analysis.
The marketers focus on providing organic and natural food & beverages based on plants. Further, they provide probiotic and non-dairy beverages to capture consumers' attention. These players adopt a few marketing methodologies such as mergers, acquisitions, collaborations, partnerships, mergers, and agreements.
Recent Developments in the Ingredients Market for Plant-based Food & Beverages are:
| Attribute | Details |
|---|---|
| Forecast Period | 2025 to 2035 |
| Historical Data Available for | 2020 to 2025 |
| Market Analysis | USD billion for Value |
| Key Countries Covered | United States, Canada, Germany, United Kingdom, France, Italy, Spain, Russia, China, Japan, South Korea, India, Thailand, Malaysia, Indonesia, Australia, New Zealand, GCC Countries, Türkiye, Northern Africa, and South Africa |
| Key Segments Covered | Product Type, Region |
| Key Companies Profiled | Nestle SA; Conagra Brands Inc; Danone S.A.; Beyond Meat Inc; Tofutti Brands Inc; Kerry Group; BASF SE; Ingredion; Beneo GmbH; Ajinomoto; Chr. Hansen; Sugarlogix; Sensus B.V.; A & B Ingredients; Tate & Lyle; Foodchem International Corporation; Dupont Nutrition & Biosciences; Nutra Food Ingredients; Stratum Nutrition |
| Report Coverage | Market Forecast, Company Share Analysis, Competition Intelligence, DROT Analysis, Market Dynamics and Challenges, and Strategic Growth Initiatives |
| Customization & Pricing | Available upon Request |
The global ingredients market for plant-based food & beverages is estimated to be valued at USD 3.0 billion in 2025.
The market size for the ingredients market for plant-based food & beverages is projected to reach USD 12.3 billion by 2035.
The ingredients market for plant-based food & beverages is expected to grow at a 15.0% CAGR between 2025 and 2035.
The key product types in ingredients market for plant-based food & beverages are probiotics, phytochemicals, protein & amino acids, enzymes, fatty acids, prebiotics, vitamin, specialty carbohydrates, fibers and minerals.
In terms of , segment to command 0.0% share in the ingredients market for plant-based food & beverages in 2025.


Full Research Suite comprises of:
Market outlook & trends analysis
Interviews & case studies
Strategic recommendations
Vendor profiles & capabilities analysis
5-year forecasts
8 regions and 60+ country-level data splits
Market segment data splits
12 months of continuous data updates
DELIVERED AS:
PDF EXCEL ONLINE
Bean Ingredients Market Size and Share Forecast Outlook 2025 to 2035
Milk Ingredients Market Analysis - Size, Share, and Forecast Outlook 2025 to 2035
Malt Ingredients Market Analysis by Raw Material, Product Type, Grade, End-use, and Region through 2035
Aroma Ingredients Market Size and Share Forecast Outlook 2025 to 2035
Dairy Ingredients Market Size and Share Forecast Outlook 2025 to 2035
Pulse Ingredients Market Analysis – Size, Share, and Forecast 2025 to 2035
Smoke Ingredients for Food Market Analysis - Size, Share & Forecast 2025 to 2035
Bakery Ingredients Market Analysis - Size, Share, & Forecast Outlook 2025 to 2035
Biotin Ingredients Market Size and Share Forecast Outlook 2025 to 2035
Baking Ingredients Market Size and Share Forecast Outlook 2025 to 2035
Almond Ingredients Market Size, Growth, and Forecast for 2025 to 2035
Savory Ingredients Market Analysis – Size, Share, and Forecast Outlook 2025 to 2035
Examining Savory Ingredients Market Share & Industry Leaders
Energy Ingredients Market Analysis by Product Type and Application Through 2035
Perfume Ingredients Chemicals Market Size and Share Forecast Outlook 2025 to 2035
Vitamin Ingredients Market Size and Share Forecast Outlook 2025 to 2035
Alcohol Ingredients Market Analysis - Size, Share, and Forecast Outlook 2025 to 2035
Protein Ingredients Market Analysis - Size, Share, and Forecast 2025 to 2035
Caramel Ingredients Market Size, Growth, and Forecast for 2025 to 2035
Omega 3 Ingredients Market Trends - Health Benefits & Demand 2024 to 2034

Thank you!
You will receive an email from our Business Development Manager. Please be sure to check your SPAM/JUNK folder too.
Chat With
MaRIA