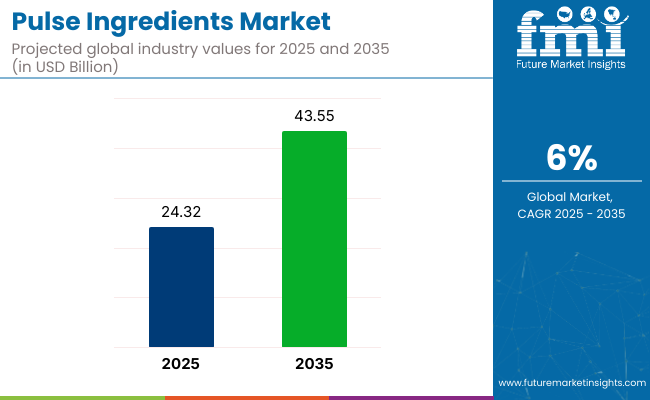
The global pulse ingredients market is valued at USD 24.32 billion in 2025 and is estimated to reach USD 43.55 billion by 2035, reflecting a CAGR of 6.0% during the forecast period.
| Attribute | Detail |
|---|---|
| Market Size (2025) | USD 24.32 billion |
| Market Size (2035) | USD 43.55 billion |
| CAGR (2025-2035) | 6.0% |
The growth of the pulse ingredients market is largely driven by the increasing consumer demand for plant-based, gluten-free, and nutritious food alternatives. Pulses, including lentils, chickpeas, peas, and beans, are widely recognized for their high protein, fiber, and mineral content, making them essential ingredients in various food and beverage applications.
The pulse ingredients market is expected to grow at a CAGR of 6.0% from 2025 to 2035. The USA is projected to maintain a substantial market share, with consistent growth throughout the forecast period. India is anticipated to be the fastest-growing market, with a 7.5% CAGR. Peas will lead the pulse type segment, holding a 35.9% market share in 2025, while the foodservice segment is predicted to capture 28.2% of the market. Cargill Inc. is the market leader, commanding a 20% market share. These trends highlight the growing adoption of pulse-based ingredients in food production globally.
The global pulse ingredients market is valued at USD 24.32 billion in 2025. In the plant-based protein ingredients market, pulses contribute approximately 35-40%, driven by their widespread use in meat substitutes, dairy alternatives, and protein-enriched foods. They hold around 15-18% of the vegetable ingredients market, owing to their fiber-rich, nutrient-dense profiles used across soups, snacks, and meal kits. In the functional food ingredients sector, pulses account for about 8-10%, supported by their benefits for heart health, digestion, and glycemic control. Within the clean-label and natural ingredients market, they represent 5-7%, preferred for their simplicity and whole-food appeal. In the animal feed and pet food ingredients market, pulses make up roughly 3-5%, particularly as sustainable plant-based alternatives to soy and corn in feed formulations.
In 2023, Cargill made a significant strategic move by acquiring Plant-Based Foods, enhancing its plant-based ingredient portfolio, particularly in pulse proteins. This acquisition strengthens Cargill’s market position as it taps into the growing consumer demand for sustainable, plant-based food solutions. In early 2024, AGT Food and Ingredients unveiled a cutting-edge processing technology designed to improve the texture and functionality of pulse-based ingredients. This innovation is expected to have a major impact on the market, as it allows for more versatile applications in food products ranging from snacks to plant-based proteins.
Additionally, in mid-2024, ADM entered a strategic partnership with Pulse Canada to integrate new pulse extraction technologies aimed at boosting production efficiency while minimizing waste. These acquisitions, mergers, and technological innovations are setting the stage for significant market growth, as leading players position themselves to meet the rising demand for clean-label, plant-based, and allergen-free ingredients.
The pulse ingredients market in 2025 shows measurable differences in per-capita intake across regions. Germany, Canada, and parts of Southeast Asia report moderate intake through bakery applications, blended flours, and snack formulations.
Trade activity reflects sourcing needs. Canada and Australia continue supplying pulse protein, flour, and fiber to Asia and the EU. The USA and Europe meet most foodservice needs locally, though selected isolates and starches still enter through international ports.
Pulses and pulse‑based ingredients must comply with strict safety, purity, and labeling requirements to ensure consumer protection and facilitate international trade. Compliance is critical for both domestic marketing and exports.
To meet demand for clean and sustainable sourcing, organic and environmental certifications are essential for accessing premium markets in India, the USA, and the EU.
Facilities handling pulse ingredients must maintain certified systems to ensure safety, traceability, and compliance with specialty product requirements.
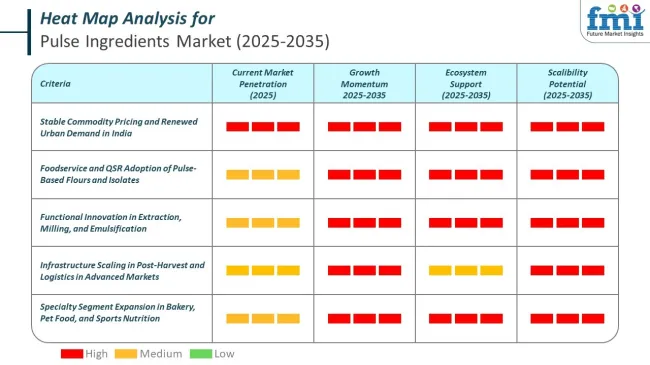
The pulse ingredients market is expanding due to rising demand for plant-based, protein-rich foods. By 2025, protein solutions will capture 25% market share, peas will lead with 35.9%, and food service applications will contribute 28.2%, driven by clean-label trends, health awareness, and increased use in commercial food preparations.
The protein solution segment is expected to capture a 25% market share in the pulse ingredients market by 2025.
Peas, including green peas, yellow peas, and chickpeas, are projected to hold 35.9% of the pulse ingredients market in 2025.
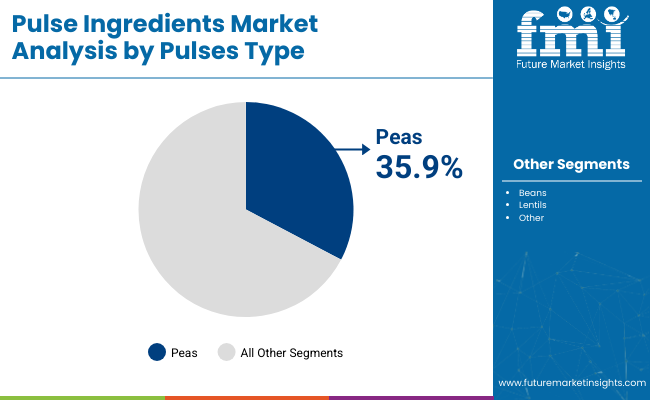
| Pulses Type | Share (2025) |
|---|---|
| Peas | 35.9% |
The food service segment is expected to hold 28.2% of the pulse ingredients market by 2025.
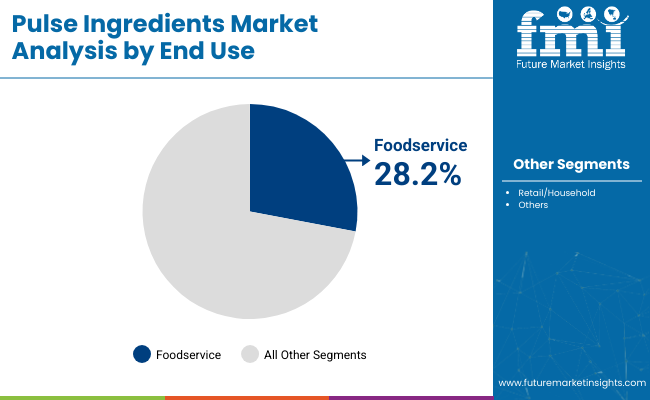
| End Use | Share (2025) |
|---|---|
| Peas | 28.2% |
The below table presents a comparative assessment of the variation in CAGR over six months for the base year (2024) and current year (2025) for the global Pulse Ingredients market. This analysis reveals crucial shifts in performance and indicates revenue realization patterns, thus providing stakeholders with a better vision of the growth trajectory over the year. The first half of the year, or H1, spans from January to June. The second half, H2, includes the months from July to December.
| Particular | Value CAGR |
|---|---|
| H1(2024 to 2034) | 5.8% |
| H2(2024 to 2034) | 6.0% |
| H1(2025 to 2035) | 6.1% |
| H2(2025 to 2035) | 6.0% |
In the first half (H1) from 2024 to 2034, the business is predicted to surge at a CAGR of 5.8%, followed by a slightly stronger growth rate of 6% in the second half (H2) during the forecast period.
Moving into the subsequent period, from H1 2025 to H2 2035, the CAGR is projected to increase to 6.1% in the first half and remain considerably strong at 6.0% in the second half. In the first half (H1), the sector witnessed an increase of 15 BPS, while in the second half (H2), the business witnessed a decrease of 10 BPS.
Growth of Premium Pet Food Market Boosting Demand for Processed Pulse Products
The rise in pet ownership and humanization has led to an increase in demand for premium pet food. Consumer awareness about products that pets consume is at an all-time high. Consumers are willing to provide their pets with the utmost care and the best quality of food products that they can offer despite facing economic challenges. Consumers want to give their pets highly nutritious pet food for proper growth and a healthy life.
This is observed more in developed countries. Thus, many manufacturers are offering premium pet food and are customizing pet food with the latest advancements to meet the changing market demands. On the back of these factors, the demand for natural and plant-based ingredients to improve the palatability of pet food products is expected to increase.
Pulses are a rich source of proteins. Protein is crucial in dogs’ and cats’ diets as it is used to repair, maintain, and grow a dog or cat’s muscles and cells. The use of pulses is increasing rapidly among pet food manufacturers.
Yellow Pea in Animal Nutrition Products is anticipated to boost the Sales of Pulse Ingredients.
Since the last decade, yellow peas have significantly been used in place of wheat, beet pulp, soy, and corn fibers in pet foods. Yellow pea, which is used in pet food, primarily has a bland taste that doesn’t affect the palatability of the pet food. According to PetfoodIndustry.com, In pet foods, yellow pea is used as nutritionally functional fiber due to laxation effects associated with water holding capacity (nearly 13ml water per gram of yellow pea) of the insoluble fiber.
Yellow pea is a filler that is added by inexpensive mass-markers to pet food products for various reasons. However, none of these reasons are related to providing appropriate nutrition for pets. It is high in crude fiber but low in fat. This renders it a useful element for calorie reduction in weight control and low-fat pet meals.
Immense Market Potential for Protein & Nutrition Bars Segment
There is an increasing consumer awareness for processed lentil products amongst health-conscious end users, especially those consumers who consume sports nutrition products daily. Lentil processed products like protein solutions have gained traction in the market for being better and healthier than conventional proteins. Also, many consumers are switching over to a more leisurely lifestyle and focusing on boosting their health performance.
Lentil protein has a positive perception amongst consumers regarding health benefits, and this is a major driving force for the growth of the market in regions like the USA, UK, Brazil, Germany, and Japan. Hence, manufacturers have a great growth opportunity for developing new products with lentil protein, which is the vanguard of the plant protein vertical in the nutrition industry.
Tier 1 Companies are referred to as the major players of the industry as they are fully established worldwide with majority shares of the business ecosystem. Industry leaders always lead the level of creativity, research, and development and most of the time are the trendsetters.
The companies are concentrating their research & development (R&D) efforts on the development of innovations in pulse product types. As a result, numerous organic strategies have been implemented in the market, such as new product developments and capacity expansions.
Tier 2 Companies are the regional players with adequate market coverage and are known for offering niche products. They are typically more localized and address specific issues of more general ones.
Tier 3 Companies are smaller players who are usually limited to the local or regional areas. They tend to service localized areas and do not possess the same level of R&D as bigger companies but are nonetheless helpful in satisfying local needs. These companies are smaller in size but remain strong in their target industries owing to their deep-rooted innovations and customer service.
The following table shows the estimated growth rates of the top three territories. China and Japan are set to exhibit high consumption, recording CAGRs of 7.7% and 4.9%, respectively, from 2025 to 2035.
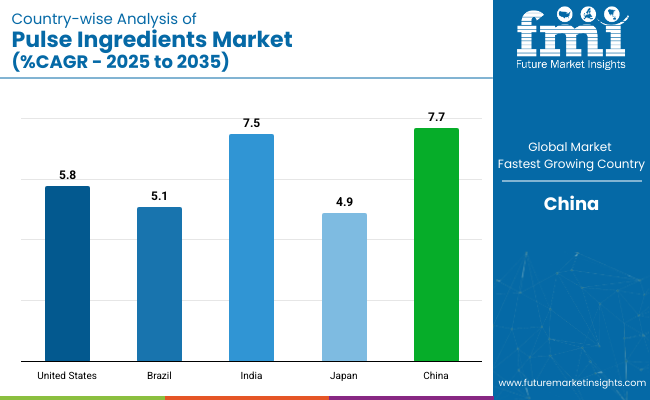
| Countries | CAGR 2025 to 2035 |
|---|---|
| The USA | 5.8% |
| Brazil | 5.1% |
| India | 7.5% |
| Japan | 4.9% |
| China | 7.7% |
Pulses are high in protein, fiber, and micronutrients, making them suitable for meeting the dietary requirements of both developed and developing countries. Canada's capacity to supply this demand is aided by its strong export network and reputation for providing high-quality, non-GMO crops.
Canada's agricultural industry has evolved significantly, with significant utilization of modern farming equipment, precision agriculture technology, and complex processing procedures. Farmers utilize GPS-guided machinery, drone surveillance, and data analytics to maximize agricultural yields and save waste.
On the processing side, advances in milling and protein extraction have enabled Canadian firms to manufacture high-quality pulse components, such as protein isolates and starches, to meet rising demand in food, feed, and industrial markets.
The industry is set to register a CAGR of 2.6% in the United Kingdom during the forecast period. The United Kingdom is witnessing a host of research in searching for alternatives to meat and dairy. As such, the application of pulse and pulse ingredients in the country is widening.
For example, in October 2023, researchers from the University of Nottingham and the Good Pulse Company received a boost in their quest to develop a pea-based alternative to standard cheese. The venture received funding of around USD 388,000 from Innovate UK.
Leading Player: Cargill, Inc. 20 %
The pulse ingredients market is primarily dominated by large companies such as Cargill, AGT Food and Ingredients, and Archer Daniels Midland Company. These industry giants utilize extensive production capacities and distribution networks to maintain their leading positions. Cargill, for instance, has been investing heavily in plant-based proteins, while AGT Food and Ingredients continues to expand its pulse ingredient offerings to cater to growing consumer demand.
These players also focus on R&D and strategic acquisitions to strengthen their market presence. However, they face significant barriers to entry due to the high capital investment required for processing infrastructure and adherence to strict food safety standards, making it difficult for smaller players to scale operations quickly.
Despite the dominance of major players, the market remains fragmented, with emerging companies such as Pulse Canada and Avena Foods carving out niches by offering specialized, regional products.
The rising demand for clean-label, plant-based ingredients presents opportunities for innovation and differentiation. Smaller companies are leveraging agility and creative solutions to meet evolving consumer preferences, fueling competition in this dynamic market.
Recent Pulse Ingredients Industry News
| Attribute | Details |
|---|---|
| Current Total Market Size (2025) | USD 24.32 billion |
| Projected Market Size (2035) | USD 43.55 billion |
| CAGR (2025 to 2035) | 6.0% |
| Base Year for Estimation | 2024 |
| Historical Period | 2020 to 2024 |
| Projections Period | 2025 to 2035 |
| Report Parameter | USD billion for value |
| By Pulses Type | Beans (Faba Beans, Black Beans, White Beans), Peas (Green Peas, Yellow Peas, Chickpeas), Lentils (Red Lentils, Green Lentils, Yellow Lentils) |
| By Product Type | Precooked Whole Pulses, Precooked Flours, Flakes, Grits, Protein Solutions (Isolate, Concentrate, Textured Protein, Hydrolyzed Protein), Starch Solution, Fiber Solutions |
| By End Use | Food Processing (Bakery & Confectionery, Meat Additives, Beverages, Protein & Nutrition Bars, Snacks & Cereals, Others), Foodservice, Retail/Household |
| Regions Covered | North America, Latin America, Western Europe, Eastern Europe, Balkans & Baltic, Russia & Belarus, Central Asia, East Asia, South Asia & Pacific, Middle East & Africa |
| Countries Covered | United States, United Kingdom, France, Germany, Japan |
| Key Players | Cargill, Inc., AGT Food and Ingredients, Group Soufflet (AIT Ingredients), Archer Daniels Midland Company, Ingredion Incorporated, Beneo GmbH, Roquette Frères, Glanbia Plc, Ebro Foods S.A., Avena Foods, The Scoular Company, Batory Foods, Anchor Ingredients Co., LLC, Pulse Canada |
| Additional Attributes | Dollar sales by value, market share analysis by region, and country-wise analysis |
As per Product Type, the industry has been categorized into Precooked whole pulses, Precooked flours, Flakes, Grits, Protein Solution (Isolate, Concentrate, Textured Protein, and Hydrolyzed Protein), Starch Solution, and Fiber Solutions.
As per Pulses Type, the industry has been categorized into Beans (Faba Beans, Black Beans, and White Beans), Peas (Green Peas, Yellow Peas, and Chickpeas), and Lentils (Red Lentils, Green Lentils, and Yellow Lentils).
As per End Use, the industry has been categorized into Food Processing (Bakery & Confectionary, Meat Additives, Beverages, Protein and Nutrition Bars, Snacks and Cereals, Others), Foodservice, and Retail/Household.
Industry analysis has been carried out in key countries of North America, Latin America, Western Europe, Eastern Europe, East Asia, South Asia & Pacific, Central Asia, Russia and Belarus, Balkan & Baltics, and the Middle East & Africa.
The global pulse ingredients market is expected to reach USD 43.55 billion by 2035, growing from USD 24.32 billion in 2025, at a CAGR of 6.0% during the forecast period.
The peas segment is projected to dominate by capturing 35.9% of the market share in 2025, owing to its strong nutritional profile, wide functional versatility, and increasing use in plant-based protein, flours, and meat substitutes.
The protein solutions segment including isolates, concentrates, textured, and hydrolyzed proteins is anticipated to expand at a CAGR of 7.4% from 2025 to 2035, driven by rising demand for clean-label and sustainable protein alternatives.
The foodservice segment is expected to hold 28.2% of the global market share in 2025, led by the growing adoption of pulse-based menu items across QSR chains, cloud kitchens, and online food delivery platforms.
Major companies include Cargill, Inc., Roquette Frères, Ingredion Incorporated, AGT Food and Ingredients, Archer Daniels Midland Company, Glanbia Plc, Beneo GmbH, and Ebro Foods, S.A., all actively engaged in pulse processing, protein extraction, and new product innovation.


Our Research Products

The "Full Research Suite" delivers actionable market intel, deep dives on markets or technologies, so clients act faster, cut risk, and unlock growth.

The Leaderboard benchmarks and ranks top vendors, classifying them as Established Leaders, Leading Challengers, or Disruptors & Challengers.

Locates where complements amplify value and substitutes erode it, forecasting net impact by horizon

We deliver granular, decision-grade intel: market sizing, 5-year forecasts, pricing, adoption, usage, revenue, and operational KPIs—plus competitor tracking, regulation, and value chains—across 60 countries broadly.

Spot the shifts before they hit your P&L. We track inflection points, adoption curves, pricing moves, and ecosystem plays to show where demand is heading, why it is changing, and what to do next across high-growth markets and disruptive tech

Real-time reads of user behavior. We track shifting priorities, perceptions of today’s and next-gen services, and provider experience, then pace how fast tech moves from trial to adoption, blending buyer, consumer, and channel inputs with social signals (#WhySwitch, #UX).

Partner with our analyst team to build a custom report designed around your business priorities. From analysing market trends to assessing competitors or crafting bespoke datasets, we tailor insights to your needs.
Supplier Intelligence
Discovery & Profiling
Capacity & Footprint
Performance & Risk
Compliance & Governance
Commercial Readiness
Who Supplies Whom
Scorecards & Shortlists
Playbooks & Docs
Category Intelligence
Definition & Scope
Demand & Use Cases
Cost Drivers
Market Structure
Supply Chain Map
Trade & Policy
Operating Norms
Deliverables
Buyer Intelligence
Account Basics
Spend & Scope
Procurement Model
Vendor Requirements
Terms & Policies
Entry Strategy
Pain Points & Triggers
Outputs
Pricing Analysis
Benchmarks
Trends
Should-Cost
Indexation
Landed Cost
Commercial Terms
Deliverables
Brand Analysis
Positioning & Value Prop
Share & Presence
Customer Evidence
Go-to-Market
Digital & Reputation
Compliance & Trust
KPIs & Gaps
Outputs
Full Research Suite comprises of:
Market outlook & trends analysis
Interviews & case studies
Strategic recommendations
Vendor profiles & capabilities analysis
5-year forecasts
8 regions and 60+ country-level data splits
Market segment data splits
12 months of continuous data updates
DELIVERED AS:
PDF EXCEL ONLINE
Demand for Pulse Ingredients in EU Size and Share Forecast Outlook 2025 to 2035
Pulse Ingredient Industry Analysis in Japan Size and Share Forecast Outlook 2025 to 2035
Pulse Ingredient Industry Analysis in Western Europe Size and Share Forecast Outlook 2025 to 2035
Pulse Ingredient Industry Analysis in Korea Size and Share Forecast Outlook 2025 to 2035
Pulse Safety Resistor Market Size and Share Forecast Outlook 2025 to 2035
Ingredients Market for Plant-based Food & Beverages Size and Share Forecast Outlook 2025 to 2035
Pulses Market Analysis - Size, Share, & Forecast Outlook 2025 to 2035
Pulse Flours Market Size and Share Forecast Outlook 2025 to 2035
Pulse Lavage Market Size and Share Forecast Outlook 2025 to 2035
Pulse Electromagnetic Field Therapy Devices Market Size and Share Forecast Outlook 2025 to 2035
Pulse Oximeter Market Size and Share Forecast Outlook 2025 to 2035
Pulse Width Modulation Controllers Market Size and Share Forecast Outlook 2025 to 2035
Pulse Products Market Analysis - Size, Share, and Forecast Outlook 2025 to 2035
Analyzing Pulses Market Share & Industry Trends
Pulsed Field Ablation Market Analysis by Product, End User, and Region - Forecast for 2025 to 2035
Pulse Generator Market
UK Pulses Market Growth – Trends, Demand & Innovations 2025–2035
MRI Pulse Oximeters Market Size and Share Forecast Outlook 2025 to 2035
USA Pulses Market Insights – Demand, Size & Industry Trends 2025–2035
Bean Ingredients Market Size and Share Forecast Outlook 2025 to 2035

Thank you!
You will receive an email from our Business Development Manager. Please be sure to check your SPAM/JUNK folder too.
Chat With
MaRIA