Pulse Ingredient Market Size and Share Forecast Outlook in Japan (2023 to 2033)

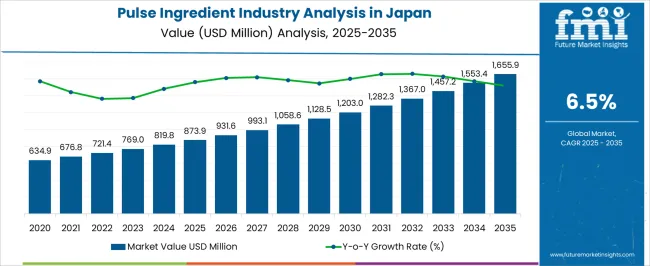
The adoption of pulse ingredient in Japan is predicted to expand at a 6.6% CAGR until 2033. In Japan, the pulse ingredient market is expected to reach USD 769.04 million by 2023. It is projected that the Japan pulse ingredient market is going to reach USD 1,459.71 million by 2033.

Pulses-based ingredients play an important role in a wide array of food products that range from soups and sauces to bread items, meals, snack foods, and confectionery items. They can be available in various forms, including flour, protein, and fiber. The growth in demand for plant-based and gluten-free products and the increasing acceptance of high-protein-based food products have been driving the demand for pulse ingredients in Japan.

Pulse ingredient sales in Japan are further driven by the swelling demand for high protein-based meals and the ever-growing demand for plant-based and gluten-free products. Increased disposable income and shifting consumer preferences toward protein-based diets are expected to fuel the demand for pulse ingredients.

Attributes Key Statistics
Expected Base Year Value (2023) USD 769.04 million
Anticipated Forecast Value (2033) USD 1,459.71 million
Estimated CAGR (2023 to 2033) 6.6% CAGR

Consumption Analysis of Pulse Ingredient Products in Japan

Japan is a developed country with an expanding population, an urbanizing populace, a growing working class, and a rising desire for foods that are good for their health. Pulses are viewed as the main source of protein in Japanese diets, and this is a crucial factor that is facilitating the growth of the pulse ingredient industry in Japan.

The rise in demand for natural ingredients and clean-labeled food products is driving the pulse ingredient market in Japan. Due to pulse components' high vitamin and mineral content, people are incorporating more natural and organic foods into their diets.

As the demand for cruelty-free products rises, people are shifting from animal-based proteins to plant-based supplement items. Moreover, the body digests and absorbs vitamins and proteins from plants far more efficiently than from synthetic sources.

Increasing taste for high protein-based foods, such as those manufactured with the help of pulse ingredients, is favoring the growth of the Japanese pulse ingredient market.

Since foods derived from pulses, like pea protein, pea flour, and pea starch, contain a high amount of protein, they have become more in demand due to associated health benefits. Consequently, Japan's pulse ingredient industry is anticipated to expand throughout the forecast period.

Pulse Ingredient Industry Analysis by Top Investment Segments in Japan

Pulse Flour Spreads its Dominance in Japanese Diet

Attributes Details
Product Type Flour
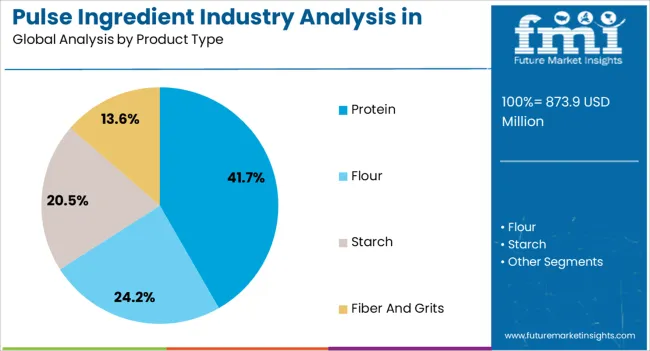
Industry Share in 2023 52.3%

Japan has the most significant sales share in pulse flour market due to its high fiber, protein, and vitamin content. The demand for pulse flour is extremely high in Japan due to its extensive shelf life, superiority in flavor to wheat flour, and gluten-free nature.

The pulse flour is easy to expand as well as retains moisture and softness after cooking. These factors are increasing its use in end-use applications. Further, pulse flour is widely used to prepare bread, cakes, snacks, cereals, and meat products, and it is projected to observe increased demand over the projection period.

Japan delivers Fertile Ground for Peas to Sprout

Attributes Details
Pulses Type Peas
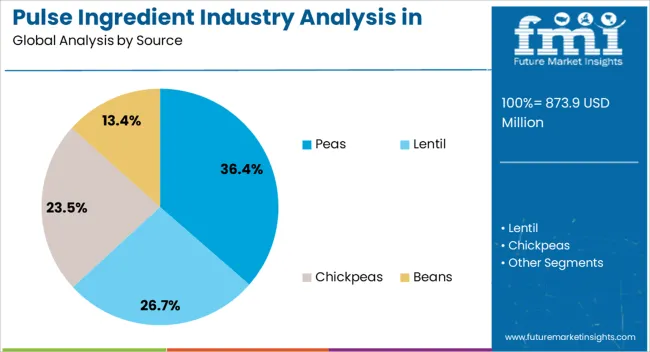
Industry Share in 2023 51.6%

The peas segment is anticipated to comprise the highest percentage of pulse components in Japan over the projected period. The product demand is expected to be driven by factors such as rising obesity, blood sugar levels, various health issues, and a consumer shift toward a healthier diet.

Some health benefits of peas include weight management, improved digestion, and increased muscle strength. This is increasing the demand for peas and products containing pea protein. Further, pea starch is a by-product of pea processing, and its use in ethanol production is creating additional value for the industry's expansion.
Competitive Landscape of the Pulse Ingredient Market in Japan

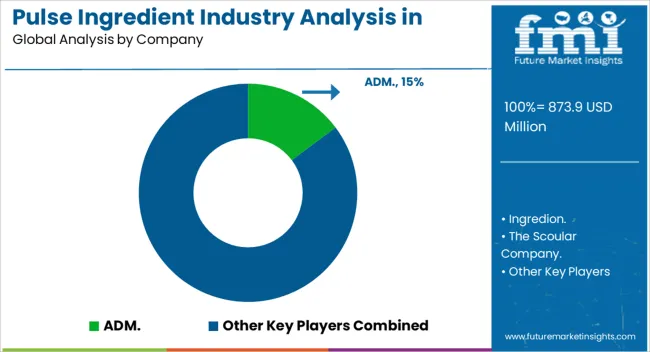
With an aging population, further heightened health consciousness, and a fast-rising demand for self-care, the competitive environment in Japan's pulse ingredient industry is changing rapidly. The top companies in the Japan pulse ingredient sector include ADM, Ingredion, The Scoular Company, Ajinomoto Co., Inc., Nisshin Oillio Group Co., Ltd., Toei Foods Co., Ltd., Nihon Shokuhin Kako Co., Ltd., and Tanaka Shoji Co., Ltd.

These companies supply their pulses variety to a wide range of markets in the food and beverage domain. The development of new products, like nutrient-added or functional component-added pulse supplements, is expected to continue influencing the industry.

Recent Developments in the Pulse Ingredient Industry in Japan

  • Ajinomoto Co., Inc. developed a new pulse-based protein powder in September 2023. This product targets the needs of athletes and health-conscious customers. This powder is a superior source of protein for a vegan diet.
  • Nihon Shokuhin Kako Co., Ltd. announced that it is looking to expand its export business in canned lentils and chickpeas to Southeast Asia in August 2023.
  • Nisshin Oillio Group Co., Ltd. announced plans to construct a new pea protein production facility in Hokkaido prefecture, Japan, in July 2023. The mill is designed to produce pea products and pea starch for the ethanol sector.
  • Toei Foods Co., Ltd. teamed up with a local agricultural cooperative in July 2023 to produce new types of soybeans with improved nutritional value.

Leading Companies Offering Pulse Ingredient in Japan

  • ADM.
  • Ingredion.
  • The Scoular Company.
  • Ajinomoto Co., Inc.
  • Nisshin Oillio Group Co., Ltd.
  • Toei Foods Co., Ltd.
  • Nihon Shokuhin Kako Co., Ltd.
  • Tanaka Shoji Co., Ltd.

Scope and Coverage of the Pulse Ingredient Market Report for Japan

Attribute Details
Estimated Valuation (2023) USD 769.04 million
Projected Valuation (2033) USD 1,459.71 million
Anticipated CAGR (2023 to 2033) 6.6% CAGR
Historical Analysis of Pulse Ingredient in Japan 2018 to 2022
Demand Forecast for Pulse Ingredient in Japan 2023 to 2033
Quantitative Units Revenue in USD million and CAGR from 2023 to 2033
Report Coverage Industry Size, Industry Trends, Key Insights for Pulse Ingredient Adoption in Japan, Insights on Global Players and Leading Industry Strategy in Japan, Ecosystem Analysis of Local and Regional Industry.
Key Companies Profiled ADM.; Ingredion.; The Scoular Company.; Ajinomoto Co., Inc.; Nisshin Oillio Group Co., Ltd.; Toei Foods Co., Ltd.; Nihon Shokuhin Kako Co., Ltd.; Tanaka Shoji Co., Ltd.

Top Segments Studied in the Japan Pulse Ingredient Market

By Source:

  • Lentil
  • Peas
  • Chickpeas
  • Beans

By Product Type:

  • Flour
  • Starch
  • Protein
  • Fiber and Grits

By Application:

  • Bakery
  • Confectionery
  • Sauces
  • Dairy and Ice-cream
  • Spreads and Toppings
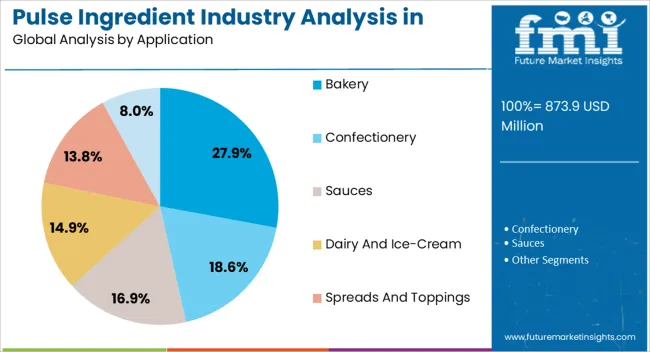
  • Others (Ready to Eat Meals, Baby Food, and Snacks)

By City:

  • Kanto
  • Chubu
  • Kinki
  • Kyushu & Okinawa
  • Tohoku
  • Rest of Japan

Table of Content

  • 1. Executive Summary
  • 2. Market Overview
  • 3. Market Background
  • 4. Industry Analysis and Outlook 2018 to 2022 and Forecast, 2023 to 2033
  • 5. Industry Analysis and Outlook 2018 to 2022 and Forecast 2023 to 2033, By Form
    • 5.1. Hard
    • 5.2. Soft
  • 6. Industry Analysis and Outlook 2018 to 2022 and Forecast 2023 to 2033, By Type
    • 6.1. Spreadable
    • 6.2. All-Purpose
    • 6.3. Butter Blend
  • 7. Industry Analysis and Outlook 2018 to 2022 and Forecast 2023 to 2033, By Application
    • 7.1. Bakery
    • 7.2. Confectionery
    • 7.3. Sauces
    • 7.4. Dairy and Ice-Cream
    • 7.5. Spreads & Toppings
    • 7.6. Others (Ready to Eat Meals, Baby Food, and Snacks)
  • 8. Industry Analysis and Outlook 2018 to 2022 and Forecast 2023 to 2033, By Region
    • 8.1. Kanto
    • 8.2. Chubu
    • 8.3. Kinki
    • 8.4. Kyushu & Okinawa
    • 8.5. Tohoku
    • 8.6. Rest of Japan
  • 9. Kanto Industry Analysis and Outlook 2018 to 2022 and Forecast 2023 to 2033
  • 10. Chubu Industry Analysis and Outlook 2018 to 2022 and Forecast 2023 to 2033
  • 11. Kinki Industry Analysis and Outlook 2018 to 2022 and Forecast 2023 to 2033
  • 12. Kyushu & Okinawa Industry Analysis and Outlook
  • 13. Tohoku Industry Analysis and Outlook 2018 to 2022 and Forecast 2023 to 2033
  • 14. Rest of Industry Analysis and Outlook 2018 to 2022 and Forecast 2023 to 2033
  • 15. Market Structure Analysis
  • 16. Competition Analysis
    • 16.1. Ingredion
    • 16.2. ROQUETTE
    • 16.3. EMSLAND GROUP
    • 16.4. The Scoular Company
    • 16.5. AGT Food and Ingredients Inc.
    • 16.6. Cosucra
    • 16.7. Vestkorn
    • 16.8. DAKOTA INGREDIENTS
    • 16.9. Anchor Ingredients
    • 16.10. Archer Daniels Midland Company
  • 17. Assumptions & Acronyms Used
  • 18. Research Methodology

List of Tables

Table 1: Industry Analysis and Outlook Value (US$ Million) Forecast by Region, 2018 to 2033

Table 2: Industry Analysis and Outlook Volume (Tons) Forecast by Region, 2018 to 2033

Table 3: Industry Analysis and Outlook Value (US$ Million) Forecast by Form, 2018 to 2033

Table 4: Industry Analysis and Outlook Volume (Tons) Forecast by Form, 2018 to 2033

Table 5: Industry Analysis and Outlook Value (US$ Million) Forecast by Type, 2018 to 2033

Table 6: Industry Analysis and Outlook Volume (Tons) Forecast by Type, 2018 to 2033

Table 7: Industry Analysis and Outlook Value (US$ Million) Forecast by Application, 2018 to 2033

Table 8: Industry Analysis and Outlook Volume (Tons) Forecast by Application, 2018 to 2033

Table 9: Kanto Industry Analysis and Outlook Value (US$ Million) Forecast by Form, 2018 to 2033

Table 10: Kanto Industry Analysis and Outlook Volume (Tons) Forecast by Form, 2018 to 2033

Table 11: Kanto Industry Analysis and Outlook Value (US$ Million) Forecast by Type, 2018 to 2033

Table 12: Kanto Industry Analysis and Outlook Volume (Tons) Forecast by Type, 2018 to 2033

Table 13: Kanto Industry Analysis and Outlook Value (US$ Million) Forecast by Application, 2018 to 2033

Table 14: Kanto Industry Analysis and Outlook Volume (Tons) Forecast by Application, 2018 to 2033

Table 15: Chubu Industry Analysis and Outlook Value (US$ Million) Forecast by Form, 2018 to 2033

Table 16: Chubu Industry Analysis and Outlook Volume (Tons) Forecast by Form, 2018 to 2033

Table 17: Chubu Industry Analysis and Outlook Value (US$ Million) Forecast by Type, 2018 to 2033

Table 18: Chubu Industry Analysis and Outlook Volume (Tons) Forecast by Type, 2018 to 2033

Table 19: Chubu Industry Analysis and Outlook Value (US$ Million) Forecast by Application, 2018 to 2033

Table 20: Chubu Industry Analysis and Outlook Volume (Tons) Forecast by Application, 2018 to 2033

Table 21: Kinki Industry Analysis and Outlook Value (US$ Million) Forecast by Form, 2018 to 2033

Table 22: Kinki Industry Analysis and Outlook Volume (Tons) Forecast by Form, 2018 to 2033

Table 23: Kinki Industry Analysis and Outlook Value (US$ Million) Forecast by Type, 2018 to 2033

Table 24: Kinki Industry Analysis and Outlook Volume (Tons) Forecast by Type, 2018 to 2033

Table 25: Kinki Industry Analysis and Outlook Value (US$ Million) Forecast by Application, 2018 to 2033

Table 26: Kinki Industry Analysis and Outlook Volume (Tons) Forecast by Application, 2018 to 2033

Table 27: Kyushu & Okinawa Industry Analysis and Outlook Value (US$ Million) Forecast by Form, 2018 to 2033

Table 28: Kyushu & Okinawa Industry Analysis and Outlook Volume (Tons) Forecast by Form, 2018 to 2033

Table 29: Kyushu & Okinawa Industry Analysis and Outlook Value (US$ Million) Forecast by Type, 2018 to 2033

Table 30: Kyushu & Okinawa Industry Analysis and Outlook Volume (Tons) Forecast by Type, 2018 to 2033

Table 31: Kyushu & Okinawa Industry Analysis and Outlook Value (US$ Million) Forecast by Application, 2018 to 2033

Table 32: Kyushu & Okinawa Industry Analysis and Outlook Volume (Tons) Forecast by Application, 2018 to 2033

Table 33: Tohoku Industry Analysis and Outlook Value (US$ Million) Forecast by Form, 2018 to 2033

Table 34: Tohoku Industry Analysis and Outlook Volume (Tons) Forecast by Form, 2018 to 2033

Table 35: Tohoku Industry Analysis and Outlook Value (US$ Million) Forecast by Type, 2018 to 2033

Table 36: Tohoku Industry Analysis and Outlook Volume (Tons) Forecast by Type, 2018 to 2033

Table 37: Tohoku Industry Analysis and Outlook Value (US$ Million) Forecast by Application, 2018 to 2033

Table 38: Tohoku Industry Analysis and Outlook Volume (Tons) Forecast by Application, 2018 to 2033

Table 39: Rest of Industry Analysis and Outlook Value (US$ Million) Forecast by Form, 2018 to 2033

Table 40: Rest of Industry Analysis and Outlook Volume (Tons) Forecast by Form, 2018 to 2033

Table 41: Rest of Industry Analysis and Outlook Value (US$ Million) Forecast by Type, 2018 to 2033

Table 42: Rest of Industry Analysis and Outlook Volume (Tons) Forecast by Type, 2018 to 2033

Table 43: Rest of Industry Analysis and Outlook Value (US$ Million) Forecast by Application, 2018 to 2033

Table 44: Rest of Industry Analysis and Outlook Volume (Tons) Forecast by Application, 2018 to 2033

List of Figures

Figure 1: Industry Analysis and Outlook Value (US$ Million) by Form, 2023 to 2033

Figure 2: Industry Analysis and Outlook Value (US$ Million) by Type, 2023 to 2033

Figure 3: Industry Analysis and Outlook Value (US$ Million) by Application, 2023 to 2033

Figure 4: Industry Analysis and Outlook Value (US$ Million) by Region, 2023 to 2033

Figure 5: Industry Analysis and Outlook Value (US$ Million) Analysis by Region, 2018 to 2033

Figure 6: Industry Analysis and Outlook Volume (Tons) Analysis by Region, 2018 to 2033

Figure 7: Industry Analysis and Outlook Value Share (%) and BPS Analysis by Region, 2023 to 2033

Figure 8: Industry Analysis and Outlook Y-o-Y Growth (%) Projections by Region, 2023 to 2033

Figure 9: Industry Analysis and Outlook Value (US$ Million) Analysis by Form, 2018 to 2033

Figure 10: Industry Analysis and Outlook Volume (Tons) Analysis by Form, 2018 to 2033

Figure 11: Industry Analysis and Outlook Value Share (%) and BPS Analysis by Form, 2023 to 2033

Figure 12: Industry Analysis and Outlook Y-o-Y Growth (%) Projections by Form, 2023 to 2033

Figure 13: Industry Analysis and Outlook Value (US$ Million) Analysis by Type, 2018 to 2033

Figure 14: Industry Analysis and Outlook Volume (Tons) Analysis by Type, 2018 to 2033

Figure 15: Industry Analysis and Outlook Value Share (%) and BPS Analysis by Type, 2023 to 2033

Figure 16: Industry Analysis and Outlook Y-o-Y Growth (%) Projections by Type, 2023 to 2033

Figure 17: Industry Analysis and Outlook Value (US$ Million) Analysis by Application, 2018 to 2033

Figure 18: Industry Analysis and Outlook Volume (Tons) Analysis by Application, 2018 to 2033

Figure 19: Industry Analysis and Outlook Value Share (%) and BPS Analysis by Application, 2023 to 2033

Figure 20: Industry Analysis and Outlook Y-o-Y Growth (%) Projections by Application, 2023 to 2033

Figure 21: Industry Analysis and Outlook Attractiveness by Form, 2023 to 2033

Figure 22: Industry Analysis and Outlook Attractiveness by Type, 2023 to 2033

Figure 23: Industry Analysis and Outlook Attractiveness by Application, 2023 to 2033

Figure 24: Industry Analysis and Outlook Attractiveness by Region, 2023 to 2033

Figure 25: Kanto Industry Analysis and Outlook Value (US$ Million) by Form, 2023 to 2033

Figure 26: Kanto Industry Analysis and Outlook Value (US$ Million) by Type, 2023 to 2033

Figure 27: Kanto Industry Analysis and Outlook Value (US$ Million) by Application, 2023 to 2033

Figure 28: Kanto Industry Analysis and Outlook Value (US$ Million) Analysis by Form, 2018 to 2033

Figure 29: Kanto Industry Analysis and Outlook Volume (Tons) Analysis by Form, 2018 to 2033

Figure 30: Kanto Industry Analysis and Outlook Value Share (%) and BPS Analysis by Form, 2023 to 2033

Figure 31: Kanto Industry Analysis and Outlook Y-o-Y Growth (%) Projections by Form, 2023 to 2033

Figure 32: Kanto Industry Analysis and Outlook Value (US$ Million) Analysis by Type, 2018 to 2033

Figure 33: Kanto Industry Analysis and Outlook Volume (Tons) Analysis by Type, 2018 to 2033

Figure 34: Kanto Industry Analysis and Outlook Value Share (%) and BPS Analysis by Type, 2023 to 2033

Figure 35: Kanto Industry Analysis and Outlook Y-o-Y Growth (%) Projections by Type, 2023 to 2033

Figure 36: Kanto Industry Analysis and Outlook Value (US$ Million) Analysis by Application, 2018 to 2033

Figure 37: Kanto Industry Analysis and Outlook Volume (Tons) Analysis by Application, 2018 to 2033

Figure 38: Kanto Industry Analysis and Outlook Value Share (%) and BPS Analysis by Application, 2023 to 2033

Figure 39: Kanto Industry Analysis and Outlook Y-o-Y Growth (%) Projections by Application, 2023 to 2033

Figure 40: Kanto Industry Analysis and Outlook Attractiveness by Form, 2023 to 2033

Figure 41: Kanto Industry Analysis and Outlook Attractiveness by Type, 2023 to 2033

Figure 42: Kanto Industry Analysis and Outlook Attractiveness by Application, 2023 to 2033

Figure 43: Chubu Industry Analysis and Outlook Value (US$ Million) by Form, 2023 to 2033

Figure 44: Chubu Industry Analysis and Outlook Value (US$ Million) by Type, 2023 to 2033

Figure 45: Chubu Industry Analysis and Outlook Value (US$ Million) by Application, 2023 to 2033

Figure 46: Chubu Industry Analysis and Outlook Value (US$ Million) Analysis by Form, 2018 to 2033

Figure 47: Chubu Industry Analysis and Outlook Volume (Tons) Analysis by Form, 2018 to 2033

Figure 48: Chubu Industry Analysis and Outlook Value Share (%) and BPS Analysis by Form, 2023 to 2033

Figure 49: Chubu Industry Analysis and Outlook Y-o-Y Growth (%) Projections by Form, 2023 to 2033

Figure 50: Chubu Industry Analysis and Outlook Value (US$ Million) Analysis by Type, 2018 to 2033

Figure 51: Chubu Industry Analysis and Outlook Volume (Tons) Analysis by Type, 2018 to 2033

Figure 52: Chubu Industry Analysis and Outlook Value Share (%) and BPS Analysis by Type, 2023 to 2033

Figure 53: Chubu Industry Analysis and Outlook Y-o-Y Growth (%) Projections by Type, 2023 to 2033

Figure 54: Chubu Industry Analysis and Outlook Value (US$ Million) Analysis by Application, 2018 to 2033

Figure 55: Chubu Industry Analysis and Outlook Volume (Tons) Analysis by Application, 2018 to 2033

Figure 56: Chubu Industry Analysis and Outlook Value Share (%) and BPS Analysis by Application, 2023 to 2033

Figure 57: Chubu Industry Analysis and Outlook Y-o-Y Growth (%) Projections by Application, 2023 to 2033

Figure 58: Chubu Industry Analysis and Outlook Attractiveness by Form, 2023 to 2033

Figure 59: Chubu Industry Analysis and Outlook Attractiveness by Type, 2023 to 2033

Figure 60: Chubu Industry Analysis and Outlook Attractiveness by Application, 2023 to 2033

Figure 61: Kinki Industry Analysis and Outlook Value (US$ Million) by Form, 2023 to 2033

Figure 62: Kinki Industry Analysis and Outlook Value (US$ Million) by Type, 2023 to 2033

Figure 63: Kinki Industry Analysis and Outlook Value (US$ Million) by Application, 2023 to 2033

Figure 64: Kinki Industry Analysis and Outlook Value (US$ Million) Analysis by Form, 2018 to 2033

Figure 65: Kinki Industry Analysis and Outlook Volume (Tons) Analysis by Form, 2018 to 2033

Figure 66: Kinki Industry Analysis and Outlook Value Share (%) and BPS Analysis by Form, 2023 to 2033

Figure 67: Kinki Industry Analysis and Outlook Y-o-Y Growth (%) Projections by Form, 2023 to 2033

Figure 68: Kinki Industry Analysis and Outlook Value (US$ Million) Analysis by Type, 2018 to 2033

Figure 69: Kinki Industry Analysis and Outlook Volume (Tons) Analysis by Type, 2018 to 2033

Figure 70: Kinki Industry Analysis and Outlook Value Share (%) and BPS Analysis by Type, 2023 to 2033

Figure 71: Kinki Industry Analysis and Outlook Y-o-Y Growth (%) Projections by Type, 2023 to 2033

Figure 72: Kinki Industry Analysis and Outlook Value (US$ Million) Analysis by Application, 2018 to 2033

Figure 73: Kinki Industry Analysis and Outlook Volume (Tons) Analysis by Application, 2018 to 2033

Figure 74: Kinki Industry Analysis and Outlook Value Share (%) and BPS Analysis by Application, 2023 to 2033

Figure 75: Kinki Industry Analysis and Outlook Y-o-Y Growth (%) Projections by Application, 2023 to 2033

Figure 76: Kinki Industry Analysis and Outlook Attractiveness by Form, 2023 to 2033

Figure 77: Kinki Industry Analysis and Outlook Attractiveness by Type, 2023 to 2033

Figure 78: Kinki Industry Analysis and Outlook Attractiveness by Application, 2023 to 2033

Figure 79: Kyushu & Okinawa Industry Analysis and Outlook Value (US$ Million) by Form, 2023 to 2033

Figure 80: Kyushu & Okinawa Industry Analysis and Outlook Value (US$ Million) by Type, 2023 to 2033

Figure 81: Kyushu & Okinawa Industry Analysis and Outlook Value (US$ Million) by Application, 2023 to 2033

Figure 82: Kyushu & Okinawa Industry Analysis and Outlook Value (US$ Million) Analysis by Form, 2018 to 2033

Figure 83: Kyushu & Okinawa Industry Analysis and Outlook Volume (Tons) Analysis by Form, 2018 to 2033

Figure 84: Kyushu & Okinawa Industry Analysis and Outlook Value Share (%) and BPS Analysis by Form, 2023 to 2033

Figure 85: Kyushu & Okinawa Industry Analysis and Outlook Y-o-Y Growth (%) Projections by Form, 2023 to 2033

Figure 86: Kyushu & Okinawa Industry Analysis and Outlook Value (US$ Million) Analysis by Type, 2018 to 2033

Figure 87: Kyushu & Okinawa Industry Analysis and Outlook Volume (Tons) Analysis by Type, 2018 to 2033

Figure 88: Kyushu & Okinawa Industry Analysis and Outlook Value Share (%) and BPS Analysis by Type, 2023 to 2033

Figure 89: Kyushu & Okinawa Industry Analysis and Outlook Y-o-Y Growth (%) Projections by Type, 2023 to 2033

Figure 90: Kyushu & Okinawa Industry Analysis and Outlook Value (US$ Million) Analysis by Application, 2018 to 2033

Figure 91: Kyushu & Okinawa Industry Analysis and Outlook Volume (Tons) Analysis by Application, 2018 to 2033

Figure 92: Kyushu & Okinawa Industry Analysis and Outlook Value Share (%) and BPS Analysis by Application, 2023 to 2033

Figure 93: Kyushu & Okinawa Industry Analysis and Outlook Y-o-Y Growth (%) Projections by Application, 2023 to 2033

Figure 94: Kyushu & Okinawa Industry Analysis and Outlook Attractiveness by Form, 2023 to 2033

Figure 95: Kyushu & Okinawa Industry Analysis and Outlook Attractiveness by Type, 2023 to 2033

Figure 96: Kyushu & Okinawa Industry Analysis and Outlook Attractiveness by Application, 2023 to 2033

Figure 97: Tohoku Industry Analysis and Outlook Value (US$ Million) by Form, 2023 to 2033

Figure 98: Tohoku Industry Analysis and Outlook Value (US$ Million) by Type, 2023 to 2033

Figure 99: Tohoku Industry Analysis and Outlook Value (US$ Million) by Application, 2023 to 2033

Figure 100: Tohoku Industry Analysis and Outlook Value (US$ Million) Analysis by Form, 2018 to 2033

Figure 101: Tohoku Industry Analysis and Outlook Volume (Tons) Analysis by Form, 2018 to 2033

Figure 102: Tohoku Industry Analysis and Outlook Value Share (%) and BPS Analysis by Form, 2023 to 2033

Figure 103: Tohoku Industry Analysis and Outlook Y-o-Y Growth (%) Projections by Form, 2023 to 2033

Figure 104: Tohoku Industry Analysis and Outlook Value (US$ Million) Analysis by Type, 2018 to 2033

Figure 105: Tohoku Industry Analysis and Outlook Volume (Tons) Analysis by Type, 2018 to 2033

Figure 106: Tohoku Industry Analysis and Outlook Value Share (%) and BPS Analysis by Type, 2023 to 2033

Figure 107: Tohoku Industry Analysis and Outlook Y-o-Y Growth (%) Projections by Type, 2023 to 2033

Figure 108: Tohoku Industry Analysis and Outlook Value (US$ Million) Analysis by Application, 2018 to 2033

Figure 109: Tohoku Industry Analysis and Outlook Volume (Tons) Analysis by Application, 2018 to 2033

Figure 110: Tohoku Industry Analysis and Outlook Value Share (%) and BPS Analysis by Application, 2023 to 2033

Figure 111: Tohoku Industry Analysis and Outlook Y-o-Y Growth (%) Projections by Application, 2023 to 2033

Figure 112: Tohoku Industry Analysis and Outlook Attractiveness by Form, 2023 to 2033

Figure 113: Tohoku Industry Analysis and Outlook Attractiveness by Type, 2023 to 2033

Figure 114: Tohoku Industry Analysis and Outlook Attractiveness by Application, 2023 to 2033

Figure 115: Rest of Industry Analysis and Outlook Value (US$ Million) by Form, 2023 to 2033

Figure 116: Rest of Industry Analysis and Outlook Value (US$ Million) by Type, 2023 to 2033

Figure 117: Rest of Industry Analysis and Outlook Value (US$ Million) by Application, 2023 to 2033

Figure 118: Rest of Industry Analysis and Outlook Value (US$ Million) Analysis by Form, 2018 to 2033

Figure 119: Rest of Industry Analysis and Outlook Volume (Tons) Analysis by Form, 2018 to 2033

Figure 120: Rest of Industry Analysis and Outlook Value Share (%) and BPS Analysis by Form, 2023 to 2033

Figure 121: Rest of Industry Analysis and Outlook Y-o-Y Growth (%) Projections by Form, 2023 to 2033

Figure 122: Rest of Industry Analysis and Outlook Value (US$ Million) Analysis by Type, 2018 to 2033

Figure 123: Rest of Industry Analysis and Outlook Volume (Tons) Analysis by Type, 2018 to 2033

Figure 124: Rest of Industry Analysis and Outlook Value Share (%) and BPS Analysis by Type, 2023 to 2033

Figure 125: Rest of Industry Analysis and Outlook Y-o-Y Growth (%) Projections by Type, 2023 to 2033

Figure 126: Rest of Industry Analysis and Outlook Value (US$ Million) Analysis by Application, 2018 to 2033

Figure 127: Rest of Industry Analysis and Outlook Volume (Tons) Analysis by Application, 2018 to 2033

Figure 128: Rest of Industry Analysis and Outlook Value Share (%) and BPS Analysis by Application, 2023 to 2033

Figure 129: Rest of Industry Analysis and Outlook Y-o-Y Growth (%) Projections by Application, 2023 to 2033

Figure 130: Rest of Industry Analysis and Outlook Attractiveness by Form, 2023 to 2033

Figure 131: Rest of Industry Analysis and Outlook Attractiveness by Type, 2023 to 2033

Figure 132: Rest of Industry Analysis and Outlook Attractiveness by Application, 2023 to 2033

Frequently Asked Questions

At What Rate is the Pulse Ingredient Industry Growing in Japan?

The anticipated CAGR for the Japan pulse ingredient industry through 2033 is 6.6%.

How Big will the Pulse Ingredient Landscape be in Japan?

Demand for pulse ingredient in Japan is likely to surpass USD 1,459.71 million by 2033.

What is the Current Industry Size of Pulse Ingredient in Japan?

In 2023, the industry for pulse ingredient in Japan is valued at USD 769.04 million.

Which is the Preferred Form of Pulse Ingredient in Japan?

Pulse flour are the preferred form of pulse ingredient in Japan, with an industry share of 52.3%.

Which is the Common Pulses Type of Pulse Ingredient in Japan?

In Japan, peas dominates the pulse ingredient industry, with a share of 51.6%.

Explore Functional Food Ingredients Insights

Future Market Insights

Pulse Ingredient Industry Analysis in Japan