The Pulse Oximeter Market is estimated to be valued at USD 3.1 billion in 2025 and is projected to reach USD 6.4 billion by 2035, registering a compound annual growth rate (CAGR) of 7.6% over the forecast period.
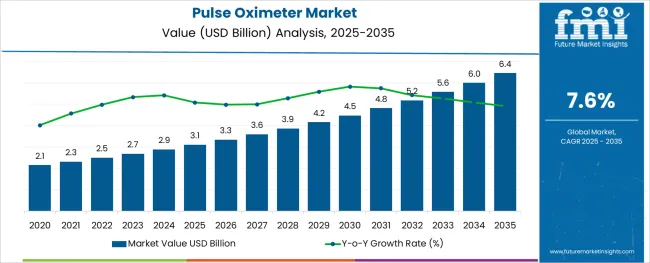
The pulse oximeter market is witnessing sustained growth driven by rising demand for continuous oxygen saturation monitoring, an increase in chronic respiratory conditions, and heightened public health focus following global respiratory outbreaks. The growing awareness among consumers and healthcare providers about early detection of hypoxemia and the importance of monitoring oxygen levels in both clinical and home settings has significantly contributed to adoption.
Miniaturization of devices, integration of Bluetooth connectivity, and advancements in sensor accuracy are expanding the market appeal across medical and wellness segments. Healthcare infrastructure improvements in emerging economies and increased government emphasis on patient safety protocols are also reinforcing the demand for these noninvasive monitoring tools.
As healthcare delivery evolves toward home based and remote care, the outlook for pulse oximeters remains positive, supported by technological innovation and expanding clinical utility.
The market is segmented by Type and End-use and region. By Type, the market is divided into Fingertip and Handheld. In terms of End-use, the market is classified into Hospitals & Other Healthcare Facilities and Homecare. Regionally, the market is classified into North America, Latin America, Western Europe, Eastern Europe, Balkan & Baltic Countries, Russia & Belarus, Central Asia, East Asia, South Asia & Pacific, and the Middle East & Africa.
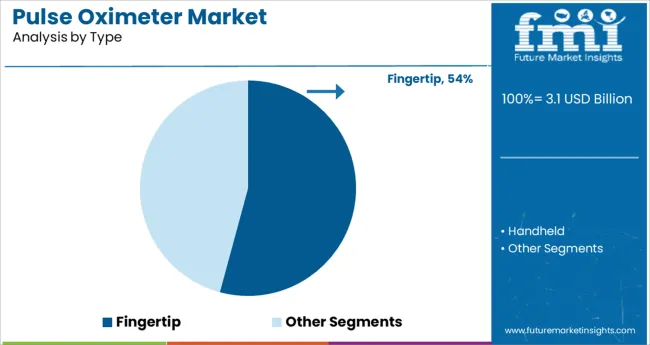
The fingertip segment is anticipated to hold 54.20% of the total market revenue by 2025 within the type category, making it the leading product format. This dominance is attributed to the segment's portability, ease of use, and affordability, which have made it widely accessible for both clinical and personal monitoring.
The compact design enables convenient home use while offering dependable spot check measurements. Its adoption surged due to increased public health awareness and its utility in early stage symptom tracking during respiratory illnesses.
The fingertip device’s battery efficiency, lightweight nature, and simple interface have made it a preferred choice for elderly patients, athletes, and individuals with chronic respiratory conditions. With expanding digital health integration, fingertip oximeters continue to be the go to option in consumer and outpatient settings.
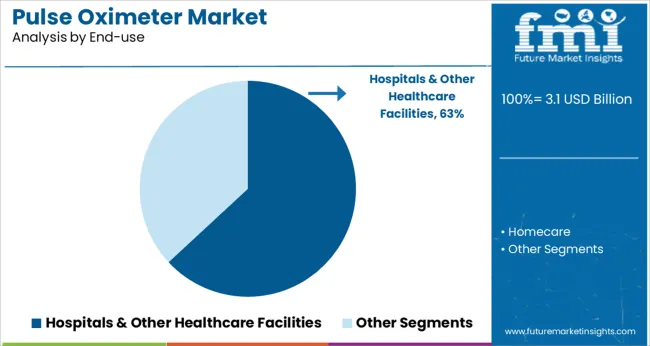
The hospitals and other healthcare facilities segment is projected to contribute 63.10% of the total market revenue by 2025 under the end use category, establishing it as the leading user segment. This is driven by the necessity for continuous patient monitoring in critical care, emergency departments, and postoperative recovery units.
High demand for accurate and real time oxygen saturation data in clinical settings has reinforced reliance on pulse oximeters as essential vital sign equipment. Hospitals also benefit from device integration into multiparameter monitors, allowing synchronized tracking of patient vitals.
Additionally, adherence to safety protocols and accreditation standards has mandated the presence of reliable oximetry systems across various care units. With increased patient loads and emphasis on infection control, hospitals continue to prioritize robust, reusable, and accurate monitoring devices, sustaining their leadership in end use adoption.
As per the Global Pulse Oximeter Market research by Future Market Insights - a market research and competitive intelligence provider, historically, from 2020 to 2024, the market value of the Pulse Oximeter Market increased at around 7.4% CAGR.
The key revenue drivers which affected the Pulse Oximeter Market are the prevalence of chronic diseases and the advent of the coronavirus enhanced the market's demand for pulse oximeters.
The rising prevalence of specific disorders like asthma, hyperlipidemia, high blood pressure, diabetes, ischemic conditions, cardiac arrhythmia, sleep apnea, and COPD is expected to further drive the market. The WHO estimates that 64 million people globally suffer from COPD and that 90% of COPD deaths take place in low- and middle-income nations.
The rise in chronic diseases such as cancer (currently there are more than 200 types of cancer in the world), diabetes, heart disease, and other diseases, is expected to drive the adoption of the pulse oximeter market. Globally, chronic illness and disease are on the rise.
The growing number of elderly individuals, as well as changes in social behavior, are contributing to the rise in these common and chronic health issues.
The middle-class population is expanding, and as the city expands, people’s lives expand at the same rate. Obesity and disorders like diabetes are becoming more likely as a result. Chronic disease prevalence climbed by 57% by 2024, according to the World Health Organization. Chronic sickness has resulted in an increase in demand for Pulse Oximeter Market.
The key factor which is propelling the market is the rising numbers of the geriatric population which eventually increases the chronic disease numbers. The rising prevalence of the target disorders and growing awareness of the uses of pulse oximeters in Covid-19 management are anticipated to fuel market expansion.
As a result of Covid-19, respiratory monitoring is currently receiving more attention, and self-monitoring is being replaced by pulse oximeters. Additionally, the rising demand for patient monitoring in non-hospital settings due to an increase in surgical procedures and potential opportunities for site care is anticipated to offer market players significant growth opportunities over the course of the forecast period.
With the rise in Covid-19 cases, respiratory and remote monitoring are currently receiving more attention. Over the following two years, it is anticipated that this will further encourage market expansion.
During the anticipated period, the market expansion is anticipated to be aided by the availability of new goods and the rising demands of emerging and undeveloped economies. Pulse oximetry is made mandatory for newborn screenings in around 43 states in the USA, and it is used to diagnose congenital heart disease (CHD) and other cardiovascular and respiratory diseases.
Among the most prevalent respiratory conditions worldwide are pneumonia, asthma, and chronic obstructive pulmonary disease (COPD). Low blood oxygen levels result from respiratory tract obstructions in COPD, asthma, and pneumonia, which make it challenging to exhale and exhale the lungs.
Due to rising tobacco use and an aging population, the prevalence of COPD is anticipated to rise in the upcoming years. The incidence of COPD rises with age, especially in persons over the age of 45, according to the Australian Institute of Health and Welfare (AIHW).
The mortality rate of COPD patients can be decreased with routine blood level monitoring. Additionally, pneumonia and acute respiratory distress syndrome (ARDS) are both directly related to COVID-19.
Pulse Oximeter helps in monitoring oxygen saturation over time, warning of dangerously low oxygen levels, especially in newborns, providing reassurance to those with long-term respiratory or cardiovascular conditions, determining the need for supplemental oxygen, checking oxygen saturation levels in anesthetized patients, and alerting the potentially harmful side effects in those taking medications that affect oxygen saturation or breathing.
A new home sleep apnea (HSAT) technology called WatchPAT uses a peripheral arterial signal (PAT) to identify the condition. It utilizes three contact points to measure seven channels, including the PAT signal, heart rate, oximetry, actigraphy, posture, snoring, and chest movements.
After the research, raw data is retrieved in less than a minute and evaluated automatically to detect all varieties of apnea situations. AHI, AHic, RDI, and ODI are provided by WatchPAT based on Real Time Sleep and Sleep stages. The Home Sleep Test (HST) by WatchPAT has been clinically verified and has an 89% correlation with PSG1. The 2020 AASM Clinical Practice Guidelines recognize the PAT signal as technically adequate and include it.
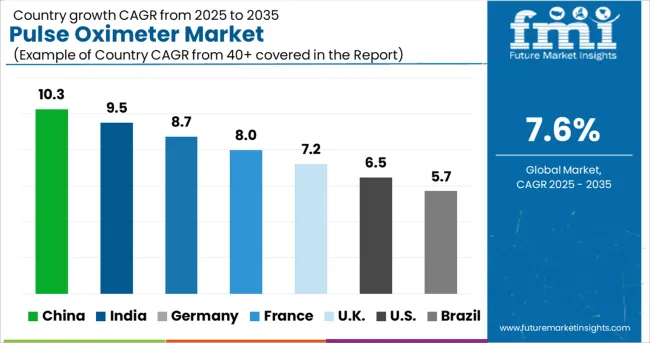
During the projection period, North America is expected to be the largest market. In terms of market share for pulse oximeters by 2024, the growth in the number of persons with impairments in the upcoming years and the ensuing rise in respiratory disorders accounted for a sizable portion of the North American market.
The availability of sophisticated healthcare infrastructure in the USA and Canada, as well as technological advancements in pulse oximeters significantly contribute to the expansion of the market in the area. The growth in market share of the region is also attributed to the well-developed infrastructure, adoption of pulse oximeters in households, rising incidence of chronic diseases and heart patients, and increase in healthcare spending.
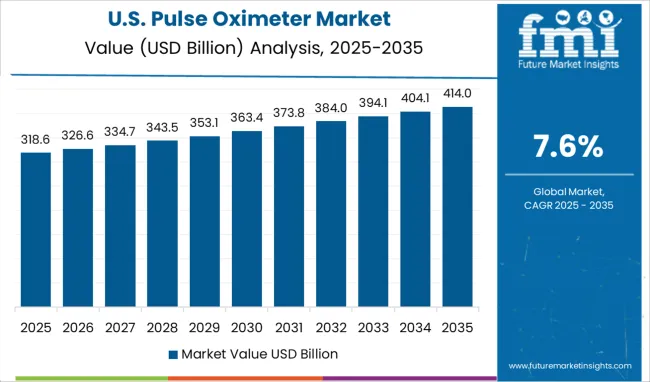
The United States is expected to account for the highest market of USD 6.4 billion by the end of 2035. It is expected to be projected to have an absolute dollar growth of USD 1.1 billion.
This is due to several factors such as an increase in the incidence of Chronic Diseases, increasing Covid-19 cases in the country, an increase in the geriatric population, and due to developed healthcare facilities. Around 43 states in the country have made it mandatory to use a pulse oximeter.
The USA also has some of the key players in the market, which include Welch Allyn, Nonin medical, CAS Medical System Inc, Masimo, GE Healthcare, and Medtronic Plc.
The market in The United Kingdom is expected to reach a valuation of USD 234 million by 2035. With a CAGR of 9.2% from 2025 to 2035, the market is projected to grow at an absolute dollar opportunity of USD 135 million.
The market in Japan is expected to reach a valuation of USD 167 million by 2035. With a CAGR of 9.4% from 2025 to 2035, the market is projected to grow at an absolute dollar opportunity of USD 98.5 million.
The market in South Korea is expected to reach a valuation of USD 90 million by 2035. With a CAGR of 8.6% from 2025 to 2035, the market is projected to grow at an absolute dollar opportunity of USD 50.5 million.
Market revenue through hospitals & other healthcare facility of the market is forecasted to grow at a CAGR of over 7.7% during 2025 to 32. Due to a growth in operations and emergency room visits, hospitals and other types of healthcare facilities held a commanding 82% market share for pulse oximeters by 2024.
For instance, a World Health Organization (WHO) survey found that more than 2.1 million people developed asthma in 2020 and that an estimated 4,61,000 individuals died as a result of medicines or subpar care.
In order to continuously monitor the health of asthma patients, various nations are stressing the development of sophisticated pulse oximeters and spO2 monitoring devices in hospitals. One of the factors driving the adoption of pulse oximeters in hospitals is the expansion of patient options for quality care and accessibility in hospitals and clinics.
The availability of a variety of treatment choices, such as table-top or bedside pulse oximeters, increases patient acceptance and fuels market expansion.
Hospitals also place a strong emphasis on giving the patient's family thorough training so they can use various pulse oximeters for routine check-ups. The business environment has also been substantially improved by the increased acceptance and release of low-cost, simple-to-use pulse oximeters for use in hospitals.
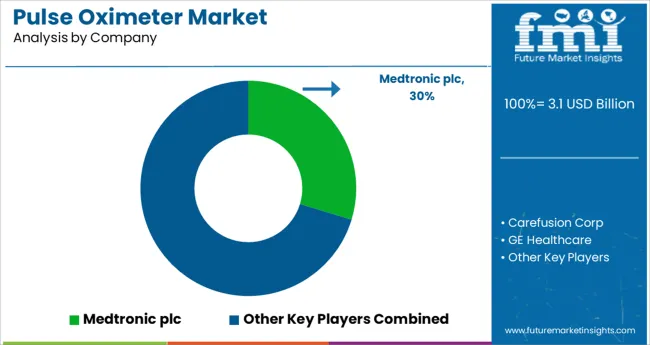
The key companies in Pulse Oximeter Market are focused on alliances, technology collaborations, and product launch strategies. The Tier 2 Players in the market are targeting to increase their market share. Some of the recent developments of key Neural Implants providers are as follows:
Similarly, recent developments related to companies in Pulse Oximeter Market have been tracked by the team at Future Market Insights, which are available in the full report.
The global pulse oximeter market is estimated to be valued at USD 3.1 billion in 2025.
It is projected to reach USD 6.4 billion by 2035.
The market is expected to grow at a 7.6% CAGR between 2025 and 2035.
The key product types are fingertip and handheld.
hospitals & other healthcare facilities segment is expected to dominate with a 63.1% industry share in 2025.


Full Research Suite comprises of:
Market outlook & trends analysis
Interviews & case studies
Strategic recommendations
Vendor profiles & capabilities analysis
5-year forecasts
8 regions and 60+ country-level data splits
Market segment data splits
12 months of continuous data updates
DELIVERED AS:
PDF EXCEL ONLINE
MRI Pulse Oximeters Market Size and Share Forecast Outlook 2025 to 2035
Smart Pulse Oximeters Market Size and Share Forecast Outlook 2025 to 2035
Pulse Ingredient Industry Analysis in Japan Size and Share Forecast Outlook 2025 to 2035
Pulse Ingredient Industry Analysis in Western Europe Size and Share Forecast Outlook 2025 to 2035
Pulse Ingredient Industry Analysis in Korea Size and Share Forecast Outlook 2025 to 2035
Pulse Safety Resistor Market Size and Share Forecast Outlook 2025 to 2035
Pulses Market Analysis - Size, Share, & Forecast Outlook 2025 to 2035
Pulse Flours Market Size and Share Forecast Outlook 2025 to 2035
Pulse Lavage Market Size and Share Forecast Outlook 2025 to 2035
Pulse Electromagnetic Field Therapy Devices Market Size and Share Forecast Outlook 2025 to 2035
Pulse Ingredients Market Analysis – Size, Share, and Forecast 2025 to 2035
Pulse Width Modulation Controllers Market Size and Share Forecast Outlook 2025 to 2035
Pulse Products Market Analysis - Size, Share, and Forecast Outlook 2025 to 2035
Analyzing Pulses Market Share & Industry Trends
Pulsed Field Ablation Market Analysis by Product, End User, and Region - Forecast for 2025 to 2035
Pulse Generator Market
UK Pulses Market Growth – Trends, Demand & Innovations 2025–2035
USA Pulses Market Insights – Demand, Size & Industry Trends 2025–2035
ASEAN Pulses Market Analysis – Size, Share & Forecast 2025–2035
Europe Pulses Market Outlook – Share, Growth & Forecast 2025–2035

Thank you!
You will receive an email from our Business Development Manager. Please be sure to check your SPAM/JUNK folder too.
Chat With
MaRIA