Pulse Lavage Market
Market Insights on Pulse Lavage covering sales outlook, demand forecast & up-to-date key trends
Pulse Lavage Market by Product Type, Reusability, Application, End User & Region - Forecast 2022 – 2032
Pulse Lavage Market Outlook (2022-2032)
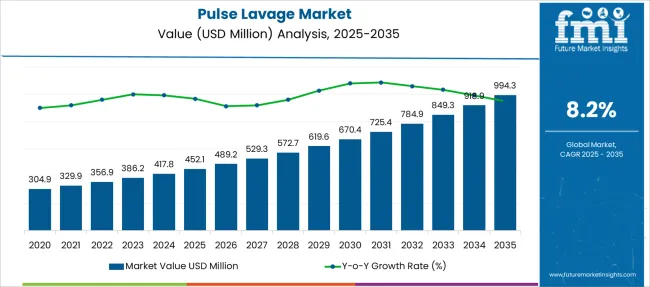
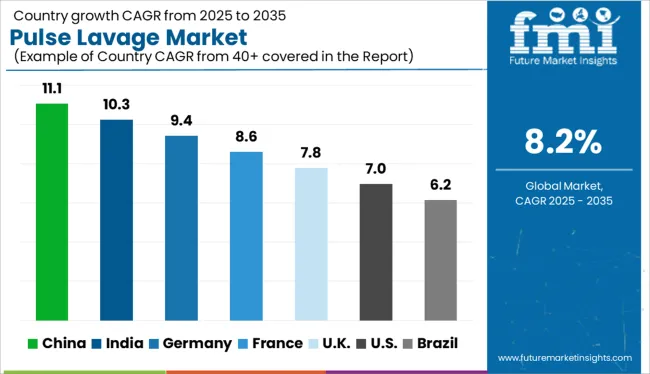
[333 Pages Report] As per FMI, the global pulse lavage market is predicted to witness US$ 356.9 Mn in 2022 and is expected to exhibit a CAGR of 8.2% from 2022 to reach US$ 785 Mn by 2032.
The primary factor responsible for this significant market growth and sales of pulse lavage is the increasing prevalence of orthopedic procedures across the world.
Report Attribute |
Details |
Pulse Lavage Market Anticipated Forecast Value (2022) |
US$ 356.9 Million |
Pulse Lavage Market Anticipated Forecast Value (2032) |
US$ 785 Million |
Pulse Lavage Market Projected Growth Rate (2022-2032) |
8.2% CAGR |
The global pulse lavage market is said to experience a steady growth due to the increasing prevalence of orthopedic procedures and the rising geriatric population worldwide.
The worldwide sales of pulse lavage are predicted to increase owing to rising injuries in road accidents or any other form of physical activity. WHO states that in 2013, worldwide road accidents claimed 1.25 million lives compared to 1.14 million in 2007. Additionally, substantial opportunities from developing economies have bettered the market adoption of pulse lavage.
Globally, in 2017, injuries related to road accidents were the primary cause of death amongst individuals aged 15 to 29 years, thereby increasing emergency hospital admissions. Such emergency hospitalization due to critical injuries encourages the demand for pulse lavage devices.
Let us know your requirement to get
100% FREE customization
What are the Key Pulse Lavage Market Key Trends and Opportunities?
According to the latest market report, the demand for pulse lavage is anticipated to grow constantly in the coming few years owing to increase surgical procedures, a rise in aged population, technological improvements in the development of surgical tools, a greater number of injuries related to road accidents and sports, and escalating number of orthopedic procedures.
Several factors contribute to the demand for pulse lavage devices that promote this market's growth, such as technological advancements in the healthcare industry, developments in computational strategies, rising disposable income, and increased healthcare awareness. Also, growing awareness about any form of physical activity such as running, gym, or other cardio activity, can boost the pulse lavage market growth.
According to a global market study on pulse lavage, expanding medical tourism and opportunities in developing economies also positively impact the global market growth.
Besides the growth factors, some factors are also responsible for hampering the development of the global pulse lavage market, such as delay in wound healing owing to high pressure irrigation and poor reimbursement policies or delay in reimbursement.
What is the Segmentation Analysis for the Pulse Lavage Market?
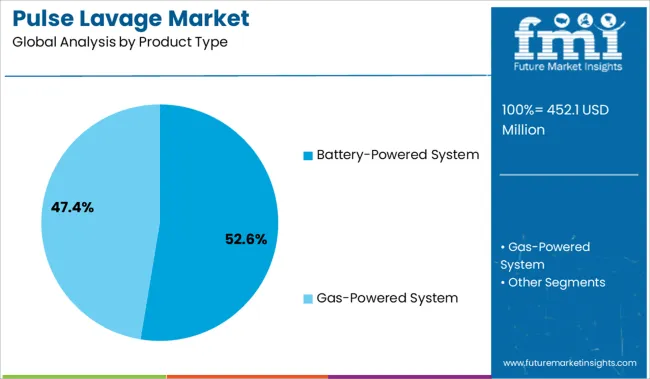
Based on the product type, the battery-powered pulse lavage system is anticipated to hold a considerable revenue share in the global pulse lavage market, owing to higher demand for battery-powered devices among end users as it has low maintenance cost and high energy storage capacity.
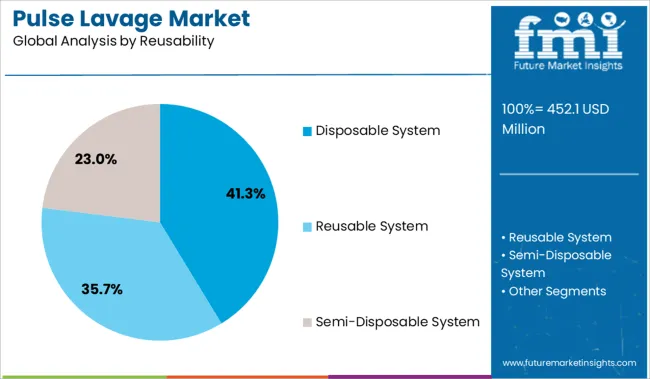
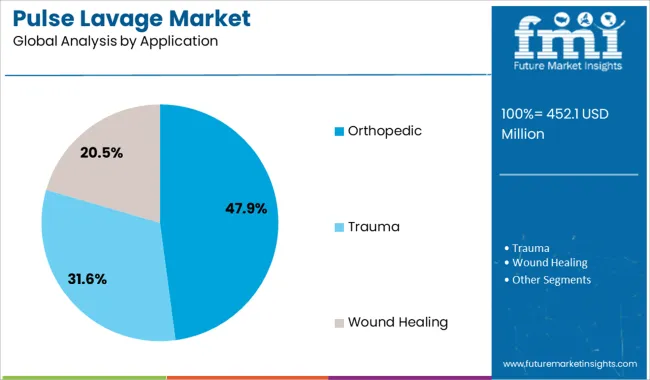
In the reusability segment, disposable lavage systems garnered the largest market share since they have reduced chances of cross-contamination and do not need frequent maintenance. Of all the application segments, orthopedics garners the biggest market share.
It is predicted to bloom at a faster CAGR during the forecast period owing to increasing cases of bone disorders like osteoporosis and osteoarthritis. Lastly, the end-user segment mentions that the hospitals and clinics segment is dominating as there are more emergency admissions for wound care and surgical procedures.
Find your sweet spots for generating winning opportunities in this market.
Talk to AnalystWhich Region Accounts for the Significant Share in the Pulse Lavage Market?
Based on geography, Global Pulse Lavage Market is segmented into several key regions viz. North America, Latin America, Europe, East Asia, South Asia, Oceania and Middle East and Africa.
North America is responsible for the largest share of the global pulse lavage market, followed by Europe, Asia-Pacific, Latin America, and Middle East & Africa.
North America is dominating the global market of pulse lavage by accounting for the biggest market share. This is primarily due to more aged population, increasing cases of bone disorders, well-established healthcare infrastructure, increasing orthopedic procedures, and existence of large number of hospitals.
Europe is predicted to showcase second highest share in pulse lavage market owing to rising population and of which geriatric population is more accountable for.
Besides the mentioned regions, Asia Pacific is said to be one of the swiftest growing markets. There are several factors that contribute to such growth in this region such as elderly population is on the rise, steady economic growth in several countries, many governments have focused aim towards healthcare sector, and increasing incidences of chronic diseases.
In recent years, there has been a considerable number of hospitals and clinics built in many prominent Asian countries and this also has bolstered the growth of pulse lavage market in this region.
How is the Pulse Lavage Market Competition?
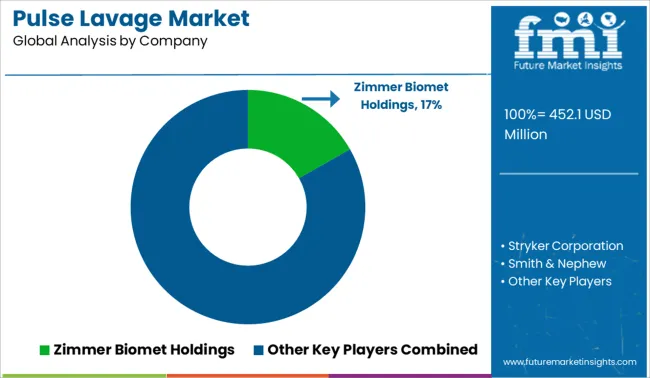
Some of the most prominent companies in the global Pulse Lavage market are Zimmer Biomet Holdings, Inc., Stryker Corporation, Smith & Nephew plc, LLC, Mölnlycke Health Care AB, Corin Orthopaedics Holding Ltd, C. R. Bard, Inc., Heraeus Holding GmbH, Judd Medical Limited De Soutter Medical Limited, MicroAire Surgical Instruments, and Atlantic Surgical Ltd.
Zimmer Biomet’s pulse lavage device called Pulsavac® Plus Wound Debridement systems come with a state-of-the-art functionality. It is equipped with 10 different tip options.
Many surgeons prefer this model since they can use handle-grip or pistol grip for each hand piece and thus making it convenient and easier to use.
Zimmer Biomet’s pulse lavage devices have trigger controlled pressure settings, light in weight and at the same time has a powerful cleaning action on the bone. This device also has an option of functioning under two types of power supply, viz., reusable power pack and traditional battery pack.

An unified Market Research Subscription Platform, built for today’s disparate research needs.
Scope Of Report
Report Attribute |
Details |
Growth rate |
CAGR of 8.2% from 2022 to 2032 |
Base year for estimation |
2021 |
Historical data |
2015 - 2020 |
Forecast period |
2022 - 2032 |
Quantitative units |
Revenue in USD Million, volume in kilotons, and CAGR from 2022 to 2032 |
Report coverage |
Revenue forecast, volume forecast, company ranking, competitive landscape, growth factors, and trends, Pricing Analysis |
Segments covered |
Product Type, Reusability, Region, Application, End User |
Regional scope |
North America; Western Europe, Eastern Europe, Middle East, Africa, ASEAN, South Asia, Rest of Asia, Australia and New Zealand |
Country scope |
U.S.; Canada; Mexico; Germany; U.K.; France; Italy; Spain; Russia; Belgium; Poland; Czech Republic; China; India; Japan; Australia; Brazil; Argentina; Colombia; Saudi Arabia; UAE; Iran; South Africa |
Key companies profiled |
GE Healthcare, Toshiba Medical System., Positron, Aetna Inc, NeuSoft, Bracco, Cigna, kmhlabs, Perimed AB., Siemens Health, Philips Healthcare, Lantheus Medical Cardiac Imaging Solutions Inc. |
Customization scope |
Free report customization (equivalent to up to 8 analysts working days) with purchase. Addition or alteration to country, regional & segment scope. |
Pricing and purchase options |
Avail customized purchase options to meet your exact research needs. |
Frequently Asked Questions
The global pulse lavage market is estimated to grow at a CAGR of 8.2% from 2022 to 2032.
North America is the key region accountable for highest revenue generation in this market.
Zimmer Biomet Holdings, Inc., Stryker Corporation, Smith & Nephew plc, LLC, Mölnlycke Health Care AB, C. R. Bard, Inc., Heraeus Holding GmbH, Corin Orthopaedics Holding Ltd, Judd Medical Limited De Soutter Medical Limited, and Atlantic Surgical Ltd. MicroAire Surgical Instruments.
1. Executive Summary
1.1. Global Market Outlook
1.2. Demand-side Trends
1.3. Supply-side Trends
1.4. Technology Roadmap Analysis
1.5. Analysis and Recommendations
2. Market Overview
2.1. Market Coverage / Taxonomy
2.2. Market Definition / Scope / Limitations
3. Market Background
3.1. Market Dynamics
3.1.1. Drivers
3.1.2. Restraints
3.1.3. Opportunity
3.1.4. Trends
3.2. Scenario Forecast
3.2.1. Demand in Optimistic Scenario
3.2.2. Demand in Likely Scenario
3.2.3. Demand in Conservative Scenario
3.3. Opportunity Map Analysis
3.4. Product Life Cycle Analysis
3.5. Supply Chain Analysis
3.5.1. Supply Side Participants and their Roles
3.5.1.1. Producers
3.5.1.2. Mid-Level Participants (Traders/ Agents/ Brokers)
3.5.1.3. Wholesalers and Distributors
3.5.2. Value Added and Value Created at Node in the Supply Chain
3.5.3. List of Raw Material Suppliers
3.5.4. List of Existing and Potential Buyer’s
3.6. Investment Feasibility Matrix
3.7. Value Chain Analysis
3.7.1. Profit Margin Analysis
3.7.2. Wholesalers and Distributors
3.7.3. Retailers
3.8. PESTLE and Porter’s Analysis
3.9. Regulatory Landscape
3.9.1. By Key Regions
3.9.2. By Key Countries
3.10. Regional Parent Market Outlook
3.11. Production and Consumption Statistics
3.12. Import and Export Statistics
4. Global Pulse Lavage Market Analysis 2017-2021 and Forecast, 2022-2032
4.1. Historical Market Size Value (US$ Mn) & Volume (Units) Analysis, 2017-2021
4.2. Current and Future Market Size Value (US$ Mn) & Volume (Units) Projections, 2022-2032
4.2.1. Y-o-Y Growth Trend Analysis
4.2.2. Absolute $ Opportunity Analysis
5. Global Pulse Lavage Market Analysis 2017-2021 and Forecast 2022-2032, By Product Type
5.1. Introduction / Key Findings
5.2. Historical Market Size Value (US$ Mn) & Volume (Units) Analysis By Product Type, 2017-2021
5.3. Current and Future Market Size Value (US$ Mn) & Volume (Units) Analysis and Forecast By Product Type, 2022-2032
5.3.1. Battery Powered Pulse Lavage System
5.3.2. Gas Powered Pulse Lavage System
5.4. Y-o-Y Growth Trend Analysis By Product Type, 2017-2021
5.5. Absolute $ Opportunity Analysis By Product Type, 2022-2032
6. Global Pulse Lavage Market Analysis 2017-2021 and Forecast 2022-2032, By Reusability
6.1. Introduction / Key Findings
6.2. Historical Market Size Value (US$ Mn) & Volume (Units) Analysis By Reusability, 2017-2021
6.3. Current and Future Market Size Value (US$ Mn) & Volume (Units) Analysis and Forecast By Reusability, 2022-2032
6.3.1. Disposable Pulse Lavage System
6.3.2. Reusable Pulse Lavage System
6.3.3. Semi Disposable Pulse Lavage System
6.4. Y-o-Y Growth Trend Analysis By Reusability, 2017-2021
6.5. Absolute $ Opportunity Analysis By Reusability, 2022-2032
7. Global Pulse Lavage Market Analysis 2017-2021 and Forecast 2022-2032, By Application
7.1. Introduction / Key Findings
7.2. Historical Market Size Value (US$ Mn) & Volume (Units) Analysis By Application, 2017-2021
7.3. Current and Future Market Size Value (US$ Mn) & Volume (Units) Analysis and Forecast By Application, 2022-2032
7.3.1. Orthopedic
7.3.2. Trauma
7.3.3. Wound Healing
7.4. Y-o-Y Growth Trend Analysis By Application, 2017-2021
7.5. Absolute $ Opportunity Analysis By Application, 2022-2032
8. Global Pulse Lavage Market Analysis 2017-2021 and Forecast 2022-2032, By End User
8.1. Introduction / Key Findings
8.2. Historical Market Size Value (US$ Mn) & Volume (Units) Analysis By End User, 2017-2021
8.3. Current and Future Market Size Value (US$ Mn) & Volume (Units) Analysis and Forecast By End User, 2022-2032
8.3.1. Hospitals
8.3.2. Specialty Clinics
8.3.3. Ambulatory Surgical Centers
8.3.4. Others
8.4. Y-o-Y Growth Trend Analysis By End User, 2017-2021
8.5. Absolute $ Opportunity Analysis By End User, 2022-2032
9. Global Pulse Lavage Market Analysis 2017-2021 and Forecast 2022-2032, By Region
9.1. Introduction
9.2. Historical Market Size Value (US$ Mn) & Volume (Units) Analysis By Region, 2017-2021
9.3. Current Market Size Value (US$ Mn) & Volume (Units) Analysis and Forecast By Region, 2022-2032
9.3.1. North America
9.3.2. Latin America
9.3.3. Europe
9.3.4. Asia Pacific
9.3.5. Middle East and Africa
9.4. Market Attractiveness Analysis By Region
10. North America Pulse Lavage Market Analysis 2017-2021 and Forecast 2022-2032, By Country
10.1. Historical Market Size Value (US$ Mn) & Volume (Units) Trend Analysis By Market Taxonomy, 2017-2021
10.2. Market Size Value (US$ Mn) & Volume (Units) Forecast By Market Taxonomy, 2022-2032
10.2.1. By Country
10.2.1.1. U.S.
10.2.1.2. Canada
10.2.2. By Product Type
10.2.3. By Reusability
10.2.4. By Application
10.2.5. By End User
10.3. Market Attractiveness Analysis
10.3.1. By Country
10.3.2. By Product Type
10.3.3. By Reusability
10.3.4. By Application
10.3.5. By End User
10.4. Key Takeaways
11. Latin America Pulse Lavage Market Analysis 2017-2021 and Forecast 2022-2032, By Country
11.1. Historical Market Size Value (US$ Mn) & Volume (Units) Trend Analysis By Market Taxonomy, 2017-2021
11.2. Market Size Value (US$ Mn) & Volume (Units) Forecast By Market Taxonomy, 2022-2032
11.2.1. By Country
11.2.1.1. Brazil
11.2.1.2. Mexico
11.2.1.3. Argentina
11.2.1.4. Chile
11.2.1.5. Peru
11.2.1.6. Rest of Latin America
11.2.2. By Product Type
11.2.3. By Reusability
11.2.4. By Application
11.2.5. By End User
11.3. Market Attractiveness Analysis
11.3.1. By Country
11.3.2. By Product Type
11.3.3. By Reusability
11.3.4. By Application
11.3.5. By End User
11.4. Key Takeaways
12. Europe Pulse Lavage Market Analysis 2017-2021 and Forecast 2022-2032, By Country
12.1. Historical Market Size Value (US$ Mn) & Volume (Units) Trend Analysis By Market Taxonomy, 2017-2021
12.2. Market Size Value (US$ Mn) & Volume (Units) Forecast By Market Taxonomy, 2022-2032
12.2.1. By Country
12.2.1.1. Germany
12.2.1.2. Italy
12.2.1.3. France
12.2.1.4. U.K.
12.2.1.5. Spain
12.2.1.6. Russia
12.2.1.7. BENELUX
12.2.1.8. Rest of Europe
12.2.2. By Product Type
12.2.3. By Reusability
12.2.4. By Application
12.2.5. By End User
12.3. Market Attractiveness Analysis
12.3.1. By Country
12.3.2. By Product Type
12.3.3. By Reusability
12.3.4. By Application
12.3.5. By End User
12.4. Key Takeaways
13. Asia Pacific Pulse Lavage Market Analysis 2017-2021 and Forecast 2022-2032, By Country
13.1. Historical Market Size Value (US$ Mn) & Volume (Units) Trend Analysis By Market Taxonomy, 2017-2021
13.2. Market Size Value (US$ Mn) & Volume (Units) Forecast By Market Taxonomy, 2022-2032
13.2.1. By Country
13.2.1.1. China
13.2.1.2. Japan
13.2.1.3. South Korea
13.2.1.4. Rest of Asia Pacific
13.2.2. By Product Type
13.2.3. By Reusability
13.2.4. By Application
13.2.5. By End User
13.3. Market Attractiveness Analysis
13.3.1. By Country
13.3.2. By Product Type
13.3.3. By Reusability
13.3.4. By Application
13.3.5. By End User
13.4. Key Takeaways
14. Middle East and Africa Pulse Lavage Market Analysis 2017-2021 and Forecast 2022-2032, By Country
14.1. Historical Market Size Value (US$ Mn) & Volume (Units) Trend Analysis By Market Taxonomy, 2017-2021
14.2. Market Size Value (US$ Mn) & Volume (Units) Forecast By Market Taxonomy, 2022-2032
14.2.1. By Country
14.2.1.1. GCC Countries
14.2.1.2. South Africa
14.2.1.3. Turkey
14.2.1.4. Rest of Middle East and Africa
14.2.2. By Product Type
14.2.3. By Reusability
14.2.4. By Application
14.2.5. By End User
14.3. Market Attractiveness Analysis
14.3.1. By Country
14.3.2. By Product Type
14.3.3. By Reusability
14.3.4. By Application
14.3.5. By End User
14.4. Key Takeaways
15. Key Countries Pulse Lavage Market Analysis
15.1. U.S.
15.1.1. Pricing Analysis
15.1.2. Market Share Analysis, 2021
15.1.2.1. By Product Type
15.1.2.2. By Reusability
15.1.2.3. By Application
15.1.2.4. By End User
15.2. Canada
15.2.1. Pricing Analysis
15.2.2. Market Share Analysis, 2021
15.2.2.1. By Product Type
15.2.2.2. By Reusability
15.2.2.3. By Application
15.2.2.4. By End User
15.3. Brazil
15.3.1. Pricing Analysis
15.3.2. Market Share Analysis, 2021
15.3.2.1. By Product Type
15.3.2.2. By Reusability
15.3.2.3. By Application
15.3.2.4. By End User
15.4. Mexico
15.4.1. Pricing Analysis
15.4.2. Market Share Analysis, 2021
15.4.2.1. By Product Type
15.4.2.2. By Reusability
15.4.2.3. By Application
15.4.2.4. By End User
15.5. Argentina
15.5.1. Pricing Analysis
15.5.2. Market Share Analysis, 2021
15.5.2.1. By Product Type
15.5.2.2. By Reusability
15.5.2.3. By Application
15.5.2.4. By End User
15.6. Chile
15.6.1. Pricing Analysis
15.6.2. Market Share Analysis, 2021
15.6.2.1. By Product Type
15.6.2.2. By Reusability
15.6.2.3. By Application
15.6.2.4. By End User
15.7. Peru
15.7.1. Pricing Analysis
15.7.2. Market Share Analysis, 2021
15.7.2.1. By Product Type
15.7.2.2. By Reusability
15.7.2.3. By Application
15.7.2.4. By End User
15.8. Germany
15.8.1. Pricing Analysis
15.8.2. Market Share Analysis, 2021
15.8.2.1. By Product Type
15.8.2.2. By Reusability
15.8.2.3. By Application
15.8.2.4. By End User
15.9. Italy
15.9.1. Pricing Analysis
15.9.2. Market Share Analysis, 2021
15.9.2.1. By Product Type
15.9.2.2. By Reusability
15.9.2.3. By Application
15.9.2.4. By End User
15.10. France
15.10.1. Pricing Analysis
15.10.2. Market Share Analysis, 2021
15.10.2.1. By Product Type
15.10.2.2. By Reusability
15.10.2.3. By Application
15.10.2.4. By End User
15.11. U.K.
15.11.1. Pricing Analysis
15.11.2. Market Share Analysis, 2021
15.11.2.1. By Product Type
15.11.2.2. By Reusability
15.11.2.3. By Application
15.11.2.4. By End User
15.12. Spain
15.12.1. Pricing Analysis
15.12.2. Market Share Analysis, 2021
15.12.2.1. By Product Type
15.12.2.2. By Reusability
15.12.2.3. By Application
15.12.2.4. By End User
15.13. Russia
15.13.1. Pricing Analysis
15.13.2. Market Share Analysis, 2021
15.13.2.1. By Product Type
15.13.2.2. By Reusability
15.13.2.3. By Application
15.13.2.4. By End User
15.14. BENELUX
15.14.1. Pricing Analysis
15.14.2. Market Share Analysis, 2021
15.14.2.1. By Product Type
15.14.2.2. By Reusability
15.14.2.3. By Application
15.14.2.4. By End User
15.15. China
15.15.1. Pricing Analysis
15.15.2. Market Share Analysis, 2021
15.15.2.1. By Product Type
15.15.2.2. By Reusability
15.15.2.3. By Application
15.15.2.4. By End User
15.16. Japan
15.16.1. Pricing Analysis
15.16.2. Market Share Analysis, 2021
15.16.2.1. By Product Type
15.16.2.2. By Reusability
15.16.2.3. By Application
15.16.2.4. By End User
15.17. South Korea
15.17.1. Pricing Analysis
15.17.2. Market Share Analysis, 2021
15.17.2.1. By Product Type
15.17.2.2. By Reusability
15.17.2.3. By Application
15.17.2.4. By End User
15.18. GCC Countries
15.18.1. Pricing Analysis
15.18.2. Market Share Analysis, 2021
15.18.2.1. By Product Type
15.18.2.2. By Reusability
15.18.2.3. By Application
15.18.2.4. By End User
15.19. South Africa
15.19.1. Pricing Analysis
15.19.2. Market Share Analysis, 2021
15.19.2.1. By Product Type
15.19.2.2. By Reusability
15.19.2.3. By Application
15.19.2.4. By End User
15.20. Turkey
15.20.1. Pricing Analysis
15.20.2. Market Share Analysis, 2021
15.20.2.1. By Product Type
15.20.2.2. By Reusability
15.20.2.3. By Application
15.20.2.4. By End User
16. Market Structure Analysis
16.1. Competition Dashboard
16.2. Competition Benchmarking
16.3. Market Share Analysis of Top Players
16.3.1. By Regional
16.3.2. By Product Type
16.3.3. By Reusability
16.3.4. By Application
16.3.5. By End User
17. Competition Analysis
17.1. Competition Deep Dive
17.1.1. Zimmer Biomet Holdings
17.1.1.1. Overview
17.1.1.2. Product Portfolio
17.1.1.3. Profitability by Market Segments
17.1.1.4. Sales Footprint
17.1.1.5. Strategy Overview
17.1.1.5.1. Marketing Strategy
17.1.1.5.2. Product Strategy
17.1.1.5.3. Channel Strategy
17.1.2. Stryker Corporation
17.1.2.1. Overview
17.1.2.2. Product Portfolio
17.1.2.3. Profitability by Market Segments
17.1.2.4. Sales Footprint
17.1.2.5. Strategy Overview
17.1.2.5.1. Marketing Strategy
17.1.2.5.2. Product Strategy
17.1.2.5.3. Channel Strategy
17.1.3. Smith & Nephew
17.1.3.1. Overview
17.1.3.2. Product Portfolio
17.1.3.3. Profitability by Market Segments
17.1.3.4. Sales Footprint
17.1.3.5. Strategy Overview
17.1.3.5.1. Marketing Strategy
17.1.3.5.2. Product Strategy
17.1.3.5.3. Channel Strategy
17.1.4. Mölnlycke Health Care AB
17.1.4.1. Overview
17.1.4.2. Product Portfolio
17.1.4.3. Profitability by Market Segments
17.1.4.4. Sales Footprint
17.1.4.5. Strategy Overview
17.1.4.5.1. Marketing Strategy
17.1.4.5.2. Product Strategy
17.1.4.5.3. Channel Strategy
17.1.5. Becton, Dickinson and Company
17.1.5.1. Overview
17.1.5.2. Product Portfolio
17.1.5.3. Profitability by Market Segments
17.1.5.4. Sales Footprint
17.1.5.5. Strategy Overview
17.1.5.5.1. Marketing Strategy
17.1.5.5.2. Product Strategy
17.1.5.5.3. Channel Strategy
17.1.6. Heraeus Holding GmbH
17.1.6.1. Overview
17.1.6.2. Product Portfolio
17.1.6.3. Profitability by Market Segments
17.1.6.4. Sales Footprint
17.1.6.5. Strategy Overview
17.1.6.5.1. Marketing Strategy
17.1.6.5.2. Product Strategy
17.1.6.5.3. Channel Strategy
17.1.7. Corin Orthopaedics Holding
17.1.7.1. Overview
17.1.7.2. Product Portfolio
17.1.7.3. Profitability by Market Segments
17.1.7.4. Sales Footprint
17.1.7.5. Strategy Overview
17.1.7.5.1. Marketing Strategy
17.1.7.5.2. Product Strategy
17.1.7.5.3. Channel Strategy
17.1.8. Judd Medical Limited
17.1.8.1. Overview
17.1.8.2. Product Portfolio
17.1.8.3. Profitability by Market Segments
17.1.8.4. Sales Footprint
17.1.8.5. Strategy Overview
17.1.8.5.1. Marketing Strategy
17.1.8.5.2. Product Strategy
17.1.8.5.3. Channel Strategy
17.1.9. De Soutter Medical Limited
17.1.9.1. Overview
17.1.9.2. Product Portfolio
17.1.9.3. Profitability by Market Segments
17.1.9.4. Sales Footprint
17.1.9.5. Strategy Overview
17.1.9.5.1. Marketing Strategy
17.1.9.5.2. Product Strategy
17.1.9.5.3. Channel Strategy
17.1.10. Atlantic Surgical Ltd
17.1.10.1. Overview
17.1.10.2. Product Portfolio
17.1.10.3. Profitability by Market Segments
17.1.10.4. Sales Footprint
17.1.10.5. Strategy Overview
17.1.10.5.1. Marketing Strategy
17.1.10.5.2. Product Strategy
17.1.10.5.3. Channel Strategy
17.1.11. MicroAire Surgical Instruments
17.1.11.1. Overview
17.1.11.2. Product Portfolio
17.1.11.3. Profitability by Market Segments
17.1.11.4. Sales Footprint
17.1.11.5. Strategy Overview
17.1.11.5.1. Marketing Strategy
17.1.11.5.2. Product Strategy
17.1.11.5.3. Channel Strategy
18. Assumptions & Acronyms Used
19. Research Methodology
Let us know your requirement to get
100% FREE customization
Table 1: Global Pulse Lavage Market Value (US$ Mn) Forecast by Region, 2017-2032
Table 2: Global Pulse Lavage Market Volume (Units) Forecast by Region, 2017-2032
Table 3: Global Pulse Lavage Market Value (US$ Mn) Forecast by Product Type, 2017-2032
Table 4: Global Pulse Lavage Market Volume (Units) Forecast by Product Type, 2017-2032
Table 5: Global Pulse Lavage Market Value (US$ Mn) Forecast by Reusability, 2017-2032
Table 6: Global Pulse Lavage Market Volume (Units) Forecast by Reusability, 2017-2032
Table 7: Global Pulse Lavage Market Value (US$ Mn) Forecast by Application, 2017-2032
Table 8: Global Pulse Lavage Market Volume (Units) Forecast by Application, 2017-2032
Table 9: Global Pulse Lavage Market Value (US$ Mn) Forecast by End User, 2017-2032
Table 10: Global Pulse Lavage Market Volume (Units) Forecast by End User, 2017-2032
Table 11: North America Pulse Lavage Market Value (US$ Mn) Forecast by Country, 2017-2032
Table 12: North America Pulse Lavage Market Volume (Units) Forecast by Country, 2017-2032
Table 13: North America Pulse Lavage Market Value (US$ Mn) Forecast by Product Type, 2017-2032
Table 14: North America Pulse Lavage Market Volume (Units) Forecast by Product Type, 2017-2032
Table 15: North America Pulse Lavage Market Value (US$ Mn) Forecast by Reusability, 2017-2032
Table 16: North America Pulse Lavage Market Volume (Units) Forecast by Reusability, 2017-2032
Table 17: North America Pulse Lavage Market Value (US$ Mn) Forecast by Application, 2017-2032
Table 18: North America Pulse Lavage Market Volume (Units) Forecast by Application, 2017-2032
Table 19: North America Pulse Lavage Market Value (US$ Mn) Forecast by End User, 2017-2032
Table 20: North America Pulse Lavage Market Volume (Units) Forecast by End User, 2017-2032
Table 21: Latin America Pulse Lavage Market Value (US$ Mn) Forecast by Country, 2017-2032
Table 22: Latin America Pulse Lavage Market Volume (Units) Forecast by Country, 2017-2032
Table 23: Latin America Pulse Lavage Market Value (US$ Mn) Forecast by Product Type, 2017-2032
Table 24: Latin America Pulse Lavage Market Volume (Units) Forecast by Product Type, 2017-2032
Table 25: Latin America Pulse Lavage Market Value (US$ Mn) Forecast by Reusability, 2017-2032
Table 26: Latin America Pulse Lavage Market Volume (Units) Forecast by Reusability, 2017-2032
Table 27: Latin America Pulse Lavage Market Value (US$ Mn) Forecast by Application, 2017-2032
Table 28: Latin America Pulse Lavage Market Volume (Units) Forecast by Application, 2017-2032
Table 29: Latin America Pulse Lavage Market Value (US$ Mn) Forecast by End User, 2017-2032
Table 30: Latin America Pulse Lavage Market Volume (Units) Forecast by End User, 2017-2032
Table 31: Europe Pulse Lavage Market Value (US$ Mn) Forecast by Country, 2017-2032
Table 32: Europe Pulse Lavage Market Volume (Units) Forecast by Country, 2017-2032
Table 33: Europe Pulse Lavage Market Value (US$ Mn) Forecast by Product Type, 2017-2032
Table 34: Europe Pulse Lavage Market Volume (Units) Forecast by Product Type, 2017-2032
Table 35: Europe Pulse Lavage Market Value (US$ Mn) Forecast by Reusability, 2017-2032
Table 36: Europe Pulse Lavage Market Volume (Units) Forecast by Reusability, 2017-2032
Table 37: Europe Pulse Lavage Market Value (US$ Mn) Forecast by Application, 2017-2032
Table 38: Europe Pulse Lavage Market Volume (Units) Forecast by Application, 2017-2032
Table 39: Europe Pulse Lavage Market Value (US$ Mn) Forecast by End User, 2017-2032
Table 40: Europe Pulse Lavage Market Volume (Units) Forecast by End User, 2017-2032
Table 41: Asia Pacific Pulse Lavage Market Value (US$ Mn) Forecast by Country, 2017-2032
Table 42: Asia Pacific Pulse Lavage Market Volume (Units) Forecast by Country, 2017-2032
Table 43: Asia Pacific Pulse Lavage Market Value (US$ Mn) Forecast by Product Type, 2017-2032
Table 44: Asia Pacific Pulse Lavage Market Volume (Units) Forecast by Product Type, 2017-2032
Table 45: Asia Pacific Pulse Lavage Market Value (US$ Mn) Forecast by Reusability, 2017-2032
Table 46: Asia Pacific Pulse Lavage Market Volume (Units) Forecast by Reusability, 2017-2032
Table 47: Asia Pacific Pulse Lavage Market Value (US$ Mn) Forecast by Application, 2017-2032
Table 48: Asia Pacific Pulse Lavage Market Volume (Units) Forecast by Application, 2017-2032
Table 49: Asia Pacific Pulse Lavage Market Value (US$ Mn) Forecast by End User, 2017-2032
Table 50: Asia Pacific Pulse Lavage Market Volume (Units) Forecast by End User, 2017-2032
Table 51: Middle East and Africa Pulse Lavage Market Value (US$ Mn) Forecast by Country, 2017-2032
Table 52: Middle East and Africa Pulse Lavage Market Volume (Units) Forecast by Country, 2017-2032
Table 53: Middle East and Africa Pulse Lavage Market Value (US$ Mn) Forecast by Product Type, 2017-2032
Table 54: Middle East and Africa Pulse Lavage Market Volume (Units) Forecast by Product Type, 2017-2032
Table 55: Middle East and Africa Pulse Lavage Market Value (US$ Mn) Forecast by Reusability, 2017-2032
Table 56: Middle East and Africa Pulse Lavage Market Volume (Units) Forecast by Reusability, 2017-2032
Table 57: Middle East and Africa Pulse Lavage Market Value (US$ Mn) Forecast by Application, 2017-2032
Table 58: Middle East and Africa Pulse Lavage Market Volume (Units) Forecast by Application, 2017-2032
Table 59: Middle East and Africa Pulse Lavage Market Value (US$ Mn) Forecast by End User, 2017-2032
Table 60: Middle East and Africa Pulse Lavage Market Volume (Units) Forecast by End User, 2017-2032
Find your sweet spots for generating winning opportunities in this market.
Talk to AnalystFigure 1: Global Pulse Lavage Market Value (US$ Mn) by Product Type, 2022-2032
Figure 2: Global Pulse Lavage Market Value (US$ Mn) by Reusability, 2022-2032
Figure 3: Global Pulse Lavage Market Value (US$ Mn) by Application, 2022-2032
Figure 4: Global Pulse Lavage Market Value (US$ Mn) by End User, 2022-2032
Figure 5: Global Pulse Lavage Market Value (US$ Mn) by Region, 2022-2032
Figure 6: Global Pulse Lavage Market Value (US$ Mn) Analysis by Region, 2017-2032
Figure 7: Global Pulse Lavage Market Volume (Units) Analysis by Region, 2017-2032
Figure 8: Global Pulse Lavage Market Value Share (%) and BPS Analysis by Region, 2022-2032
Figure 9: Global Pulse Lavage Market Y-o-Y Growth (%) Projections by Region, 2022-2032
Figure 10: Global Pulse Lavage Market Value (US$ Mn) Analysis by Product Type, 2017-2032
Figure 11: Global Pulse Lavage Market Volume (Units) Analysis by Product Type, 2017-2032
Figure 12: Global Pulse Lavage Market Value Share (%) and BPS Analysis by Product Type, 2022-2032
Figure 13: Global Pulse Lavage Market Y-o-Y Growth (%) Projections by Product Type, 2022-2032
Figure 14: Global Pulse Lavage Market Value (US$ Mn) Analysis by Reusability, 2017-2032
Figure 15: Global Pulse Lavage Market Volume (Units) Analysis by Reusability, 2017-2032
Figure 16: Global Pulse Lavage Market Value Share (%) and BPS Analysis by Reusability, 2022-2032
Figure 17: Global Pulse Lavage Market Y-o-Y Growth (%) Projections by Reusability, 2022-2032
Figure 18: Global Pulse Lavage Market Value (US$ Mn) Analysis by Application, 2017-2032
Figure 19: Global Pulse Lavage Market Volume (Units) Analysis by Application, 2017-2032
Figure 20: Global Pulse Lavage Market Value Share (%) and BPS Analysis by Application, 2022-2032
Figure 21: Global Pulse Lavage Market Y-o-Y Growth (%) Projections by Application, 2022-2032
Figure 22: Global Pulse Lavage Market Value (US$ Mn) Analysis by End User, 2017-2032
Figure 23: Global Pulse Lavage Market Volume (Units) Analysis by End User, 2017-2032
Figure 24: Global Pulse Lavage Market Value Share (%) and BPS Analysis by End User, 2022-2032
Figure 25: Global Pulse Lavage Market Y-o-Y Growth (%) Projections by End User, 2022-2032
Figure 26: Global Pulse Lavage Market Attractiveness by Product Type, 2022-2032
Figure 27: Global Pulse Lavage Market Attractiveness by Reusability, 2022-2032
Figure 28: Global Pulse Lavage Market Attractiveness by Application, 2022-2032
Figure 29: Global Pulse Lavage Market Attractiveness by End User, 2022-2032
Figure 30: Global Pulse Lavage Market Attractiveness by Region, 2022-2032
Figure 31: North America Pulse Lavage Market Value (US$ Mn) by Product Type, 2022-2032
Figure 32: North America Pulse Lavage Market Value (US$ Mn) by Reusability, 2022-2032
Figure 33: North America Pulse Lavage Market Value (US$ Mn) by Application, 2022-2032
Figure 34: North America Pulse Lavage Market Value (US$ Mn) by End User, 2022-2032
Figure 35: North America Pulse Lavage Market Value (US$ Mn) by Country, 2022-2032
Figure 36: North America Pulse Lavage Market Value (US$ Mn) Analysis by Country, 2017-2032
Figure 37: North America Pulse Lavage Market Volume (Units) Analysis by Country, 2017-2032
Figure 38: North America Pulse Lavage Market Value Share (%) and BPS Analysis by Country, 2022-2032
Figure 39: North America Pulse Lavage Market Y-o-Y Growth (%) Projections by Country, 2022-2032
Figure 40: North America Pulse Lavage Market Value (US$ Mn) Analysis by Product Type, 2017-2032
Figure 41: North America Pulse Lavage Market Volume (Units) Analysis by Product Type, 2017-2032
Figure 42: North America Pulse Lavage Market Value Share (%) and BPS Analysis by Product Type, 2022-2032
Figure 43: North America Pulse Lavage Market Y-o-Y Growth (%) Projections by Product Type, 2022-2032
Figure 44: North America Pulse Lavage Market Value (US$ Mn) Analysis by Reusability, 2017-2032
Figure 45: North America Pulse Lavage Market Volume (Units) Analysis by Reusability, 2017-2032
Figure 46: North America Pulse Lavage Market Value Share (%) and BPS Analysis by Reusability, 2022-2032
Figure 47: North America Pulse Lavage Market Y-o-Y Growth (%) Projections by Reusability, 2022-2032
Figure 48: North America Pulse Lavage Market Value (US$ Mn) Analysis by Application, 2017-2032
Figure 49: North America Pulse Lavage Market Volume (Units) Analysis by Application, 2017-2032
Figure 50: North America Pulse Lavage Market Value Share (%) and BPS Analysis by Application, 2022-2032
Figure 51: North America Pulse Lavage Market Y-o-Y Growth (%) Projections by Application, 2022-2032
Figure 52: North America Pulse Lavage Market Value (US$ Mn) Analysis by End User, 2017-2032
Figure 53: North America Pulse Lavage Market Volume (Units) Analysis by End User, 2017-2032
Figure 54: North America Pulse Lavage Market Value Share (%) and BPS Analysis by End User, 2022-2032
Figure 55: North America Pulse Lavage Market Y-o-Y Growth (%) Projections by End User, 2022-2032
Figure 56: North America Pulse Lavage Market Attractiveness by Product Type, 2022-2032
Figure 57: North America Pulse Lavage Market Attractiveness by Reusability, 2022-2032
Figure 58: North America Pulse Lavage Market Attractiveness by Application, 2022-2032
Figure 59: North America Pulse Lavage Market Attractiveness by End User, 2022-2032
Figure 60: North America Pulse Lavage Market Attractiveness by Country, 2022-2032
Figure 61: Latin America Pulse Lavage Market Value (US$ Mn) by Product Type, 2022-2032
Figure 62: Latin America Pulse Lavage Market Value (US$ Mn) by Reusability, 2022-2032
Figure 63: Latin America Pulse Lavage Market Value (US$ Mn) by Application, 2022-2032
Figure 64: Latin America Pulse Lavage Market Value (US$ Mn) by End User, 2022-2032
Figure 65: Latin America Pulse Lavage Market Value (US$ Mn) by Country, 2022-2032
Figure 66: Latin America Pulse Lavage Market Value (US$ Mn) Analysis by Country, 2017-2032
Figure 67: Latin America Pulse Lavage Market Volume (Units) Analysis by Country, 2017-2032
Figure 68: Latin America Pulse Lavage Market Value Share (%) and BPS Analysis by Country, 2022-2032
Figure 69: Latin America Pulse Lavage Market Y-o-Y Growth (%) Projections by Country, 2022-2032
Figure 70: Latin America Pulse Lavage Market Value (US$ Mn) Analysis by Product Type, 2017-2032
Figure 71: Latin America Pulse Lavage Market Volume (Units) Analysis by Product Type, 2017-2032
Figure 72: Latin America Pulse Lavage Market Value Share (%) and BPS Analysis by Product Type, 2022-2032
Figure 73: Latin America Pulse Lavage Market Y-o-Y Growth (%) Projections by Product Type, 2022-2032
Figure 74: Latin America Pulse Lavage Market Value (US$ Mn) Analysis by Reusability, 2017-2032
Figure 75: Latin America Pulse Lavage Market Volume (Units) Analysis by Reusability, 2017-2032
Figure 76: Latin America Pulse Lavage Market Value Share (%) and BPS Analysis by Reusability, 2022-2032
Figure 77: Latin America Pulse Lavage Market Y-o-Y Growth (%) Projections by Reusability, 2022-2032
Figure 78: Latin America Pulse Lavage Market Value (US$ Mn) Analysis by Application, 2017-2032
Figure 79: Latin America Pulse Lavage Market Volume (Units) Analysis by Application, 2017-2032
Figure 80: Latin America Pulse Lavage Market Value Share (%) and BPS Analysis by Application, 2022-2032
Figure 81: Latin America Pulse Lavage Market Y-o-Y Growth (%) Projections by Application, 2022-2032
Figure 82: Latin America Pulse Lavage Market Value (US$ Mn) Analysis by End User, 2017-2032
Figure 83: Latin America Pulse Lavage Market Volume (Units) Analysis by End User, 2017-2032
Figure 84: Latin America Pulse Lavage Market Value Share (%) and BPS Analysis by End User, 2022-2032
Figure 85: Latin America Pulse Lavage Market Y-o-Y Growth (%) Projections by End User, 2022-2032
Figure 86: Latin America Pulse Lavage Market Attractiveness by Product Type, 2022-2032
Figure 87: Latin America Pulse Lavage Market Attractiveness by Reusability, 2022-2032
Figure 88: Latin America Pulse Lavage Market Attractiveness by Application, 2022-2032
Figure 89: Latin America Pulse Lavage Market Attractiveness by End User, 2022-2032
Figure 90: Latin America Pulse Lavage Market Attractiveness by Country, 2022-2032
Figure 91: Europe Pulse Lavage Market Value (US$ Mn) by Product Type, 2022-2032
Figure 92: Europe Pulse Lavage Market Value (US$ Mn) by Reusability, 2022-2032
Figure 93: Europe Pulse Lavage Market Value (US$ Mn) by Application, 2022-2032
Figure 94: Europe Pulse Lavage Market Value (US$ Mn) by End User, 2022-2032
Figure 95: Europe Pulse Lavage Market Value (US$ Mn) by Country, 2022-2032
Figure 96: Europe Pulse Lavage Market Value (US$ Mn) Analysis by Country, 2017-2032
Figure 97: Europe Pulse Lavage Market Volume (Units) Analysis by Country, 2017-2032
Figure 98: Europe Pulse Lavage Market Value Share (%) and BPS Analysis by Country, 2022-2032
Figure 99: Europe Pulse Lavage Market Y-o-Y Growth (%) Projections by Country, 2022-2032
Figure 100: Europe Pulse Lavage Market Value (US$ Mn) Analysis by Product Type, 2017-2032
Figure 101: Europe Pulse Lavage Market Volume (Units) Analysis by Product Type, 2017-2032
Figure 102: Europe Pulse Lavage Market Value Share (%) and BPS Analysis by Product Type, 2022-2032
Figure 103: Europe Pulse Lavage Market Y-o-Y Growth (%) Projections by Product Type, 2022-2032
Figure 104: Europe Pulse Lavage Market Value (US$ Mn) Analysis by Reusability, 2017-2032
Figure 105: Europe Pulse Lavage Market Volume (Units) Analysis by Reusability, 2017-2032
Figure 106: Europe Pulse Lavage Market Value Share (%) and BPS Analysis by Reusability, 2022-2032
Figure 107: Europe Pulse Lavage Market Y-o-Y Growth (%) Projections by Reusability, 2022-2032
Figure 108: Europe Pulse Lavage Market Value (US$ Mn) Analysis by Application, 2017-2032
Figure 109: Europe Pulse Lavage Market Volume (Units) Analysis by Application, 2017-2032
Figure 110: Europe Pulse Lavage Market Value Share (%) and BPS Analysis by Application, 2022-2032
Figure 111: Europe Pulse Lavage Market Y-o-Y Growth (%) Projections by Application, 2022-2032
Figure 112: Europe Pulse Lavage Market Value (US$ Mn) Analysis by End User, 2017-2032
Figure 113: Europe Pulse Lavage Market Volume (Units) Analysis by End User, 2017-2032
Figure 114: Europe Pulse Lavage Market Value Share (%) and BPS Analysis by End User, 2022-2032
Figure 115: Europe Pulse Lavage Market Y-o-Y Growth (%) Projections by End User, 2022-2032
Figure 116: Europe Pulse Lavage Market Attractiveness by Product Type, 2022-2032
Figure 117: Europe Pulse Lavage Market Attractiveness by Reusability, 2022-2032
Figure 118: Europe Pulse Lavage Market Attractiveness by Application, 2022-2032
Figure 119: Europe Pulse Lavage Market Attractiveness by End User, 2022-2032
Figure 120: Europe Pulse Lavage Market Attractiveness by Country, 2022-2032
Figure 121: Asia Pacific Pulse Lavage Market Value (US$ Mn) by Product Type, 2022-2032
Figure 122: Asia Pacific Pulse Lavage Market Value (US$ Mn) by Reusability, 2022-2032
Figure 123: Asia Pacific Pulse Lavage Market Value (US$ Mn) by Application, 2022-2032
Figure 124: Asia Pacific Pulse Lavage Market Value (US$ Mn) by End User, 2022-2032
Figure 125: Asia Pacific Pulse Lavage Market Value (US$ Mn) by Country, 2022-2032
Figure 126: Asia Pacific Pulse Lavage Market Value (US$ Mn) Analysis by Country, 2017-2032
Figure 127: Asia Pacific Pulse Lavage Market Volume (Units) Analysis by Country, 2017-2032
Figure 128: Asia Pacific Pulse Lavage Market Value Share (%) and BPS Analysis by Country, 2022-2032
Figure 129: Asia Pacific Pulse Lavage Market Y-o-Y Growth (%) Projections by Country, 2022-2032
Figure 130: Asia Pacific Pulse Lavage Market Value (US$ Mn) Analysis by Product Type, 2017-2032
Figure 131: Asia Pacific Pulse Lavage Market Volume (Units) Analysis by Product Type, 2017-2032
Figure 132: Asia Pacific Pulse Lavage Market Value Share (%) and BPS Analysis by Product Type, 2022-2032
Figure 133: Asia Pacific Pulse Lavage Market Y-o-Y Growth (%) Projections by Product Type, 2022-2032
Figure 134: Asia Pacific Pulse Lavage Market Value (US$ Mn) Analysis by Reusability, 2017-2032
Figure 135: Asia Pacific Pulse Lavage Market Volume (Units) Analysis by Reusability, 2017-2032
Figure 136: Asia Pacific Pulse Lavage Market Value Share (%) and BPS Analysis by Reusability, 2022-2032
Figure 137: Asia Pacific Pulse Lavage Market Y-o-Y Growth (%) Projections by Reusability, 2022-2032
Figure 138: Asia Pacific Pulse Lavage Market Value (US$ Mn) Analysis by Application, 2017-2032
Figure 139: Asia Pacific Pulse Lavage Market Volume (Units) Analysis by Application, 2017-2032
Figure 140: Asia Pacific Pulse Lavage Market Value Share (%) and BPS Analysis by Application, 2022-2032
Figure 141: Asia Pacific Pulse Lavage Market Y-o-Y Growth (%) Projections by Application, 2022-2032
Figure 142: Asia Pacific Pulse Lavage Market Value (US$ Mn) Analysis by End User, 2017-2032
Figure 143: Asia Pacific Pulse Lavage Market Volume (Units) Analysis by End User, 2017-2032
Figure 144: Asia Pacific Pulse Lavage Market Value Share (%) and BPS Analysis by End User, 2022-2032
Figure 145: Asia Pacific Pulse Lavage Market Y-o-Y Growth (%) Projections by End User, 2022-2032
Figure 146: Asia Pacific Pulse Lavage Market Attractiveness by Product Type, 2022-2032
Figure 147: Asia Pacific Pulse Lavage Market Attractiveness by Reusability, 2022-2032
Figure 148: Asia Pacific Pulse Lavage Market Attractiveness by Application, 2022-2032
Figure 149: Asia Pacific Pulse Lavage Market Attractiveness by End User, 2022-2032
Figure 150: Asia Pacific Pulse Lavage Market Attractiveness by Country, 2022-2032
Figure 151: Middle East and Africa Pulse Lavage Market Value (US$ Mn) by Product Type, 2022-2032
Figure 152: Middle East and Africa Pulse Lavage Market Value (US$ Mn) by Reusability, 2022-2032
Figure 153: Middle East and Africa Pulse Lavage Market Value (US$ Mn) by Application, 2022-2032
Figure 154: Middle East and Africa Pulse Lavage Market Value (US$ Mn) by End User, 2022-2032
Figure 155: Middle East and Africa Pulse Lavage Market Value (US$ Mn) by Country, 2022-2032
Figure 156: Middle East and Africa Pulse Lavage Market Value (US$ Mn) Analysis by Country, 2017-2032
Figure 157: Middle East and Africa Pulse Lavage Market Volume (Units) Analysis by Country, 2017-2032
Figure 158: Middle East and Africa Pulse Lavage Market Value Share (%) and BPS Analysis by Country, 2022-2032
Figure 159: Middle East and Africa Pulse Lavage Market Y-o-Y Growth (%) Projections by Country, 2022-2032
Figure 160: Middle East and Africa Pulse Lavage Market Value (US$ Mn) Analysis by Product Type, 2017-2032
Figure 161: Middle East and Africa Pulse Lavage Market Volume (Units) Analysis by Product Type, 2017-2032
Figure 162: Middle East and Africa Pulse Lavage Market Value Share (%) and BPS Analysis by Product Type, 2022-2032
Figure 163: Middle East and Africa Pulse Lavage Market Y-o-Y Growth (%) Projections by Product Type, 2022-2032
Figure 164: Middle East and Africa Pulse Lavage Market Value (US$ Mn) Analysis by Reusability, 2017-2032
Figure 165: Middle East and Africa Pulse Lavage Market Volume (Units) Analysis by Reusability, 2017-2032
Figure 166: Middle East and Africa Pulse Lavage Market Value Share (%) and BPS Analysis by Reusability, 2022-2032
Figure 167: Middle East and Africa Pulse Lavage Market Y-o-Y Growth (%) Projections by Reusability, 2022-2032
Figure 168: Middle East and Africa Pulse Lavage Market Value (US$ Mn) Analysis by Application, 2017-2032
Figure 169: Middle East and Africa Pulse Lavage Market Volume (Units) Analysis by Application, 2017-2032
Figure 170: Middle East and Africa Pulse Lavage Market Value Share (%) and BPS Analysis by Application, 2022-2032
Figure 171: Middle East and Africa Pulse Lavage Market Y-o-Y Growth (%) Projections by Application, 2022-2032
Figure 172: Middle East and Africa Pulse Lavage Market Value (US$ Mn) Analysis by End User, 2017-2032
Figure 173: Middle East and Africa Pulse Lavage Market Volume (Units) Analysis by End User, 2017-2032
Figure 174: Middle East and Africa Pulse Lavage Market Value Share (%) and BPS Analysis by End User, 2022-2032
Figure 175: Middle East and Africa Pulse Lavage Market Y-o-Y Growth (%) Projections by End User, 2022-2032
Figure 176: Middle East and Africa Pulse Lavage Market Attractiveness by Product Type, 2022-2032
Figure 177: Middle East and Africa Pulse Lavage Market Attractiveness by Reusability, 2022-2032
Figure 178: Middle East and Africa Pulse Lavage Market Attractiveness by Application, 2022-2032
Figure 179: Middle East and Africa Pulse Lavage Market Attractiveness by End User, 2022-2032
Figure 180: Middle East and Africa Pulse Lavage Market Attractiveness by Country, 2022-2032
Need specific information?
Request CustomizationExplore Healthcare Insights
View Reports