Pulses Market
Market Insights on Pulses covering sales outlook, demand forecast & up-to-date key trends
Pulses Market By Product Type (Dry Beans, Lentils, Faba Beans, Dry Peas, Chickpeas, Cowpeas, Bambara Bean), Nature (Organic, Conventional), Form (Whole, Flour, Split), End Use Application (B2B, Food & Beverage Industry, Pharmaceutical Industry, Cosmetic Industry) & Region - Forecast to 2020 - 2030
Introduction
Pulses form an integral part of human food and come in various types. They belong to the legume family and are usually rich in fiber content, containing miniscule amounts of fat.
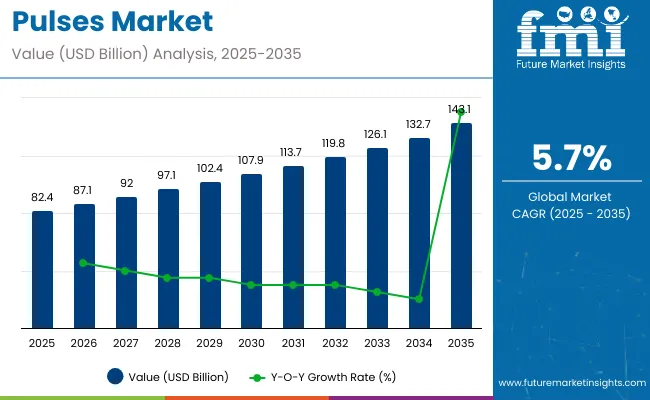
Pulses help reduce cholesterol and triglyceride levels within the human body. Due to this, they are extensively consumed across the world. The projections for pulses remain bullish, with a new analysis by Future Market Insights estimating 4.9% CAGR through 2030. A slight deceleration is anticipated in the short-run due to the coronavirus pandemic.
Let us know your requirement to get
100% FREE customization
Soaring Demand for RTE Foodstuffs
Healthy eating has become a priority for both urban and rural consumers. As more consumers become conscious about the ill-effects of sedentary lives, they are switching towards fiber-rich and low-fat diets. Consequently, the popularity of ready-to-eat foodstuffs has surged.
Pulse-based instant snacks are thus acquiring momentum. Pulses are being incorporated in pasta, bakery products, dry snacks, meat analogs and cereal bars to improve the functionality. Growing focus on healthy eating is likely to sustain demand for pulses in the long run.
Rising Government Support
Since pulses are a staple diet across several developing regions, governments are extending financial support and other incentives to increase production. Countries have implemented various food programs aimed at boosting pulse production in recent years.
They are primarily concentrating on bridging the demand-supply gap, streamlining distribution processes by eliminating middlemen and provide a fair remuneration to the farmers. Such initiatives have yielded credible benefits, thus providing traction to market players.
Find your sweet spots for generating winning opportunities in this market.
Talk to AnalystAlternate Protein Substitutes Can Impede Growth
Market players can face stiff competition from alternative protein sources such as soybeans, hemp, flex, nuts and oilseed. In most countries, price of pulses are phenomenally high. This is generally attributed to the presence of interim entities who seek to profit from the trade.
As a result, consumption of the aforementioned substitutes has witnessed a significant spike in the recent past. Consumption of these alternatives is also associated with the increasing fad appeal. All these factors are anticipated to hinder growth prospects of the global pulses market.
Regional Outlook
APEJ Pulses Market
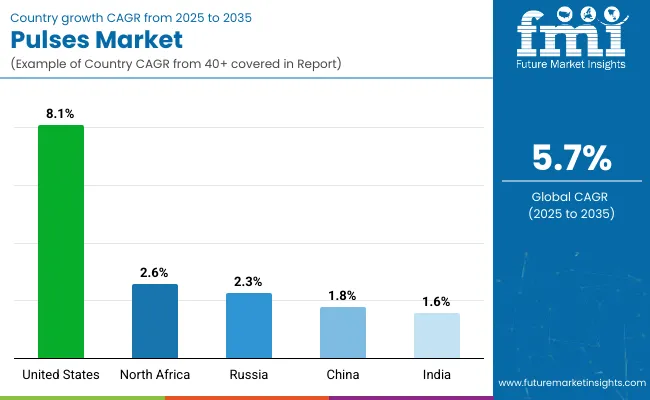
The Asia-Pacific excluding Japan (APEJ) pulses landscape is poised to emerge as the most lucrative market. It is likely to account for nearly 3/5th of the revenue share, expanding at a value CAGR of ~6%.
Growth is underpinned by rising urbanization, surging disposable incomes and high demand for healthy ready-to-eat and processed foods. Also, the concentration of a large population base across India and China is accelerating the need for nutritious food, prompting them to increase overall pulse production.
Amongst all countries, India is set to lead the regional market, as it is the world’s leading pulses producer. It produces nearly a quarter of the global yield and consumes nearly the same amount domestically.
MEA Pulses Market
Non-traditional markets such as the Middle East & Africa are touted to emerge as promising growth hotspots during the assessment period. In spite of a slight deceleration due to COVID-19, growth prospects remain largely optimistic.
As concerns over excessive meat consumption on human health dawn on consumers, they are seeking healthier alternatives. Resultantly, the market for pulses is witnessing notable upsurge. According to FMI, the MEA market is likely to generate over 1/5th of the global revenue share.
High consumption of pulses is likely to be in the whole form, given the high need for good quality nutrition in countries suffering from severe hunger and malnutrition. This is largely expected to occur throughout Africa.
Europe Pulses Market
The European pulses market size is set to expand at a CAGR of over 3% during the 2020-2030 forecast. Increasing preference for fiber rich diet is propelling the market in a positive direction.
Collectively, Spain, France and the U.K. account for 60% of the European pulse consumption. With respect to product type, dried beans are likely to be the most consumed across most countries.
This surge in pulse consumption is a consequence of increasing healthy eating habits. Consumers are slowly drifting towards plant-based foods. Therefore, several food manufacturers are foraying into potential markets across the region.
Category-wise Insights
Dry Beans to Reach ~US$ 50 Bn by 2030
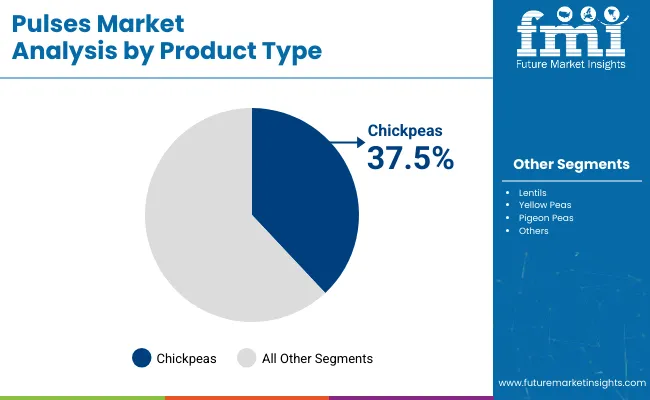
By product type, dry beans are poised to be widely consumed, capturing nearly 45% of revenue. Dry beans are a rich source of essential micronutrients such as potassium and iron.
Chickpeas market is likely to ride the coattails, generating 1/4th of the global revenue and expanding at a value CAGR of 7%. Presence of a high fiber content along with essential vitamins is driving the segment’s growth.
Pulses Market Trend: Organic Gaining Momentum
Rising demand for clean-label foodstuffs is rapidly boosting popularity of organic pulses. Excessive usage of chemical fertilizers and pesticides has degenerated product quality, reducing the nutrient content and replacing it with toxic substances.
Concerned by this, governments and healthcare specialists are advocating the use of natural fertilizers and supplements during the production process. According to FMI, the organic pulses segment is set to expand at a noteworthy 7.9% CAGR from 2020-2030.
Pulse Flour to Expand Fastest by Form
The pulse flour segment is projected to acquire maximum traction, expanding at a CAGR of 6.2%. Pulse flour is extensively used in various food preparations as they contain higher protein compared to gluten-based flours. Also, high prevalence of gluten-intolerance is driving the pulse flour market positively.
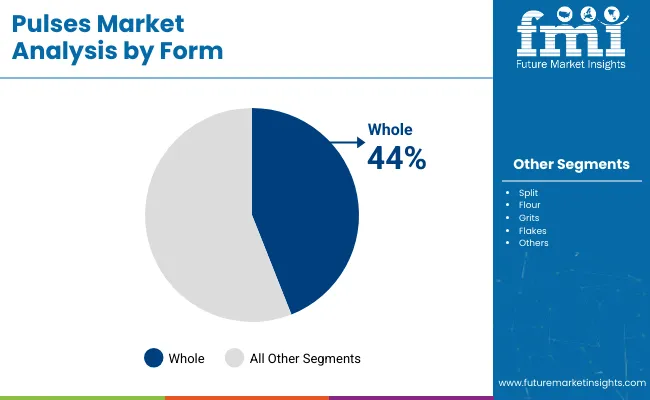
However, whole pulses shall remain a lucrative category, owing to the rising requirement of fibers by the human body. The segment is expected to generate over 40% of the global revenue in the forthcoming decade.
E-Commerce Procurement Gaining Ground
With the onset of COVID-19, e-commerce platforms are acquiring popularity as consumers and distributors rely on virtual platforms to procure their merchandize. The same holds true for the pulses market. A staggering CAGR of ~9% is predicted for this segment.
At the same time, store-based retailing is not expected to lose popularity, accounting for over eight out of ten sales of pulses and pulse-derived products. The hypermarkets segment is expected to remain the most preferred source of purchase by consumers.
COVID-19 Impact Analysis
As the COVID-19 pandemic tightens its grip around the world, the global pulses market has experienced minor deceleration. This is mostly due to constraints in transporting finished products to the market. Fortunately, this setback is eroding with easing of lockdown restrictions.
Moreover, growth is largely being sustained by e-commerce channels, despite conventional retail outlets resuming operations. Voluntary social distancing measures adopted by consumers is driving this purchasing behavior. Nowadays, consumers rely on platforms such as Big Basket, Amazon and Grofers to purchase pulses.
Furthermore, the trend of healthy eating has augmented, with consumers hoping to strengthen their immunity by eating fiber, nutrient and vitamin rich foodstuffs. Therefore, growth prospects of the global pulses market appear largely optimistic throughout the 2020-2030 assessment period.
Global Pulses Market- Competitive Landscape
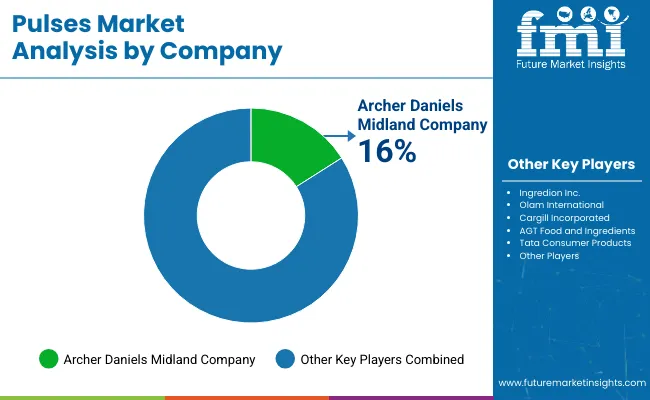
The global pulses market is interspersed with several prominent vendors. In FMI’s report, the following players have been profiled*:
- Nestle SA,
- Groupe Danone,
- Reckitt Benckiser Group Plc (RB)
- Abbott Laboratories Inc.
- Vitasoy International Holdings Ltd
- Inner Mongolia Yili Industrial Group Co Ltd.
- Coca-Cola Co
- General Mills Inc.
- Blue Diamond Growers
- Kikkoman Corporation
- Dr. Schär AG/SpA
- Lactalis Groupe
- Valio Oy
- Post Holdings Inc.
- Monde Nissin Corp.
*This list is indicative- full details about the global pulses market players is available upon request.
The primary emphasis of the global pulses market players lies on introducing innovative and customized products based on customer-specific requirements. Additionally, strategic collaborations, partnerships and ventures are relied upon as well.
For instance, in 2017, Danone acquired WhiteWave, a prominent plant-based food & beverages manufacturer with the objective of expanding its own range of plant-based foods and beverages. This acquisition helped Danone realize its commitment to uphold consumer expectations of healthy and sustainable food choices.
In 2008, General Mills Inc. introduced a wide spectrum of gluten-free cereals within its portfolio. These cereals are primarily made from non-gluten containing sources such as pumpkin seeds, peanuts, corn, pulses, berries and other fruits & vegetables.
In November 2016, Monde Nissin entered into a joint venture with Nippon Indosari to launch Sarimonde Foods, with the objective of broadening its food and beverage portfolio outreach within the Philippines.

A unified Market Research Subscription Platform, built for today's disparate research needs.
Global Pulses Market- Report Scope
Attribute |
Details |
Forecast Period |
2020-2030 |
Historical Data Available for |
2015-2019 |
Market Analysis |
US$ Mn for Value & Tons for Volume |
Key Regions Covered |
North America, Latin America, Europe, APEJ, Japan, Oceania and Middle East & Africa |
Key Countries Covered |
U.S., Canada, Brazil, Mexico, Germany, Italy, France, U.K., Spain, BENELUX, Russia, Poland, China, India, South Korea, ASEAN, Japan, Australia, New Zealand, GCC, Northern Africa & South Africa. |
Key Segments Covered |
Product Type, Nature, Form & End Use Application |
Key Companies Profiled |
Nestle SA, Groupe Danone, Reckitt Benckiser Group Plc (RB), Abbott Laboratories Inc., Vitasoy International Holdings Ltd, Inner Mongolia Yili Industrial Group Co Ltd., Coca-Cola Co, General Mills Inc., Blue Diamond Growers, Kikkoman Corporation, Dr. Schär AG/SpA, Lactalis Groupe, Valio Oy, Post Holdings Inc., and Monde Nissin Corp. |
Report Coverage |
Market Overview, Market Background, Value Chain Analysis, Market Dynamics, Demand Analysis, Segmental Overview, Regional Profiling, Market Structure Analysis & Competition Analysis |
Customization & Pricing |
Key Segments
Product Type
- Dry Beans
- Lentils
- Faba Beans
- Dry Peas
- Chickpeas
- Cowpeas
- Bambara Beans
- Pigeon Peas
- Vetches
Nature
- Organic
- Conventional
Form
- Whole
- Flour
- Split
End Use Application
- B2B
- Food & Beverage Industry
- Pharmaceutical Industry
- Cosmetic Industry
- Nutraceutical Industry
- Animal Feed Industry
- Household/Retail
- Store-based Retail
- Hypermarkets/Supermarkets
- Convenience Stores
- Mass Grocery Retailers
- Wholesale Stores
- Departmental Stores
- Food & Drink Specialty Stores
- Other Retail Forums
- Online (E-commerce)
- Food Service (HoReCa)
- Institutional (Schools, Universities, etc.)
Region
- North America (U.S & Canada)
- Latin America (Brazil, Mexico & Rest of Latin America)
- Europe (Germany, Italy, France, U.K., Spain, BENELUX, Russia, Poland & Rest of Europe)
- APEJ (China, India, South Korea, ASEAN Countries & Rest of APEJ)
- Japan
- Oceania (Australia & New Zealand)
- Middle East & Africa (GCC, South Africa, Northern Africa & Rest of MEA)
Frequently Asked Questions
The global pulses market is expected to embark on an impressive trajectory, exceeding US$ 100 Bn by 2030. Even after considering the impact of COVID-19, growth prospects remain highly positive for the forecast period.
According to FMI, dry beans are likely to be the most widely consumed pulse type in the forthcoming decade, attributed to their high nutritional value and presence of vital nutrients.
Augmenting demand for healthy ready-to-eat foodstuffs is impelling the global pulses market. Various food companies are introducing pulse based snacks to cater to this soaring demand. Moreover, heightened government support to accelerate pulse production is also driving growth.
A major impediment to the pulses market is availability of alternative substitutes which are equally rich in essential nutrients. Crops such as peanut, hemp, flex and soybean are becoming highly popular amongst the current generation, thus tilting demand.
APEJ is expected to generate lucrative growth prospects, capturing nearly 60% of the global revenue share by 2030. Growth is majorly underpinned by high demand for healthy and nutritious foods. Also, unconventional markets such as the Middle East & Africa are also slated to yield green spaces.
The COVID-19 pandemic has moderately impacted the global pulses market, with logistical constraints disrupting the demand-supply equation in the initial months. However, presently, growth is being sustained by increased e-commerce transactions by residential as well as commercial establishments. The trend of healthy eating by consumers to consolidate their immune systems is majorly driving demand for pulses and associated foodstuffs across all prominent markets. Thus, expansion prospects app
Prominent players profiled in the global pulses market report include, but are not restricted to, Nestle SA, Groupe Danone, Reckitt Benckiser Group Plc (RB), Abbott Laboratories Inc., Vitasoy International Holdings Ltd, Inner Mongolia Yili Industrial Group Co Ltd., Coca-Cola Co, General Mills Inc., Blue Diamond Growers, Kikkoman Corporation, Dr. Schär AG/SpA, Lactalis Groupe, Valio Oy, Post Holdings Inc., and Monde Nissin Corp.
Table of Content
1. Market Overview
1.1. Market Coverage / Taxonomy
1.2. Market Definition / Scope / Limitations
2. Market Background
2.1. Macro-Economic Factors
2.1.1. Global GDP Growth Outlook
2.1.2. Global Food Retail Outlook
2.1.3. Global Industry Value Added
2.2. Forecast Factors - Relevance & Impact
2.2.1. Global Food & Beverage Industry Outlook
2.2.2. Global Urbanization Growth Outlook
2.2.3. Food Retail Statistics
2.3. Global Flour Production Outlook
2.3.1. Area Under Cultivation
2.3.1.1. Beans
2.3.1.2. Lentils
2.3.1.3. Chickpeas
2.3.2. Per Hectare Yield
2.3.3. Production of Crops
2.3.4. Percentage use of Crops for various application
2.4. Flour Processing Industry Outlook
2.5. Trade Analysis for Product Types
2.6. Key Market Trends
2.6.1. Key Trends Impacting the Market
2.6.2. Product Innovation / Development Trends
2.7. Key Success Factors
2.7.1. Product Adoption / Usage Analysis
2.7.2. Product USPs / Features
2.7.3. Strategic Promotional Strategies
3. Value Chain Analysis
3.1. Key Raw Material Suppliers
3.2. Key Distributors
3.3. Profit Margin
4. Market Dynamics
4.1. Drivers
4.2. Restraints
4.3. Opportunity Analysis
5. Global Pulses Market Demand Analysis 2015-2019 and Forecast, 2020-2030
5.1. Historical Market Volume (Tons) Analysis, 2015-2019
5.2. Current and Future Market Volume (Tons) Projections, 2020-2030
5.3. Y-o-Y Growth Trend Analysis
6. Global Pulses Market - Pricing Analysis
6.1. Regional Pricing Analysis By Product Type
6.2. Pricing Break-up
6.2.1. Manufacturer Level Pricing
6.2.2. Distributor Level Pricing
6.3. Global Average Pricing Analysis Benchmark
7. Global Pulses Market Demand (in Value or Size in US$ Mn) Analysis 2015-2019 and Forecast, 2020-2030
7.1. Historical Market Value (US$ Mn) Analysis, 2015-2019
7.2. Current and Future Market Value (US$ Mn) Projections, 2020-2030
7.2.1. Y-o-Y Growth Trend Analysis
7.2.2. Absolute $ Opportunity Analysis
8. Global Pulses Market Analysis 2015-2019 and Forecast 2020-2030, by Product Type
8.1. Introduction / Key Findings
8.2. Historical Market Size (US$ Mn) and Volume Analysis By Product Type, 2015-2019
8.3. Current and Future Market Size (US$ Mn) and Volume Analysis and Forecast By Product Type, 2020-2030
8.3.1. Dry Beans
8.3.2. Lentils
8.3.3. Faba Beans
8.3.4. Dry Peas
8.3.5. Chickpeas
8.3.6. Cowpeas
8.3.7. Bambara Beans
8.3.8. Pigeon Peas
8.3.9. Vetches
8.4. Market Attractiveness Analysis By Product Type
9. Global Pulses Market Analysis 2015-2019 and Forecast 2020-2030, by Nature
9.1. Introduction / Key Findings
9.2. Historical Market Size (US$ Mn) and Volume Analysis By Nature, 2015-2019
9.3. Current and Future Market Size (US$ Mn) and Volume Analysis and Forecast By Nature, 2020-2030
9.3.1. Organic
9.3.2. Conventional
9.4. Market Attractiveness Analysis By Nature
10. Market Attractiveness Analysis By Nature Global Pulses Market Analysis 2015-2019 and Forecast 2020-2030, By Form
10.1. Introduction / Key Findings
10.2. Historical Market Size (US$ Mn) and Volume Analysis By Form, 2015-2019
10.3. Current and Future Market Size (US$ Mn) and Volume Analysis and Forecast By Form, 2020-2030
10.3.1. Whole
10.3.2. Flour
10.3.3. Split
10.4. Market Attractiveness Analysis By Form
11. Global Pulses Market Analysis 2015-2019 and Forecast 2020-2030, By End Use Application
11.1. Introduction / Key Findings
11.2. Historical Market Size (US$ Mn) and Volume Analysis By End Use Application, 2015-2019
11.3. Current and Future Market Size (US$ Mn) and Volume Analysis and Forecast By End Use Application, 2020-2030
11.3.1. B2B
11.3.1.1. Food & Beverage Industry
11.3.1.2. Pharmaceutical Industry
11.3.1.3. Cosmetic Industry
11.3.1.4. Nutraceutical Industry
11.3.1.5. Animal Feed Industry
11.3.2. Household/Retail
11.3.2.1. Store-based Retail
11.3.2.1.1. Hypermarkets/Supermarkets
11.3.2.1.2. Convenience Stores
11.3.2.1.3. Mass Grocery Retailers
11.3.2.1.4. Wholesale Stores
11.3.2.1.5. Departmental Stores
11.3.2.1.6. Food & Drink Specialty Stores
11.3.2.1.7. Other Retail Formats
11.3.2.2. Online (E-commerce)
11.3.3. Food Service (HoReCa)
11.3.4. Institutional (Schools, Universities, etc.)
11.4. Market Attractiveness Analysis By End Use Application
12. Global Pulses Market Analysis 2015-2019 and Forecast 2020-2030, by Region
12.1. Introduction
12.2. Historical Market Size (US$ Mn) and Volume Analysis By Region, 2015-2019
12.3. Current Market Size (US$ Mn) and Volume Analysis and Forecast By Region, 2020-2030
12.3.1. North America
12.3.2. Latin America
12.3.3. Europe
12.3.4. APEJ
12.3.5. Japan
12.3.6. Oceania
12.3.7. Middle East & Africa
12.4. Market Attractiveness Analysis By Region
13. North America Pulses Market Analysis 2015-2019 and Forecast 2020-2030
13.1. Introduction
13.2. Pricing Analysis
13.3. Historical Market Size (US$ Mn) and Volume Trend Analysis By Market Taxonomy, 2015-2019
13.4. Market Size (US$ Mn) and Volume Forecast By Market Taxonomy, 2019 - 2029
13.4.1. By Country
13.4.1.1. U.S.
13.4.1.2. Canada
13.4.2. By Product Type
13.4.3. By Nature
13.4.4. By Form
13.4.5. By End Use Application
13.5. Market Attractiveness Analysis
13.5.1. By Country
13.5.2. By Product Type
13.5.3. By Nature
13.5.4. By Form
13.5.5. By End-Use Application
13.6. Key Market Participants - Intensity Mapping
13.7. Drivers and Restraints - Impact Analysis
14. Latin America Pulses Market Analysis 2015-2019 and Forecast 2020-2030
14.1. Introduction
14.2. Pricing Analysis
14.3. Historical Market Size (US$ Mn) and Volume Trend Analysis By Market Taxonomy, 2015-2019
14.4. Market Size (US$ Mn) and Volume Forecast By Market Taxonomy, 2019 - 2029
14.4.1. By Country
14.4.1.1. Brazil
14.4.1.2. Mexico
14.4.1.3. Rest of Latin America
14.4.2. By Product Type
14.4.3. By Nature
14.4.4. By Form
14.4.5. By End-Use Application
14.5. Market Attractiveness Analysis
14.5.1. By Country
14.5.2. By Product Type
14.5.3. By Nature
14.5.4. By Form
14.5.5. By End-Use Application
14.6. Key Market Participants - Intensity Mapping
14.7. Drivers and Restraints - Impact Analysis
15. Europe Pulses Market Analysis 2015-2019 and Forecast 2020-2030
15.1. Introduction
15.2. Pricing Analysis
15.3. Historical Market Size (US$ Mn) and Volume Trend Analysis By Market Taxonomy, 2015-2019
15.4. Market Size (US$ Mn) and Volume Forecast By Market Taxonomy, 2019 - 2029
15.4.1. By Country
15.4.1.1. Germany
15.4.1.2. Italy
15.4.1.3. France
15.4.1.4. U.K.
15.4.1.5. Spain
15.4.1.6. BENELUX
15.4.1.7. Russia
15.4.1.8. Poland
15.4.1.9. Rest of Europe
15.4.2. By Product Type
15.4.3. By Nature
15.4.4. By Form
15.4.5. By End-Use Application
15.5. Market Attractiveness Analysis
15.5.1. By Country
15.5.2. By Product Type
15.5.3. By Nature
15.5.4. By Form
15.5.5. By End-Use Application
15.6. Drivers and Restraints - Impact Analysis
16. APEJ Pulses Market Analysis 2015-2019 and Forecast 2020-2030
16.1. Introduction
16.2. Pricing Analysis
16.3. Historical Market Size (US$ Mn) and Volume Trend Analysis By Market Taxonomy, 2015-2019
16.4. Market Size (US$ Mn) and Volume Forecast By Market Taxonomy, 2019 - 2029
16.4.1. By Country
16.4.1.1. China
16.4.1.2. India
16.4.1.3. South Korea
16.4.1.4. ASEAN Countries
16.4.1.5. Rest of APEJ
16.4.2. By Product Type
16.4.3. By Nature
16.4.4. By Form
16.4.5. By End-Use Application
16.5. Market Attractiveness Analysis
16.5.1. By Country
16.5.2. By Product Type
16.5.3. By Nature
16.5.4. By Form
16.5.5. By End-Use Application
16.6. Key Market Participants - Intensity Mapping
16.7. Drivers and Restraints - Impact Analysis
17. Japan Pulses Market Analysis 2015-2019 and Forecast 2020-2030
17.1. Introduction
17.2. Pricing Analysis
17.3. Historical Market Size (US$ Mn) and Volume Trend Analysis By Market Taxonomy, 2015-2019
17.4. Market Size (US$ Mn) and Volume Forecast By Market Taxonomy, 2019 - 2029
17.4.1. By Product Type
17.4.2. By Nature
17.4.3. By Form
17.4.4. By End-Use Application
17.5. Market Attractiveness Analysis
17.5.1. By Product Type
17.5.2. By Nature
17.5.3. By Form
17.5.4. By End-Use Application
17.6. Key Market Participants - Intensity Mapping
17.7. Drivers and Restraints - Impact Analysis
18. Oceania Pulses Market Analysis 2015-2019 and Forecast 2020-2030
18.1. Introduction
18.2. Pricing Analysis
18.3. Historical Market Size (US$ Mn) and Volume Trend Analysis By Market Taxonomy, 2015-2019
18.4. Market Size (US$ Mn) and Volume Forecast By Market Taxonomy, 2019 - 2029
18.4.1. By Country
18.4.1.1. Australia
18.4.1.2. New Zealand
18.4.2. By Product Type
18.4.3. By Nature
18.4.4. By Form
18.4.5. By End-Use Application
18.5. Market Attractiveness Analysis
18.5.1. By Country
18.5.2. By Product Type
18.5.3. By Nature
18.5.4. By Form
18.5.5. By End-Use Application
18.5.6. By Product Type
18.6. Key Market Participants - Intensity Mapping
18.7. Drivers and Restraints - Impact Analysis
19. Middle East and Africa Pulses Market Analysis 2015-2019 and Forecast 2020-2030
19.1. Introduction
19.2. Pricing Analysis
19.3. Historical Market Size (US$ Mn) and Volume Trend Analysis By Market Taxonomy, 2015-2019
19.4. Market Size (US$ Mn) and Volume Forecast By Market Taxonomy, 2019 - 2029
19.4.1. By Country
19.4.1.1. GCC Countries
19.4.1.2. South Africa
19.4.1.3. Northern Africa
19.4.1.4. Rest of Middle East and Africa
19.4.2. By Product Type
19.4.3. By Nature
19.4.4. By Form
19.4.5. By End-Use Application
19.5. Market Attractiveness Analysis
19.5.1. By Country
19.5.2. By Product Type
19.5.3. By Nature
19.5.4. By Form
19.5.5. By End-Use Application
19.6. Key Market Participants - Intensity Mapping
19.7. Drivers and Restraints - Impact Analysis
20. Market Structure Analysis
20.1. Market Analysis by Tier of Companies
20.2. Market Concentration
20.3. Market Presence Analysis
20.3.1. By Regional footprint of Players
20.3.2. Product foot print by Players
20.3.3. Channel Foot Print by Players
21. Competition Analysis
21.1. Competition Dashboard
21.2. Competition Benchmarking
21.3. Competition Deep Dive
21.3.1. AGT Foods
21.3.1.1. Overview
21.3.1.2. Product Portfolio
21.3.1.3. Production Footprint
21.3.1.4. Sales Footprint
21.3.1.5. Strategy Overview
21.3.1.5.1. Marketing Strategy
21.3.1.5.2. Product Strategy
21.3.1.5.3. Channel Strategy
21.3.2. Verdient Foods
21.3.2.1. Overview
21.3.2.2. Product Portfolio
21.3.2.3. Production Footprint
21.3.2.4. Sales Footprint
21.3.2.5. Strategy Overview
21.3.2.5.1. Marketing Strategy
21.3.2.5.2. Product Strategy
21.3.2.5.3. Channel Strategy
21.3.3. Ingredion Incorporated
21.3.3.1. Overview
21.3.3.2. Product Portfolio
21.3.3.3. Production Footprint
21.3.3.4. Sales Footprint
21.3.3.5. Strategy Overview
21.3.3.5.1. Marketing Strategy
21.3.3.5.2. Product Strategy
21.3.3.5.3. Channel Strategy
21.3.4. Cargill Inc.
21.3.4.1. Overview
21.3.4.2. Product Portfolio
21.3.4.3. Production Footprint
21.3.4.4. Sales Footprint
21.3.4.5. Strategy Overview
21.3.4.5.1. Marketing Strategy
21.3.4.5.2. Product Strategy
21.3.4.5.3. Channel Strategy
21.3.5. The Kraft Heinz Company
21.3.5.1. Overview
21.3.5.2. Product Portfolio
21.3.5.3. Production Footprint
21.3.5.4. Sales Footprint
21.3.5.5. Strategy Overview
21.3.5.5.1. Marketing Strategy
21.3.5.5.2. Product Strategy
21.3.5.5.3. Channel Strategy
21.3.6. Archer Daniels Midland Company
21.3.6.1. Overview
21.3.6.2. Product Portfolio
21.3.6.3. Production Footprint
21.3.6.4. Sales Footprint
21.3.6.5. Strategy Overview
21.3.6.5.1. Marketing Strategy
21.3.6.5.2. Product Strategy
21.3.6.5.3. Channel Strategy
21.3.7. AGT Food and Ingredients
21.3.7.1. Overview
21.3.7.2. Product Portfolio
21.3.7.3. Production Footprint
21.3.7.4. Sales Footprint
21.3.7.5. Strategy Overview
21.3.7.5.1. Marketing Strategy
21.3.7.5.2. Product Strategy
21.3.7.5.3. Channel Strategy
21.3.8. Globeways Canada, Inc.
21.3.8.1. Overview
21.3.8.2. Product Portfolio
21.3.8.3. Production Footprint
21.3.8.4. Sales Footprint
21.3.8.5. Strategy Overview
21.3.8.5.1. Marketing Strategy
21.3.8.5.2. Product Strategy
21.3.8.5.3. Channel Strategy
21.3.9. BroadGrain Commodities Inc.
21.3.9.1. Overview
21.3.9.2. Product Portfolio
21.3.9.3. Production Footprint
21.3.9.4. Sales Footprint
21.3.9.5. Strategy Overview
21.3.9.5.1. Marketing Strategy
21.3.9.5.2. Product Strategy
21.3.9.5.3. Channel Strategy
21.3.10. ILTA Grain Inc.
21.3.10.1. Overview
21.3.10.2. Product Portfolio
21.3.10.3. Production Footprint
21.3.10.4. Sales Footprint
21.3.10.5. Strategy Overview
21.3.10.5.1. Marketing Strategy
21.3.10.5.2. Product Strategy
21.3.10.5.3. Channel Strategy
21.3.11. Prime Seeds International Inc
21.3.11.1. Overview
21.3.11.2. Product Portfolio
21.3.11.3. Production Footprint
21.3.11.4. Sales Footprint
21.3.11.5. Strategy Overview
21.3.11.5.1. Marketing Strategy
21.3.11.5.2. Product Strategy
21.3.11.5.3. Channel Strategy
21.3.12. The Scoular Company
21.3.12.1. Overview
21.3.12.2. Product Portfolio
21.3.12.3. Production Footprint
21.3.12.4. Sales Footprint
21.3.12.5. Strategy Overview
21.3.12.5.1. Marketing Strategy
21.3.12.5.2. Product Strategy
21.3.12.5.3. Channel Strategy
21.3.13. Barilla G. e R. F.lli S.p.A.
21.3.13.1. Overview
21.3.13.2. Product Portfolio
21.3.13.3. Production Footprint
21.3.13.4. Sales Footprint
21.3.13.5. Strategy Overview
21.3.13.5.1. Marketing Strategy
21.3.13.5.2. Product Strategy
21.3.13.5.3. Channel Strategy
21.3.14. Roquette Frères
21.3.14.1. Overview
21.3.14.2. Product Portfolio
21.3.14.3. Production Footprint
21.3.14.4. Sales Footprint
21.3.14.5. Strategy Overview
21.3.14.5.1. Marketing Strategy
21.3.14.5.2. Product Strategy
21.3.14.5.3. Channel Strategy
21.3.15. NHC Foods Limited
21.3.15.1. Overview
21.3.15.2. Product Portfolio
21.3.15.3. Production Footprint
21.3.15.4. Sales Footprint
21.3.15.5. Strategy Overview
21.3.15.5.1. Marketing Strategy
21.3.15.5.2. Product Strategy
21.3.15.5.3. Channel Strategy
21.3.16. Parle Products Private Limited
21.3.16.1. Overview
21.3.16.2. Product Portfolio
21.3.16.3. Production Footprint
21.3.16.4. Sales Footprint
21.3.16.5. Strategy Overview
21.3.16.5.1. Marketing Strategy
21.3.16.5.2. Product Strategy
21.3.16.5.3. Channel Strategy
22. Assumptions and Acronyms Used
23. Research Methodology
Let us know your requirement to get
100% FREE customization
List of Tables
Table 1: Global Pulses Market Historical Value (US$ Mn) Analysis by Product Type , 2015-2019
Table 2: Global Pulses Market Historical Volume (Tons) Analysis by Product Type , 2015-2019
Table 3: Global Pulses Market Forecast Value (US$ Mn) Analysis by Product Type , 2020-2030
Table 4: Global Pulses Market Forecast Volume (Tons) Analysis by Product Type , 2020-2030
Table 5: Global Pulses Market Historical Value (US$ Mn) Analysis by Nature , 2015-2019
Table 6: Global Pulses Market Historical Volume (Tons) Analysis by Nature , 2015-2019
Table 7: Global Pulses Market Forecast Value (US$ Mn) Analysis by Nature , 2020-2030
Table 8: Global Pulses Market Forecast Volume (Tons) Analysis by Nature , 2020-2030
Table 9: Global Pulses Market Historical Value (US$ Mn) Analysis by Form , 2015-2019
Table 10: Global Pulses Market Historical Volume (Tons) Analysis by Form , 2015-2019
Table 11: Global Pulses Market Forecast Value (US$ Mn) Analysis by Form , 2020-2030
Table 12: Global Pulses Market Forecast Volume (Tons) Analysis by Form , 2020-2030
Table 13: Global Pulses Market Historical Value (US$ Mn) Analysis by End-Use Applications , 2015-2019
Table 14: Global Pulses Market Historical Volume (Tons) Analysis by End-Use Applications , 2015-2019
Table 15: Global Pulses Market Forecast Value (US$ Mn) Analysis by End-Use Applications , 2020-2030
Table 16: Global Pulses Market Forecast Volume (Tons) Analysis by End-Use Applications , 2020-2030
Table 17: Global Pulses Market Historical Value (US$ Mn) Analysis by Region , 2015-2019
Table 18: Global Pulses Market Historical Volume (Tons) Analysis by Region , 2015-2019
Table 19: Global Pulses Market Forecast Value (US$ Mn) Analysis by Region , 2020-2030
Table 20: Global Pulses Market Forecast Volume (Tons) Analysis by Region , 2020-2030
Table 21: North America Pulses Market Historical Value (US$ Mn) Analysis by Product Type , 2015-2019
Table 22: North America Pulses Market Historical Volume (Tons) Analysis by Product Type , 2015-2019
Table 23: North America Pulses Market Forecast Value (US$ Mn) Analysis by Product Type , 2020-2030
Table 24: North America Pulses Market Forecast Volume (Tons) Analysis by Product Type , 2020-2030
Table 25: North America Pulses Market Historical Value (US$ Mn) Analysis by Nature , 2015-2019
Table 26: North America Pulses Market Historical Volume (Tons) Analysis by Nature , 2015-2019
Table 27: North America Pulses Market Forecast Value (US$ Mn) Analysis by Nature , 2020-2030
Table 28: North America Pulses Market Forecast Volume (Tons) Analysis by Nature , 2020-2030
Table 29: North America Pulses Market Historical Value (US$ Mn) Analysis by Form , 2015-2019
Table 30: North America Pulses Market Historical Volume (Tons) Analysis by Form , 2015-2019
Table 31: North America Pulses Market Forecast Value (US$ Mn) Analysis by Form , 2020-2030
Table 32: North America Pulses Market Forecast Volume (Tons) Analysis by Form , 2020-2030
Table 33: North America Pulses Market Historical Value (US$ Mn) Analysis by End-Use Applications , 2015-2019
Table 34: North America Pulses Market Historical Volume (Tons) Analysis by End-Use Applications , 2015-2019
Table 35: North America Pulses Market Forecast Value (US$ Mn) Analysis by End-Use Applications , 2020-2030
Table 36: North America Pulses Market Forecast Volume (Tons) Analysis by End-Use Applications , 2020-2030
Table 37: North America Pulses Market Historical Value (US$ Mn) Analysis by Country , 2015-2019
Table 38: North America Pulses Market Historical Volume (Tons) Analysis by Country , 2015-2019
Table 39: North America Pulses Market Forecast Value (US$ Mn) Analysis by Country , 2020-2030
Table 40: North America Pulses Market Forecast Volume (Tons) Analysis by Country , 2020-2030
Table 41: Latin America Pulses Market Historical Value (US$ Mn) Analysis by Product Type , 2015-2019
Table 42: Latin America Pulses Market Historical Volume (Tons) Analysis by Product Type , 2015-2019
Table 43: Latin America Pulses Market Forecast Value (US$ Mn) Analysis by Product Type , 2020-2030
Table 44: Latin America Pulses Market Forecast Volume (Tons) Analysis by Product Type , 2020-2030
Table 45: Latin America Pulses Market Historical Value (US$ Mn) Analysis by Nature , 2015-2019
Table 46: Latin America Pulses Market Historical Volume (Tons) Analysis by Nature , 2015-2019
Table 47: Latin America Pulses Market Forecast Value (US$ Mn) Analysis by Nature , 2020-2030
Table 48: Latin America Pulses Market Forecast Volume (Tons) Analysis by Nature , 2020-2030
Table 49: Latin America Pulses Market Historical Value (US$ Mn) Analysis by Form , 2015-2019
Table 50: Latin America Pulses Market Historical Volume (Tons) Analysis by Form , 2015-2019
Table 51: Latin America Pulses Market Forecast Value (US$ Mn) Analysis by Form , 2020-2030
Table 52: Latin America Pulses Market Forecast Volume (Tons) Analysis by Form , 2020-2030
Table 53: Latin America Pulses Market Historical Value (US$ Mn) Analysis by End-Use Applications , 2015-2019
Table 54: Latin America Pulses Market Historical Volume (Tons) Analysis by End-Use Applications , 2015-2019
Table 55: Latin America Pulses Market Forecast Value (US$ Mn) Analysis by End-Use Applications , 2020-2030
Table 56: Latin America Pulses Market Forecast Volume (Tons) Analysis by End-Use Applications , 2020-2030
Table 57: Latin America Pulses Market Historical Value (US$ Mn) Analysis by Country , 2015-2019
Table 58: Latin America Pulses Market Historical Volume (Tons) Analysis by Country , 2015-2019
Table 59: Latin America Pulses Market Forecast Value (US$ Mn) Analysis by Country , 2020-2030
Table 60: Latin America Pulses Market Forecast Volume (Tons) Analysis by Country , 2020-2030
Table 61: Europe Pulses Market Historical Value (US$ Mn) Analysis by Product Type , 2015-2019
Table 62: Europe Pulses Market Historical Volume (Tons) Analysis by Product Type , 2015-2019
Table 63: Europe Pulses Market Forecast Value (US$ Mn) Analysis by Product Type , 2020-2030
Table 64: Europe Pulses Market Forecast Volume (Tons) Analysis by Product Type , 2020-2030
Table 65: Europe Pulses Market Historical Value (US$ Mn) Analysis by Nature , 2015-2019
Table 66: Europe Pulses Market Historical Volume (Tons) Analysis by Nature , 2015-2019
Table 67: Europe Pulses Market Forecast Value (US$ Mn) Analysis by Nature , 2020-2030
Table 68: Europe Pulses Market Forecast Volume (Tons) Analysis by Nature , 2020-2030
Table 69: Europe Pulses Market Historical Value (US$ Mn) Analysis by Form , 2015-2019
Table 70: Europe Pulses Market Historical Volume (Tons) Analysis by Form , 2015-2019
Table 71: Europe Pulses Market Forecast Value (US$ Mn) Analysis by Form , 2020-2030
Table 72: Europe Pulses Market Forecast Volume (Tons) Analysis by Form , 2020-2030
Table 73: Europe Pulses Market Historical Value (US$ Mn) Analysis by End-Use Applications , 2015-2019
Table 74: Europe Pulses Market Historical Volume (Tons) Analysis by End-Use Applications , 2015-2019
Table 75: Europe Pulses Market Forecast Value (US$ Mn) Analysis by End-Use Applications , 2020-2030
Table 76: Europe Pulses Market Forecast Volume (Tons) Analysis by End-Use Applications , 2020-2030
Table 77: Europe Pulses Market Historical Value (US$ Mn) Analysis by Country , 2015-2019
Table 78: Europe Pulses Market Historical Volume (Tons) Analysis by Country , 2015-2019
Table 79: Europe Pulses Market Forecast Value (US$ Mn) Analysis by Country , 2020-2030
Table 80: Europe Pulses Market Forecast Volume (Tons) Analysis by Country , 2020-2030
Table 81: APEJ Pulses Market Historical Value (US$ Mn) Analysis by Product Type , 2015-2019
Table 82: APEJ Pulses Market Historical Volume (Tons) Analysis by Product Type , 2015-2019
Table 83: APEJ Pulses Market Forecast Value (US$ Mn) Analysis by Product Type , 2020-2030
Table 84: APEJ Pulses Market Forecast Volume (Tons) Analysis by Product Type , 2020-2030
Table 85: APEJ Pulses Market Historical Value (US$ Mn) Analysis by Nature , 2015-2019
Table 86: APEJ Pulses Market Historical Volume (Tons) Analysis by Nature , 2015-2019
Table 87: APEJ Pulses Market Forecast Value (US$ Mn) Analysis by Nature , 2020-2030
Table 88: APEJ Pulses Market Forecast Volume (Tons) Analysis by Nature , 2020-2030
Table 89: APEJ Pulses Market Historical Value (US$ Mn) Analysis by Form , 2015-2019
Table 90: APEJ Pulses Market Historical Volume (Tons) Analysis by Form , 2015-2019
Table 91: APEJ Pulses Market Forecast Value (US$ Mn) Analysis by Form , 2020-2030
Table 92: APEJ Pulses Market Forecast Volume (Tons) Analysis by Form , 2020-2030
Table 93: APEJ Pulses Market Historical Value (US$ Mn) Analysis by End-Use Applications , 2015-2019
Table 94: APEJ Pulses Market Historical Volume (Tons) Analysis by End-Use Applications , 2015-2019
Table 95: APEJ Pulses Market Forecast Value (US$ Mn) Analysis by End-Use Applications , 2020-2030
Table 96: APEJ Pulses Market Forecast Volume (Tons) Analysis by End-Use Applications , 2020-2030
Table 97: APEJ Pulses Market Historical Value (US$ Mn) Analysis by Country , 2015-2019
Table 98: APEJ Pulses Market Historical Volume (Tons) Analysis by Country , 2015-2019
Table 99: APEJ Pulses Market Forecast Value (US$ Mn) Analysis by Country , 2020-2030
Table 100: APEJ Pulses Market Forecast Volume (Tons) Analysis by Country , 2020-2030
Table 101: Japan Pulses Market Historical Value (US$ Mn) Analysis by Product Type , 2015-2019
Table 102: Japan Pulses Market Historical Volume (Tons) Analysis by Product Type , 2015-2019
Table 103: Japan Pulses Market Forecast Value (US$ Mn) Analysis by Product Type , 2020-2030
Table 104: Japan Pulses Market Forecast Volume (Tons) Analysis by Product Type , 2020-2030
Table 105: Japan Pulses Market Historical Value (US$ Mn) Analysis by Nature , 2015-2019
Table 106: Japan Pulses Market Historical Volume (Tons) Analysis by Nature , 2015-2019
Table 107: Japan Pulses Market Forecast Value (US$ Mn) Analysis by Nature , 2020-2030
Table 108: Japan Pulses Market Forecast Volume (Tons) Analysis by Nature , 2020-2030
Table 109: Japan Pulses Market Historical Value (US$ Mn) Analysis by Form , 2015-2019
Table 110: Japan Pulses Market Historical Volume (Tons) Analysis by Form , 2015-2019
Table 111: Japan Pulses Market Forecast Value (US$ Mn) Analysis by Form , 2020-2030
Table 112: Japan Pulses Market Forecast Volume (Tons) Analysis by Form , 2020-2030
Table 113: Japan Pulses Market Historical Value (US$ Mn) Analysis by End-Use Applications , 2015-2019
Table 114: Japan Pulses Market Historical Volume (Tons) Analysis by End-Use Applications , 2015-2019
Table 115: Japan Pulses Market Forecast Value (US$ Mn) Analysis by End-Use Applications , 2020-2030
Table 116: Japan Pulses Market Forecast Volume (Tons) Analysis by End-Use Applications , 2020-2030
Table 117: Oceania Pulses Market Historical Value (US$ Mn) Analysis by Product Type , 2015-2019
Table 118: Oceania Pulses Market Historical Volume (Tons) Analysis by Product Type , 2015-2019
Table 119: Oceania Pulses Market Forecast Value (US$ Mn) Analysis by Product Type , 2020-2030
Table 120: Oceania Pulses Market Forecast Volume (Tons) Analysis by Product Type , 2020-2030
Table 121: Oceania Pulses Market Historical Value (US$ Mn) Analysis by Nature , 2015-2019
Table 122: Oceania Pulses Market Historical Volume (Tons) Analysis by Nature , 2015-2019
Table 123: Oceania Pulses Market Forecast Value (US$ Mn) Analysis by Nature , 2020-2030
Table 124: Oceania Pulses Market Forecast Volume (Tons) Analysis by Nature , 2020-2030
Table 125: Oceania Pulses Market Historical Value (US$ Mn) Analysis by Form , 2015-2019
Table 126: Oceania Pulses Market Historical Volume (Tons) Analysis by Form , 2015-2019
Table 127: Oceania Pulses Market Forecast Value (US$ Mn) Analysis by Form , 2020-2030
Table 128: Oceania Pulses Market Forecast Volume (Tons) Analysis by Form , 2020-2030
Table 129: Oceania Pulses Market Historical Value (US$ Mn) Analysis by End-Use Applications , 2015-2019
Table 130: Oceania Pulses Market Historical Volume (Tons) Analysis by End-Use Applications , 2015-2019
Table 131: Oceania Pulses Market Forecast Value (US$ Mn) Analysis by End-Use Applications , 2020-2030
Table 132: Oceania Pulses Market Forecast Volume (Tons) Analysis by End-Use Applications , 2020-2030
Table 133: Oceania Pulses Market Historical Value (US$ Mn) Analysis by Country , 2015-2019
Table 134: Oceania Pulses Market Historical Volume (Tons) Analysis by Country , 2015-2019
Table 135: Oceania Pulses Market Forecast Value (US$ Mn) Analysis by Country , 2020-2030
Table 136: Oceania Pulses Market Forecast Volume (Tons) Analysis by Country , 2020-2030
Table 137: MEA Pulses Market Historical Value (US$ Mn) Analysis by Product Type , 2015-2019
Table 138: MEA Pulses Market Historical Volume (Tons) Analysis by Product Type , 2015-2019
Table 139: MEA Pulses Market Forecast Value (US$ Mn) Analysis by Product Type , 2020-2030
Table 140: MEA Pulses Market Forecast Volume (Tons) Analysis by Product Type , 2020-2030
Table 141: MEA Pulses Market Historical Value (US$ Mn) Analysis by Nature , 2015-2019
Table 142: MEA Pulses Market Historical Volume (Tons) Analysis by Nature , 2015-2019
Table 143: MEA Pulses Market Forecast Value (US$ Mn) Analysis by Nature , 2020-2030
Table 144: MEA Pulses Market Forecast Volume (Tons) Analysis by Nature , 2020-2030
Table 145: MEA Pulses Market Historical Value (US$ Mn) Analysis by Form , 2015-2019
Table 146: MEA Pulses Market Historical Volume (Tons) Analysis by Form , 2015-2019
Table 147: MEA Pulses Market Forecast Value (US$ Mn) Analysis by Form , 2020-2030
Table 148: MEA Pulses Market Forecast Volume (Tons) Analysis by Form , 2020-2030
Table 149: MEA Pulses Market Historical Value (US$ Mn) Analysis by End-Use Applications , 2015-2019
Table 150: MEA Pulses Market Historical Volume (Tons) Analysis by End-Use Applications , 2015-2019
Table 151: MEA Pulses Market Forecast Value (US$ Mn) Analysis by End-Use Applications , 2020-2030
Table 152: MEA Pulses Market Forecast Volume (Tons) Analysis by End-Use Applications , 2020-2030
Table 153: MEA Pulses Market Historical Value (US$ Mn) Analysis by Country , 2015-2019
Table 154: MEA Pulses Market Historical Volume (Tons) Analysis by Country , 2015-2019
Table 155: MEA Pulses Market Forecast Value (US$ Mn) Analysis by Country , 2020-2030
Table 156: MEA Pulses Market Forecast Volume (Tons) Analysis by Country , 2020-2030
Find your sweet spots for generating winning opportunities in this market.
Talk to AnalystList of Charts
Figure 1: Global Pulses Market Value Y-o-Y Growth and Forecast, 2015-2030
Figure 2: Global Pulses Market Incremental $ Opportunity, 2020-2030
Figure 3: Global Pulses Market Incremental Volume (MT), 2020-2030
Figure 4: Global Pulses Market Value Y-o-Y Growth and Forecast, by Region, 2015-2030
Figure 5: Global Pulses Market Incremental $ Opportunity, by Region, 2020-2030
Figure 6: Global Pulses Market Attractiveness Index, by Region, 2020-2030
Figure 7: Global Pulses Market Value Y-o-Y Growth and Forecast, by Product Type, 2015-2030
Figure 8: Global Pulses Market Incremental $ Opportunity, by Product Type, 2020-2030
Figure 9: Global Pulses Market Value Y-o-Y Growth and Forecast, by Product Type, 2015-2030
Figure 10: Global Pulses Market Value Y-o-Y Growth and Forecast, by Nature, 2015-2030
Figure 11: Global Pulses Market Incremental $ Opportunity, by Nature, 2020-2030
Figure 12: Global Pulses Market Value Y-o-Y Growth and Forecast, by Nature, 2015-2030
Figure 13: Global Pulses Market Value Y-o-Y Growth and Forecast, by Form, 2015-2030
Figure 14: Global Pulses Market Incremental $ Opportunity, by Form, 2020-2030
Figure 15: Global Pulses Market Value Y-o-Y Growth and Forecast, by Form, 2015-2030
Figure 16: Global Pulses Market Value Y-o-Y Growth and Forecast, by End Use Application , 2015-2030
Figure 17: Global Pulses Market Incremental $ Opportunity, by End Use Application , 2020-2030
Figure 18: Global Pulses Market Value Y-o-Y Growth and Forecast, by End Use Application , 2015-2030
Figure 19: North America Pulses Market Value Y-o-Y Growth and Forecast, by Country, 2015-2030
Figure 20: North America Pulses Market Incremental $ Opportunity, by Country, 2020-2030
Figure 21: North America Pulses Market Attractiveness Index, by Country, 2020-2030
Figure 22: North America Pulses Market Value Y-o-Y Growth and Forecast, by Product Type, 2015-2030
Figure 23: North America Pulses Market Incremental $ Opportunity, by Product Type, 2020-2030
Figure 24: North America Pulses Market Value Y-o-Y Growth and Forecast, by Product Type, 2015-2030
Figure 25: North America Pulses Market Value Y-o-Y Growth and Forecast, by Nature, 2015-2030
Figure 26: North America Pulses Market Incremental $ Opportunity, by Nature, 2020-2030
Figure 27: North America Pulses Market Value Y-o-Y Growth and Forecast, by Nature, 2015-2030
Figure 28: North America Pulses Market Value Y-o-Y Growth and Forecast, by Form, 2015-2030
Figure 29: North America Pulses Market Incremental $ Opportunity, by Form, 2020-2030
Figure 30: North America Pulses Market Value Y-o-Y Growth and Forecast, by Form, 2015-2030
Figure 31: North America Pulses Market Value Y-o-Y Growth and Forecast, by End Use Application , 2015-2030
Figure 32: North America Pulses Market Incremental $ Opportunity, by End Use Application , 2020-2030
Figure 33: North America Pulses Market Value Y-o-Y Growth and Forecast, by End Use Application , 2015-2030
Figure 34: Latin America Pulses Market Value Y-o-Y Growth and Forecast, by Country, 2015-2030
Figure 35: Latin America Pulses Market Incremental $ Opportunity, by Country, 2020-2030
Figure 36: Latin America Pulses Market Attractiveness Index, by Country, 2020-2030
Figure 37: Latin America Pulses Market Value Y-o-Y Growth and Forecast, by Product Type, 2015-2030
Figure 38: Latin America Pulses Market Incremental $ Opportunity, by Product Type, 2020-2030
Figure 39: Latin America Pulses Market Value Y-o-Y Growth and Forecast, by Product Type, 2015-2030
Figure 40: Latin America Pulses Market Value Y-o-Y Growth and Forecast, by Nature, 2015-2030
Figure 41: Latin America Pulses Market Incremental $ Opportunity, by Nature, 2020-2030
Figure 42: Latin America Pulses Market Value Y-o-Y Growth and Forecast, by Nature, 2015-2030
Figure 43: Latin America Pulses Market Value Y-o-Y Growth and Forecast, by Form, 2015-2030
Figure 44: Latin America Pulses Market Incremental $ Opportunity, by Form, 2020-2030
Figure 45: Latin America Pulses Market Value Y-o-Y Growth and Forecast, by Form, 2015-2030
Figure 46: Latin America Pulses Market Value Y-o-Y Growth and Forecast, by End Use Application , 2015-2030
Figure 47: Latin America Pulses Market Incremental $ Opportunity, by End Use Application , 2020-2030
Figure 48: Latin America Pulses Market Value Y-o-Y Growth and Forecast, by End Use Application , 2015-2030
Figure 49: Europe Pulses Market Value Y-o-Y Growth and Forecast, by Country, 2015-2030
Figure 50: Europe Pulses Market Incremental $ Opportunity, by Country, 2020-2030
Figure 51: Europe Pulses Market Attractiveness Index, by Country, 2020-2030
Figure 52: Europe Pulses Market Value Y-o-Y Growth and Forecast, by Product Type, 2015-2030
Figure 53: Europe Pulses Market Incremental $ Opportunity, by Product Type, 2020-2030
Figure 54: Europe Pulses Market Value Y-o-Y Growth and Forecast, by Product Type, 2015-2030
Figure 55: Europe Pulses Market Value Y-o-Y Growth and Forecast, by Nature, 2015-2030
Figure 56: Europe Pulses Market Incremental $ Opportunity, by Nature, 2020-2030
Figure 57: Europe Pulses Market Value Y-o-Y Growth and Forecast, by Nature, 2015-2030
Figure 58: Europe Pulses Market Value Y-o-Y Growth and Forecast, by Form, 2015-2030
Figure 59: Europe Pulses Market Incremental $ Opportunity, by Form, 2020-2030
Figure 60: Europe Pulses Market Value Y-o-Y Growth and Forecast, by Form, 2015-2030
Figure 61: Europe Pulses Market Value Y-o-Y Growth and Forecast, by End Use Application , 2015-2030
Figure 62: Europe Pulses Market Incremental $ Opportunity, by End Use Application , 2020-2030
Figure 63: Europe Pulses Market Value Y-o-Y Growth and Forecast, by End Use Application , 2015-2030
Figure 64: APEJ Pulses Market Value Y-o-Y Growth and Forecast, by Country, 2015-2030
Figure 65: APEJ Pulses Market Incremental $ Opportunity, by Country, 2020-2030
Figure 66: APEJ Pulses Market Attractiveness Index, by Country, 2020-2030
Figure 67: APEJ Pulses Market Value Y-o-Y Growth and Forecast, by Product Type, 2015-2030
Figure 68: APEJ Pulses Market Incremental $ Opportunity, by Product Type, 2020-2030
Figure 69: APEJ Pulses Market Value Y-o-Y Growth and Forecast, by Product Type, 2015-2030
Figure 70: APEJ Pulses Market Value Y-o-Y Growth and Forecast, by Nature, 2015-2030
Figure 71: APEJ Pulses Market Incremental $ Opportunity, by Nature, 2020-2030
Figure 72: APEJ Pulses Market Value Y-o-Y Growth and Forecast, by Nature, 2015-2030
Figure 73: APEJ Pulses Market Value Y-o-Y Growth and Forecast, by Form, 2015-2030
Figure 74: APEJ Pulses Market Incremental $ Opportunity, by Form, 2020-2030
Figure 75: APEJ Pulses Market Value Y-o-Y Growth and Forecast, by Form, 2015-2030
Figure 76: APEJ Pulses Market Value Y-o-Y Growth and Forecast, by End Use Application , 2015-2030
Figure 77: APEJ Pulses Market Incremental $ Opportunity, by End Use Application , 2020-2030
Figure 78: APEJ Pulses Market Value Y-o-Y Growth and Forecast, by End Use Application , 2015-2030
Figure 79: Japan Pulses Market Value Y-o-Y Growth and Forecast, by Country, 2015-2030
Figure 80: Japan Pulses Market Incremental $ Opportunity, by Country, 2020-2030
Figure 81: Japan Pulses Market Attractiveness Index, by Country, 2020-2030
Figure 82: Japan Pulses Market Value Y-o-Y Growth and Forecast, by Product Type, 2015-2030
Figure 83: Japan Pulses Market Incremental $ Opportunity, by Product Type, 2020-2030
Figure 84: Japan Pulses Market Value Y-o-Y Growth and Forecast, by Product Type, 2015-2030
Figure 85: Japan Pulses Market Value Y-o-Y Growth and Forecast, by Nature, 2015-2030
Figure 86: Japan Pulses Market Incremental $ Opportunity, by Nature, 2020-2030
Figure 87: Japan Pulses Market Value Y-o-Y Growth and Forecast, by Nature, 2015-2030
Figure 88: Japan Pulses Market Value Y-o-Y Growth and Forecast, by Form, 2015-2030
Figure 89: Japan Pulses Market Incremental $ Opportunity, by Form, 2020-2030
Figure 90: Japan Pulses Market Value Y-o-Y Growth and Forecast, by Form, 2015-2030
Figure 91: Japan Pulses Market Value Y-o-Y Growth and Forecast, by End Use Application , 2015-2030
Figure 92: Japan Pulses Market Incremental $ Opportunity, by End Use Application , 2020-2030
Figure 93: Japan Pulses Market Value Y-o-Y Growth and Forecast, by End Use Application , 2015-2030
Figure 94: Oceania Pulses Market Value Y-o-Y Growth and Forecast, by Country, 2015-2030
Figure 95: Oceania Pulses Market Incremental $ Opportunity, by Country, 2020-2030
Figure 96: Oceania Pulses Market Attractiveness Index, by Country, 2020-2030
Figure 97: Oceania Pulses Market Value Y-o-Y Growth and Forecast, by Product Type, 2015-2030
Figure 98: Oceania Pulses Market Incremental $ Opportunity, by Product Type, 2020-2030
Figure 99: Oceania Pulses Market Value Y-o-Y Growth and Forecast, by Product Type, 2015-2030
Figure 100: Oceania Pulses Market Value Y-o-Y Growth and Forecast, by Nature, 2015-2030
Figure 101: Oceania Pulses Market Incremental $ Opportunity, by Nature, 2020-2030
Figure 102: Oceania Pulses Market Value Y-o-Y Growth and Forecast, by Nature, 2015-2030
Figure 103: Oceania Pulses Market Value Y-o-Y Growth and Forecast, by Form, 2015-2030
Figure 104: Oceania Pulses Market Incremental $ Opportunity, by Form, 2020-2030
Figure 105: Oceania Pulses Market Value Y-o-Y Growth and Forecast, by Form, 2015-2030
Figure 106: Oceania Pulses Market Value Y-o-Y Growth and Forecast, by End Use Application , 2015-2030
Figure 107: Oceania Pulses Market Incremental $ Opportunity, by End Use Application , 2020-2030
Figure 108: Oceania Pulses Market Value Y-o-Y Growth and Forecast, by End Use Application , 2015-2030
Figure 109: MEA Pulses Market Value Y-o-Y Growth and Forecast, by Country, 2015-2030
Figure 110: MEA Pulses Market Incremental $ Opportunity, by Country, 2020-2030
Figure 111: MEA Pulses Market Attractiveness Index, by Country, 2020-2030
Figure 112: MEA Pulses Market Value Y-o-Y Growth and Forecast, by Product Type, 2015-2030
Figure 113: MEA Pulses Market Incremental $ Opportunity, by Product Type, 2020-2030
Figure 114: MEA Pulses Market Value Y-o-Y Growth and Forecast, by Product Type, 2015-2030
Figure 115: MEA Pulses Market Value Y-o-Y Growth and Forecast, by Nature, 2015-2030
Figure 116: MEA Pulses Market Incremental $ Opportunity, by Nature, 2020-2030
Figure 117: MEA Pulses Market Value Y-o-Y Growth and Forecast, by Nature, 2015-2030
Figure 118: MEA Pulses Market Value Y-o-Y Growth and Forecast, by Form, 2015-2030
Figure 119: MEA Pulses Market Incremental $ Opportunity, by Form, 2020-2030
Figure 120: MEA Pulses Market Value Y-o-Y Growth and Forecast, by Form, 2015-2030
Figure 121: MEA Pulses Market Value Y-o-Y Growth and Forecast, by End Use Application , 2015-2030
Figure 122: MEA Pulses Market Incremental $ Opportunity, by End Use Application , 2020-2030
Figure 123: MEA Pulses Market Value Y-o-Y Growth and Forecast, by End Use Application , 2015-2030
Need specific information?
Request CustomizationExplore Food and Beverage Insights
View Reports