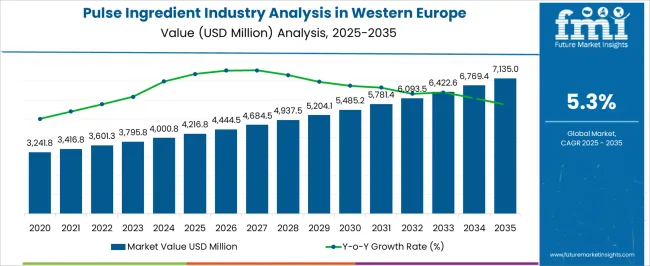
The market value of pulse ingredient in Western Europe is projected to climb from USD 3,795.81 million in 2023 to USD 6,439.45 million by 2033. The sale of pulse ingredient in Western Europe is likely to develop at a CAGR of 5.4% over the projected period.
Demand for pulse ingredients is increasing in Western Europe with the greater adoption of plant-based diets. In the same vein, increasing demand from the food and beverage industry for clean-label and non-GMO ingredients drives the growth of the indsutry in Western Europe.
Attributes | Details |
---|---|
Demand Analysis (2023) | USD 3,795.81 million |
Demand Forecast (2033) | USD 6,439.45 million |
CAGR Estimation (2023 to 2033) | 5.4% |
Due to the growing production of pulses, which are an excellent source of protein, iron, and vitamins and have a high appeal among health-conscious consumers to lead to rising per capita consumption. As a result, the demand for pulse ingredient is poised to be stimulated.
The pulse ingredient industry in Western Europe is evolving with the product being combined with food like energy bars, chips, and biscuits.
Growing demand for clean-label and gluten-free products, urbanization, and shifting lifestyles contribute to the industry expansion for pulse ingredient in Western Europe. Technological advancements in food processing further support the industry growth.
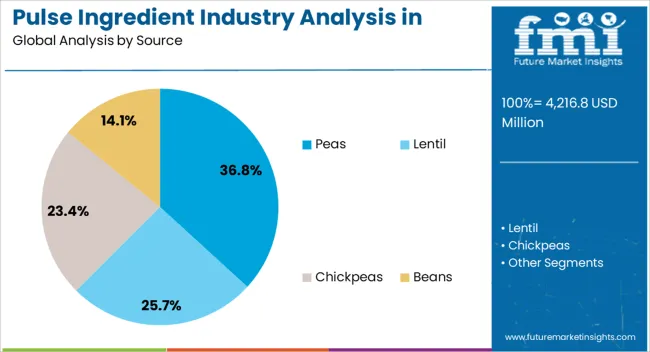
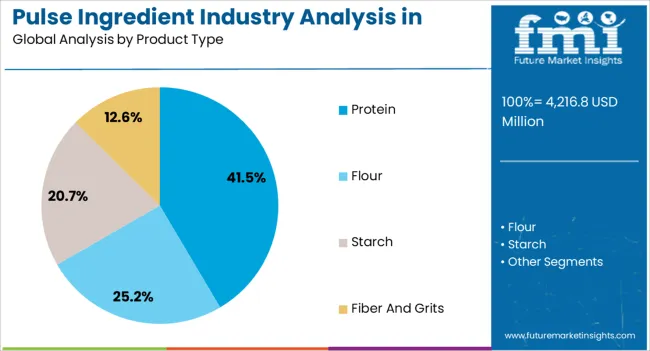
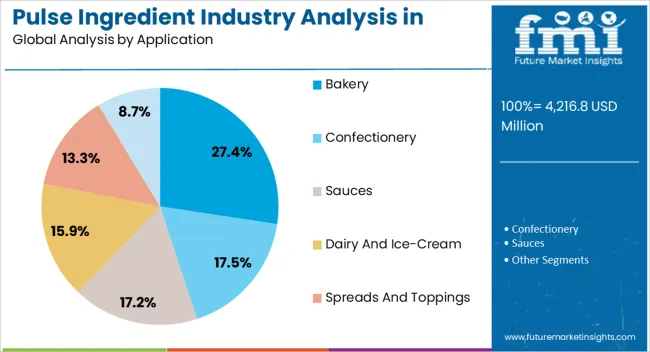
A thorough segmentation analysis pulse ingredient in Western Europe is included in this section. With close monitoring of the trends going on in the industry and growing demand from the flour segment, manufacturers of pulse ingredients are on high alert in Western Europe. Similarly, the performance of the peas segment is outclassing other types of pulses.
Segment | Flour |
---|---|
Industry Share in 2023 | 54.0% |
Segment | Peas |
---|---|
Industry Share in 2023 | 55.5% |
The table below depicts the expected pulse ingredient demand in Western Europe, with an emphasis on the region's key economies, the United Kingdom, France, Italy, Germany, and the Netherlands. According to the qualitative and quantitative investigation, the Netherlands has lucrative potential with influential pulse ingredient manufacturers.
Country | Netherlands |
---|---|
CAGR from 2023 to 2033 | 8.4% |
Food manufacturers are encouraged to investigate pulse-derived ingredient for various product formulations. This encouragement stems from the growing pulse ingredient industry in the Netherlands, where sustainability and nutritional value are becoming more important considerations.
Country | United Kingdom |
---|---|
CAGR from 2023 to 2033 | 5.1% |
The demand for various pulse-derived products in the food industry has driven the United Kingdom's demand for pulse ingredient. The increase in demand is also a consequence of consumers’ preference for plant-based proteins.
Country | France |
---|---|
CAGR from 2023 to 2033 | 4.2% |
Demand for pulse ingredients in France is on the rise due to health-conscious consumers moving towards plant-based alternatives. There is also growing usage of pulse ingredient in in a large number of culinary applications.
Country | Italy |
---|---|
CAGR from 2023 to 2033 | 3.5% |
The Italian pulse ingredient industry is growing at a stable pace. This growth can be attributed to the fact that Italy is one of the major consumers of the Mediterranean diet, and pulses happen to form an integral part of the traditional diet. Thus, the adoption of pulse ingredients is highly encouraged here.
Country | Germany |
---|---|
CAGR from 2023 to 2033 | 2.8% |
With consumer demand for more sustainable and more protein-rich food increasing, the German pulse ingredient industry is shifting accordingly. Pulse ingredient is being used more widely in the food and beverage industry as a result.
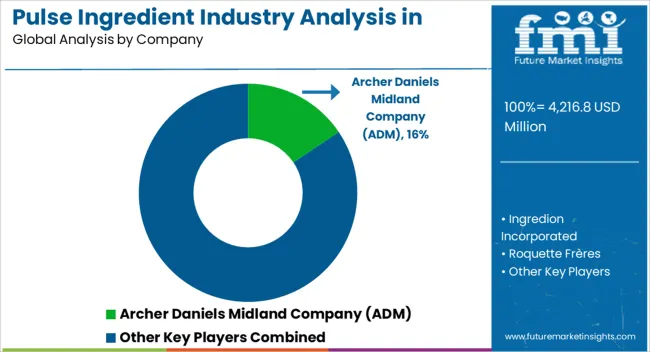
There is a fierce competition among the various Western European pulse ingredient industry players contending for market share. Significant pulse ingredient manufacturers in Western Europe are extending their reach geographically, collaborating strategically, and developing new products.
Industry expansion is driven by rising consumer awareness of the nutritional advantages linked to pulse ingredient. Leading pulse ingredient producers in Western Europe concentrate on environmentally friendly production and sourcing practices to meet changing consumer demands for green products.
Latest Advancements in Pulse Ingredient Industry in Western Europe
Attribute | Details |
---|---|
Estimated Valuation (2023) | USD 3,795.81 million |
Projected Valuation (2033) | USD 6,439.45 million |
Anticipated CAGR (2023 to 2033) | 5.4% |
Historical Analysis of Pulse Ingredient in Western Europe | 2018 to 2022 |
Demand Forecast for Pulse Ingredient in Western Europe | 2023 to 2033 |
Quantitative Units | Revenue in USD million and CAGR from 2023 to 2033 |
Report Coverage | Revenue Forecast, Company Ranking, Competitive Landscape, Growth Factors, Trends and Pricing Analysis |
Key Countries Analyzed while Studying Opportunities in Pulse Ingredient in Western Europe | United Kingdom, Germany, France, Italy, Spain |
Key Companies Profiled | Archer Daniels Midland Company (ADM); Ingredion Incorporated; Roquette Frères; AGT Food and Ingredient Inc.; Emsland Group; Vestkorn Milling AS; Batory Foods; Dakota Ingredient; Axiom Foods; Sotexpro |
Table 1: Industry Analysis and Outlook Value (US$ Million) Forecast by Country, 2018 to 2033
Table 2: Industry Analysis and Outlook Volume (Tons) Forecast by Country, 2018 to 2033
Table 3: Industry Analysis and Outlook Value (US$ Million) Forecast by Form, 2018 to 2033
Table 4: Industry Analysis and Outlook Volume (Tons) Forecast by Form, 2018 to 2033
Table 5: Industry Analysis and Outlook Value (US$ Million) Forecast by Type , 2018 to 2033
Table 6: Industry Analysis and Outlook Volume (Tons) Forecast by Type , 2018 to 2033
Table 7: Industry Analysis and Outlook Value (US$ Million) Forecast by Application, 2018 to 2033
Table 8: Industry Analysis and Outlook Volume (Tons) Forecast by Application, 2018 to 2033
Table 9: UK Industry Analysis and Outlook Value (US$ Million) Forecast By Region, 2018 to 2033
Table 10: UK Industry Analysis and Outlook Volume (Tons) Forecast By Region, 2018 to 2033
Table 11: UK Industry Analysis and Outlook Value (US$ Million) Forecast by Form, 2018 to 2033
Table 12: UK Industry Analysis and Outlook Volume (Tons) Forecast by Form, 2018 to 2033
Table 13: UK Industry Analysis and Outlook Value (US$ Million) Forecast by Type , 2018 to 2033
Table 14: UK Industry Analysis and Outlook Volume (Tons) Forecast by Type , 2018 to 2033
Table 15: UK Industry Analysis and Outlook Value (US$ Million) Forecast by Application, 2018 to 2033
Table 16: UK Industry Analysis and Outlook Volume (Tons) Forecast by Application, 2018 to 2033
Table 17: Germany Industry Analysis and Outlook Value (US$ Million) Forecast By Region, 2018 to 2033
Table 18: Germany Industry Analysis and Outlook Volume (Tons) Forecast By Region, 2018 to 2033
Table 19: Germany Industry Analysis and Outlook Value (US$ Million) Forecast by Form, 2018 to 2033
Table 20: Germany Industry Analysis and Outlook Volume (Tons) Forecast by Form, 2018 to 2033
Table 21: Germany Industry Analysis and Outlook Value (US$ Million) Forecast by Type , 2018 to 2033
Table 22: Germany Industry Analysis and Outlook Volume (Tons) Forecast by Type , 2018 to 2033
Table 23: Germany Industry Analysis and Outlook Value (US$ Million) Forecast by Application, 2018 to 2033
Table 24: Germany Industry Analysis and Outlook Volume (Tons) Forecast by Application, 2018 to 2033
Table 25: Italy Industry Analysis and Outlook Value (US$ Million) Forecast By Region, 2018 to 2033
Table 26: Italy Industry Analysis and Outlook Volume (Tons) Forecast By Region, 2018 to 2033
Table 27: Italy Industry Analysis and Outlook Value (US$ Million) Forecast by Form, 2018 to 2033
Table 28: Italy Industry Analysis and Outlook Volume (Tons) Forecast by Form, 2018 to 2033
Table 29: Italy Industry Analysis and Outlook Value (US$ Million) Forecast by Type , 2018 to 2033
Table 30: Italy Industry Analysis and Outlook Volume (Tons) Forecast by Type , 2018 to 2033
Table 31: Italy Industry Analysis and Outlook Value (US$ Million) Forecast by Application, 2018 to 2033
Table 32: Italy Industry Analysis and Outlook Volume (Tons) Forecast by Application, 2018 to 2033
Table 33: France Industry Analysis and Outlook Value (US$ Million) Forecast By Region, 2018 to 2033
Table 34: France Industry Analysis and Outlook Volume (Tons) Forecast By Region, 2018 to 2033
Table 35: France Industry Analysis and Outlook Value (US$ Million) Forecast by Form, 2018 to 2033
Table 36: France Industry Analysis and Outlook Volume (Tons) Forecast by Form, 2018 to 2033
Table 37: France Industry Analysis and Outlook Value (US$ Million) Forecast by Type , 2018 to 2033
Table 38: France Industry Analysis and Outlook Volume (Tons) Forecast by Type , 2018 to 2033
Table 39: France Industry Analysis and Outlook Value (US$ Million) Forecast by Application, 2018 to 2033
Table 40: France Industry Analysis and Outlook Volume (Tons) Forecast by Application, 2018 to 2033
Table 41: Spain Industry Analysis and Outlook Value (US$ Million) Forecast By Region, 2018 to 2033
Table 42: Spain Industry Analysis and Outlook Volume (Tons) Forecast By Region, 2018 to 2033
Table 43: Spain Industry Analysis and Outlook Value (US$ Million) Forecast by Form, 2018 to 2033
Table 44: Spain Industry Analysis and Outlook Volume (Tons) Forecast by Form, 2018 to 2033
Table 45: Spain Industry Analysis and Outlook Value (US$ Million) Forecast by Type , 2018 to 2033
Table 46: Spain Industry Analysis and Outlook Volume (Tons) Forecast by Type , 2018 to 2033
Table 47: Spain Industry Analysis and Outlook Value (US$ Million) Forecast by Application, 2018 to 2033
Table 48: Spain Industry Analysis and Outlook Volume (Tons) Forecast by Application, 2018 to 2033
Table 49: Rest of Industry Analysis and Outlook Value (US$ Million) Forecast by Form, 2018 to 2033
Table 50: Rest of Industry Analysis and Outlook Volume (Tons) Forecast by Form, 2018 to 2033
Table 51: Rest of Industry Analysis and Outlook Value (US$ Million) Forecast by Type , 2018 to 2033
Table 52: Rest of Industry Analysis and Outlook Volume (Tons) Forecast by Type , 2018 to 2033
Table 53: Rest of Industry Analysis and Outlook Value (US$ Million) Forecast by Application, 2018 to 2033
Table 54: Rest of Industry Analysis and Outlook Volume (Tons) Forecast by Application, 2018 to 2033
Figure 1: Industry Analysis and Outlook Value (US$ Million) by Form, 2023 to 2033
Figure 2: Industry Analysis and Outlook Value (US$ Million) by Type, 2023 to 2033
Figure 3: Industry Analysis and Outlook Value (US$ Million) by Application, 2023 to 2033
Figure 4: Industry Analysis and Outlook Value (US$ Million) by Country, 2023 to 2033
Figure 5: Industry Analysis and Outlook Value (US$ Million) Analysis by Country, 2018 to 2033
Figure 6: Industry Analysis and Outlook Volume (Tons) Analysis by Country, 2018 to 2033
Figure 7: Industry Analysis and Outlook Value Share (%) and BPS Analysis by Country, 2023 to 2033
Figure 8: Industry Analysis and Outlook Y-o-Y Growth (%) Projections by Country, 2023 to 2033
Figure 9: Industry Analysis and Outlook Value (US$ Million) Analysis by Form, 2018 to 2033
Figure 10: Industry Analysis and Outlook Volume (Tons) Analysis by Form, 2018 to 2033
Figure 11: Industry Analysis and Outlook Value Share (%) and BPS Analysis by Form, 2023 to 2033
Figure 12: Industry Analysis and Outlook Y-o-Y Growth (%) Projections by Form, 2023 to 2033
Figure 13: Industry Analysis and Outlook Value (US$ Million) Analysis by Type, 2018 to 2033
Figure 14: Industry Analysis and Outlook Volume (Tons) Analysis by Type, 2018 to 2033
Figure 15: Industry Analysis and Outlook Value Share (%) and BPS Analysis by Type, 2023 to 2033
Figure 16: Industry Analysis and Outlook Y-o-Y Growth (%) Projections by Type, 2023 to 2033
Figure 17: Industry Analysis and Outlook Value (US$ Million) Analysis by Application, 2018 to 2033
Figure 18: Industry Analysis and Outlook Volume (Tons) Analysis by Application, 2018 to 2033
Figure 19: Industry Analysis and Outlook Value Share (%) and BPS Analysis by Application, 2023 to 2033
Figure 20: Industry Analysis and Outlook Y-o-Y Growth (%) Projections by Application, 2023 to 2033
Figure 21: Industry Analysis and Outlook Attractiveness by Form, 2023 to 2033
Figure 22: Industry Analysis and Outlook Attractiveness by Type, 2023 to 2033
Figure 23: Industry Analysis and Outlook Attractiveness by Application, 2023 to 2033
Figure 24: Industry Analysis and Outlook Attractiveness by Region, 2023 to 2033
Figure 25: UK Industry Analysis and Outlook Value (US$ Million) by Form, 2023 to 2033
Figure 26: UK Industry Analysis and Outlook Value (US$ Million) by Type, 2023 to 2033
Figure 27: UK Industry Analysis and Outlook Value (US$ Million) by Application, 2023 to 2033
Figure 28: UK Industry Analysis and Outlook Value (US$ Million) By Region, 2023 to 2033
Figure 29: UK Industry Analysis and Outlook Value (US$ Million) Analysis By Region, 2018 to 2033
Figure 30: UK Industry Analysis and Outlook Volume (Tons) Analysis By Region, 2018 to 2033
Figure 31: UK Industry Analysis and Outlook Value Share (%) and BPS Analysis By Region, 2023 to 2033
Figure 32: UK Industry Analysis and Outlook Y-o-Y Growth (%) Projections By Region, 2023 to 2033
Figure 33: UK Industry Analysis and Outlook Value (US$ Million) Analysis by Form, 2018 to 2033
Figure 34: UK Industry Analysis and Outlook Volume (Tons) Analysis by Form, 2018 to 2033
Figure 35: UK Industry Analysis and Outlook Value Share (%) and BPS Analysis by Form, 2023 to 2033
Figure 36: UK Industry Analysis and Outlook Y-o-Y Growth (%) Projections by Form, 2023 to 2033
Figure 37: UK Industry Analysis and Outlook Value (US$ Million) Analysis by Type, 2018 to 2033
Figure 38: UK Industry Analysis and Outlook Volume (Tons) Analysis by Type, 2018 to 2033
Figure 39: UK Industry Analysis and Outlook Value Share (%) and BPS Analysis by Type, 2023 to 2033
Figure 40: UK Industry Analysis and Outlook Y-o-Y Growth (%) Projections by Type, 2023 to 2033
Figure 41: UK Industry Analysis and Outlook Value (US$ Million) Analysis by Application, 2018 to 2033
Figure 42: UK Industry Analysis and Outlook Volume (Tons) Analysis by Application, 2018 to 2033
Figure 43: UK Industry Analysis and Outlook Value Share (%) and BPS Analysis by Application, 2023 to 2033
Figure 44: UK Industry Analysis and Outlook Y-o-Y Growth (%) Projections by Application, 2023 to 2033
Figure 45: UK Industry Analysis and Outlook Attractiveness by Form, 2023 to 2033
Figure 46: UK Industry Analysis and Outlook Attractiveness by Type, 2023 to 2033
Figure 47: UK Industry Analysis and Outlook Attractiveness by Application, 2023 to 2033
Figure 48: UK Industry Analysis and Outlook Attractiveness By Region, 2023 to 2033
Figure 49: Germany Industry Analysis and Outlook Value (US$ Million) by Form, 2023 to 2033
Figure 50: Germany Industry Analysis and Outlook Value (US$ Million) by Type, 2023 to 2033
Figure 51: Germany Industry Analysis and Outlook Value (US$ Million) by Application, 2023 to 2033
Figure 52: Germany Industry Analysis and Outlook Value (US$ Million) By Region, 2023 to 2033
Figure 53: Germany Industry Analysis and Outlook Value (US$ Million) Analysis By Region, 2018 to 2033
Figure 54: Germany Industry Analysis and Outlook Volume (Tons) Analysis By Region, 2018 to 2033
Figure 55: Germany Industry Analysis and Outlook Value Share (%) and BPS Analysis By Region, 2023 to 2033
Figure 56: Germany Industry Analysis and Outlook Y-o-Y Growth (%) Projections By Region, 2023 to 2033
Figure 57: Germany Industry Analysis and Outlook Value (US$ Million) Analysis by Form, 2018 to 2033
Figure 58: Germany Industry Analysis and Outlook Volume (Tons) Analysis by Form, 2018 to 2033
Figure 59: Germany Industry Analysis and Outlook Value Share (%) and BPS Analysis by Form, 2023 to 2033
Figure 60: Germany Industry Analysis and Outlook Y-o-Y Growth (%) Projections by Form, 2023 to 2033
Figure 61: Germany Industry Analysis and Outlook Value (US$ Million) Analysis by Type, 2018 to 2033
Figure 62: Germany Industry Analysis and Outlook Volume (Tons) Analysis by Type, 2018 to 2033
Figure 63: Germany Industry Analysis and Outlook Value Share (%) and BPS Analysis by Type, 2023 to 2033
Figure 64: Germany Industry Analysis and Outlook Y-o-Y Growth (%) Projections by Type, 2023 to 2033
Figure 65: Germany Industry Analysis and Outlook Value (US$ Million) Analysis by Application, 2018 to 2033
Figure 66: Germany Industry Analysis and Outlook Volume (Tons) Analysis by Application, 2018 to 2033
Figure 67: Germany Industry Analysis and Outlook Value Share (%) and BPS Analysis by Application, 2023 to 2033
Figure 68: Germany Industry Analysis and Outlook Y-o-Y Growth (%) Projections by Application, 2023 to 2033
Figure 69: Germany Industry Analysis and Outlook Attractiveness by Form, 2023 to 2033
Figure 70: Germany Industry Analysis and Outlook Attractiveness by Type, 2023 to 2033
Figure 71: Germany Industry Analysis and Outlook Attractiveness by Application, 2023 to 2033
Figure 72: Germany Industry Analysis and Outlook Attractiveness By Region, 2023 to 2033
Figure 73: Italy Industry Analysis and Outlook Value (US$ Million) by Form, 2023 to 2033
Figure 74: Italy Industry Analysis and Outlook Value (US$ Million) by Type, 2023 to 2033
Figure 75: Italy Industry Analysis and Outlook Value (US$ Million) by Application, 2023 to 2033
Figure 76: Italy Industry Analysis and Outlook Value (US$ Million) By Region, 2023 to 2033
Figure 77: Italy Industry Analysis and Outlook Value (US$ Million) Analysis By Region, 2018 to 2033
Figure 78: Italy Industry Analysis and Outlook Volume (Tons) Analysis By Region, 2018 to 2033
Figure 79: Italy Industry Analysis and Outlook Value Share (%) and BPS Analysis By Region, 2023 to 2033
Figure 80: Italy Industry Analysis and Outlook Y-o-Y Growth (%) Projections By Region, 2023 to 2033
Figure 81: Italy Industry Analysis and Outlook Value (US$ Million) Analysis by Form, 2018 to 2033
Figure 82: Italy Industry Analysis and Outlook Volume (Tons) Analysis by Form, 2018 to 2033
Figure 83: Italy Industry Analysis and Outlook Value Share (%) and BPS Analysis by Form, 2023 to 2033
Figure 84: Italy Industry Analysis and Outlook Y-o-Y Growth (%) Projections by Form, 2023 to 2033
Figure 85: Italy Industry Analysis and Outlook Value (US$ Million) Analysis by Type, 2018 to 2033
Figure 86: Italy Industry Analysis and Outlook Volume (Tons) Analysis by Type, 2018 to 2033
Figure 87: Italy Industry Analysis and Outlook Value Share (%) and BPS Analysis by Type, 2023 to 2033
Figure 88: Italy Industry Analysis and Outlook Y-o-Y Growth (%) Projections by Type, 2023 to 2033
Figure 89: Italy Industry Analysis and Outlook Value (US$ Million) Analysis by Application, 2018 to 2033
Figure 90: Italy Industry Analysis and Outlook Volume (Tons) Analysis by Application, 2018 to 2033
Figure 91: Italy Industry Analysis and Outlook Value Share (%) and BPS Analysis by Application, 2023 to 2033
Figure 92: Italy Industry Analysis and Outlook Y-o-Y Growth (%) Projections by Application, 2023 to 2033
Figure 93: Italy Industry Analysis and Outlook Attractiveness by Form, 2023 to 2033
Figure 94: Italy Industry Analysis and Outlook Attractiveness by Type, 2023 to 2033
Figure 95: Italy Industry Analysis and Outlook Attractiveness by Application, 2023 to 2033
Figure 96: Italy Industry Analysis and Outlook Attractiveness By Region, 2023 to 2033
Figure 97: France Industry Analysis and Outlook Value (US$ Million) by Form, 2023 to 2033
Figure 98: France Industry Analysis and Outlook Value (US$ Million) by Type, 2023 to 2033
Figure 99: France Industry Analysis and Outlook Value (US$ Million) by Application, 2023 to 2033
Figure 100: France Industry Analysis and Outlook Value (US$ Million) By Region, 2023 to 2033
Figure 101: France Industry Analysis and Outlook Value (US$ Million) Analysis By Region, 2018 to 2033
Figure 102: France Industry Analysis and Outlook Volume (Tons) Analysis By Region, 2018 to 2033
Figure 103: France Industry Analysis and Outlook Value Share (%) and BPS Analysis By Region, 2023 to 2033
Figure 104: France Industry Analysis and Outlook Y-o-Y Growth (%) Projections By Region, 2023 to 2033
Figure 105: France Industry Analysis and Outlook Value (US$ Million) Analysis by Form, 2018 to 2033
Figure 106: France Industry Analysis and Outlook Volume (Tons) Analysis by Form, 2018 to 2033
Figure 107: France Industry Analysis and Outlook Value Share (%) and BPS Analysis by Form, 2023 to 2033
Figure 108: France Industry Analysis and Outlook Y-o-Y Growth (%) Projections by Form, 2023 to 2033
Figure 109: France Industry Analysis and Outlook Value (US$ Million) Analysis by Type, 2018 to 2033
Figure 110: France Industry Analysis and Outlook Volume (Tons) Analysis by Type, 2018 to 2033
Figure 111: France Industry Analysis and Outlook Value Share (%) and BPS Analysis by Type, 2023 to 2033
Figure 112: France Industry Analysis and Outlook Y-o-Y Growth (%) Projections by Type, 2023 to 2033
Figure 113: France Industry Analysis and Outlook Value (US$ Million) Analysis by Application, 2018 to 2033
Figure 114: France Industry Analysis and Outlook Volume (Tons) Analysis by Application, 2018 to 2033
Figure 115: France Industry Analysis and Outlook Value Share (%) and BPS Analysis by Application, 2023 to 2033
Figure 116: France Industry Analysis and Outlook Y-o-Y Growth (%) Projections by Application, 2023 to 2033
Figure 117: France Industry Analysis and Outlook Attractiveness by Form, 2023 to 2033
Figure 118: France Industry Analysis and Outlook Attractiveness by Type, 2023 to 2033
Figure 119: France Industry Analysis and Outlook Attractiveness by Application, 2023 to 2033
Figure 120: France Industry Analysis and Outlook Attractiveness By Region, 2023 to 2033
Figure 121: Spain Industry Analysis and Outlook Value (US$ Million) by Form, 2023 to 2033
Figure 122: Spain Industry Analysis and Outlook Value (US$ Million) by Type, 2023 to 2033
Figure 123: Spain Industry Analysis and Outlook Value (US$ Million) by Application, 2023 to 2033
Figure 124: Spain Industry Analysis and Outlook Value (US$ Million) By Region, 2023 to 2033
Figure 125: Spain Industry Analysis and Outlook Value (US$ Million) Analysis By Region, 2018 to 2033
Figure 126: Spain Industry Analysis and Outlook Volume (Tons) Analysis By Region, 2018 to 2033
Figure 127: Spain Industry Analysis and Outlook Value Share (%) and BPS Analysis By Region, 2023 to 2033
Figure 128: Spain Industry Analysis and Outlook Y-o-Y Growth (%) Projections By Region, 2023 to 2033
Figure 129: Spain Industry Analysis and Outlook Value (US$ Million) Analysis by Form, 2018 to 2033
Figure 130: Spain Industry Analysis and Outlook Volume (Tons) Analysis by Form, 2018 to 2033
Figure 131: Spain Industry Analysis and Outlook Value Share (%) and BPS Analysis by Form, 2023 to 2033
Figure 132: Spain Industry Analysis and Outlook Y-o-Y Growth (%) Projections by Form, 2023 to 2033
Figure 133: Spain Industry Analysis and Outlook Value (US$ Million) Analysis by Type, 2018 to 2033
Figure 134: Spain Industry Analysis and Outlook Volume (Tons) Analysis by Type, 2018 to 2033
Figure 135: Spain Industry Analysis and Outlook Value Share (%) and BPS Analysis by Type, 2023 to 2033
Figure 136: Spain Industry Analysis and Outlook Y-o-Y Growth (%) Projections by Type, 2023 to 2033
Figure 137: Spain Industry Analysis and Outlook Value (US$ Million) Analysis by Application, 2018 to 2033
Figure 138: Spain Industry Analysis and Outlook Volume (Tons) Analysis by Application, 2018 to 2033
Figure 139: Spain Industry Analysis and Outlook Value Share (%) and BPS Analysis by Application, 2023 to 2033
Figure 140: Spain Industry Analysis and Outlook Y-o-Y Growth (%) Projections by Application, 2023 to 2033
Figure 141: Spain Industry Analysis and Outlook Attractiveness by Form, 2023 to 2033
Figure 142: Spain Industry Analysis and Outlook Attractiveness by Type, 2023 to 2033
Figure 143: Spain Industry Analysis and Outlook Attractiveness by Application, 2023 to 2033
Figure 144: Spain Industry Analysis and Outlook Attractiveness By Region, 2023 to 2033
Figure 145: Rest of Industry Analysis and Outlook Value (US$ Million) by Form, 2023 to 2033
Figure 146: Rest of Industry Analysis and Outlook Value (US$ Million) by Type, 2023 to 2033
Figure 147: Rest of Industry Analysis and Outlook Value (US$ Million) by Application, 2023 to 2033
Figure 148: Rest of Industry Analysis and Outlook Value (US$ Million) Analysis by Form, 2018 to 2033
Figure 149: Rest of Industry Analysis and Outlook Volume (Tons) Analysis by Form, 2018 to 2033
Figure 150: Rest of Industry Analysis and Outlook Value Share (%) and BPS Analysis by Form, 2023 to 2033
Figure 151: Rest of Industry Analysis and Outlook Y-o-Y Growth (%) Projections by Form, 2023 to 2033
Figure 152: Rest of Industry Analysis and Outlook Value (US$ Million) Analysis by Type, 2018 to 2033
Figure 153: Rest of Industry Analysis and Outlook Volume (Tons) Analysis by Type, 2018 to 2033
Figure 154: Rest of Industry Analysis and Outlook Value Share (%) and BPS Analysis by Type, 2023 to 2033
Figure 155: Rest of Industry Analysis and Outlook Y-o-Y Growth (%) Projections by Type, 2023 to 2033
Figure 156: Rest of Industry Analysis and Outlook Value (US$ Million) Analysis by Application, 2018 to 2033
Figure 157: Rest of Industry Analysis and Outlook Volume (Tons) Analysis by Application, 2018 to 2033
Figure 158: Rest of Industry Analysis and Outlook Value Share (%) and BPS Analysis by Application, 2023 to 2033
Figure 159: Rest of Industry Analysis and Outlook Y-o-Y Growth (%) Projections by Application, 2023 to 2033
Figure 160: Rest of Industry Analysis and Outlook Attractiveness by Form, 2023 to 2033
Figure 161: Rest of Industry Analysis and Outlook Attractiveness by Type, 2023 to 2033
Figure 162: Rest of Industry Analysis and Outlook Attractiveness by Application, 2023 to 2033
The pulse ingredient sales in Western Europe were valued at USD 3,634 million in 2022.
The market value of pulse ingredient in Western Europe is set to reach USD 3,795.81 million in 2023.
The demand for pulse ingredient in Western Europe is anticipated to rise at 5.4% CAGR from 2023 to 2033.
The Western Europe market size for pulse ingredient is set to reach USD 6,439.45 million by 2033.
Flour segment is expected to dominate the pulse ingredient industry with a share of 54.0% from 2023 to 2033.
The HCAGR of sales of pulse ingredient in Western Europe was 3.0% between 2018 and 2022.
Explore Similar Insights
Thank you!
You will receive an email from our Business Development Manager. Please be sure to check your SPAM/JUNK folder too.