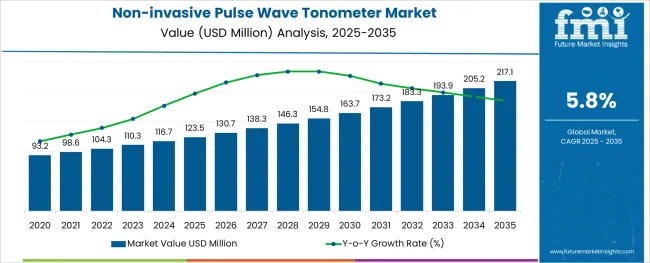
The Non-invasive Pulse Wave Tonometer Market is estimated to be valued at USD 123.5 million in 2025 and is projected to reach USD 217.1 million by 2035, registering a compound annual growth rate (CAGR) of 5.8% over the forecast period.
The non-invasive pulse wave tonometer market is experiencing notable expansion, propelled by the global rise in cardiovascular diseases, increasing geriatric population, and the medical community’s shift toward non-invasive diagnostic tools. These devices, which measure arterial stiffness and central blood pressure without penetrating the skin, are gaining favor as clinicians seek early indicators of hypertension and vascular aging. Enhanced accuracy, portability, and digital integration with electronic health records are supporting their growing use in both primary and specialty care settings.
Regulatory encouragement toward preventative diagnostics and evidence-based risk stratification is further fostering adoption.
Investment in wearable and connected device ecosystems is paving the way for long-term growth opportunities, particularly as chronic disease management increasingly moves toward outpatient and home-based models.
The market is segmented by Indication and End User and region. By Indication, the market is divided into Hypertension, Renal Disease, COPD, Diabetes, Heart Failure, and Others. In terms of End User, the market is classified into Hospitals, Clinics, and Others. Regionally, the market is classified into North America, Latin America, Western Europe, Eastern Europe, Balkan & Baltic Countries, Russia & Belarus, Central Asia, East Asia, South Asia & Pacific, and the Middle East & Africa.
The market is segmented by Indication and End User and region. By Indication, the market is divided into Hypertension, Renal Disease, COPD, Diabetes, Heart Failure, and Others. In terms of End User, the market is classified into Hospitals, Clinics, and Others. Regionally, the market is classified into North America, Latin America, Western Europe, Eastern Europe, Balkan & Baltic Countries, Russia & Belarus, Central Asia, East Asia, South Asia & Pacific, and the Middle East & Africa.
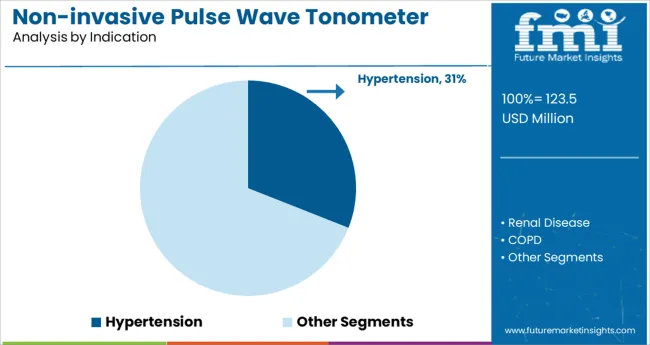
Hypertension is projected to account for 31.0% of the revenue share in the non-invasive pulse wave tonometer market in 2025, making it the most significant indication segment. This prominence is being driven by the high global burden of undiagnosed or poorly managed blood pressure conditions. Non-invasive tonometers provide critical arterial stiffness data that can help detect early-stage hypertensive risk before conventional sphygmomanometry reveals elevated values.
Clinical protocols are increasingly incorporating these tools for risk profiling, particularly in patients with borderline readings or comorbidities. The ability to monitor central aortic pressure non-invasively is improving diagnostic accuracy and enabling more personalized therapy adjustments, especially for drug-resistant hypertension.
With healthcare systems emphasizing prevention and cost reduction, early-stage cardiovascular diagnostics like tonometry are expected to continue gaining traction within standard hypertension assessment workflows.
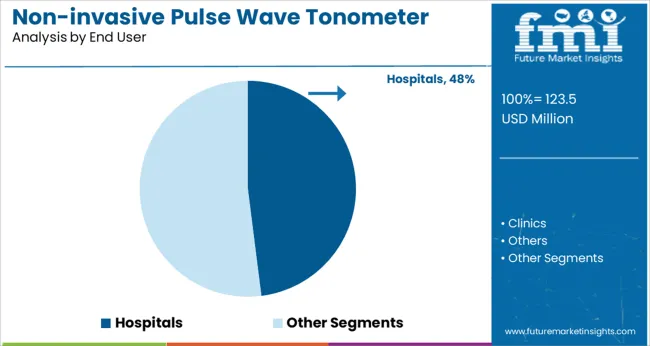
Hospitals are expected to contribute 48.0% of the total market revenue in 2025, positioning them as the leading end-user in the non-invasive pulse wave tonometer market. This dominance is attributed to the comprehensive diagnostic infrastructure, availability of trained personnel, and integration of tonometry devices within cardiology and internal medicine departments.
Hospitals rely on high-throughput, non-invasive diagnostics for screening and monitoring high-risk patients, especially those with multiple comorbidities. These settings also benefit from the ability to link pulse wave data to centralized electronic health systems, enhancing continuity of care.
Moreover, adoption is being reinforced by increased demand for pre-operative cardiovascular screening and post-discharge monitoring to mitigate hospital readmission risks. As hospital networks prioritize value-based care models and early intervention protocols, tonometers are playing a vital role in non-invasive vascular assessment strategies.
From 2020 to 2024, sales witnessed significant growth, registering a CAGR of 4.7%. The proper monitoring of blood flow helps to manage the flow of blood and also help the doctors and another healthcare professional to monitor the patients for various disorders such as COPD (Chronic Obstructive Pulmonary Disease), hypertension, and other problem, non-invasive pulse wave tonometer is used mainly consider for the heart-related problem. Nowadays most treatment centers are using these devices.
Non-invasive pulse wave tonometer is mostly used for monitoring blood flow and understanding the various diseases, to provide treatment. Various innovations are going on for developing the product to provide real-time monitoring of flow and provide treatment. The increasing number of patients and technological enhancement is the major potential for the non-invasive pulse wave tonometer market. The overall demand for non-invasive pulse wave tonometers is projected to grow at a CAGR of 5.8% between 2025 and 2035, totaling around USD 217.1 Million by 2035.
Increased Product Innovation Likely to Augment Non-invasive Pulse Wave Tonometer Sales
Non-invasive pulse wave tonometer is a growing market over the forecast period, as the number of patients is increasing related to heart, hypertension, and others. According to the British Lung Foundation, approx. 1.2 million people are suffering from COPD. The number of patients who are suffering from heart-related problems is also increasing in every region of the world.
The players are also coming up with new product innovations to make the product portable and provide in-depth monitoring of blood flow. The major strength of the system is that it can monitor the flow of blood non-invasive, while in the traditional case, the catheter was inserted to monitor the flow.
High Rates of Investment to Impede the Growth
Although Non-invasive Pulse Wave Tonometer offers good ROI in the long run, the high initial investment is a deterrent for many organizations.
The high cost along with awareness and viability of the product the hinderers of the non-invasive pulse wave tonometer market.
Rising Market Competition to Boost the Market Growth in North America
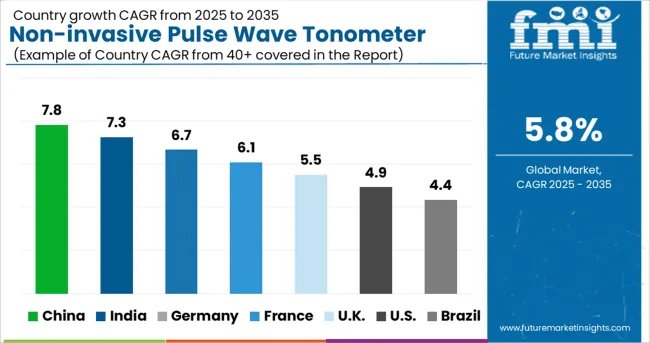
The North American non-invasive pulse wave tonometer market is expected to accumulate a market share of 33.7% in 2025. North America is dominating and contributing the leading shares to the non-invasive pulse wave tonometer market in terms of revenue and is expected to register significant growth over a forecast period due to the increasing market competition.
The rising prevalence of glaucoma in the region is also adding to the market growth. According to the American Academy of Ophthalmology (AAO), glaucoma affects over 2.7 million of the population aged 40 and older in the USA
Rising Prevalence of Glaucoma Risk Factors to Boost Market Growth in Europe
The European region is anticipated to hold a market share of 30.8%. According to the WHO, there are over 60 million people living with diabetes in the European region. This is mainly due to rising behavioral risk factors such as smoking, alcohol consumption, unhealthy food habits, and a sedentary lifestyle.
Europe is expected to contribute to moderate revenue market share and register a healthy growth rate in the global Non-invasive Pulse Wave Tonometer market due to the rising prevalence of glaucoma risk factors such as diabetes, myopia, and hypertension in the region.
Some key start-ups in the Non-invasive Pulse Wave Tonometer market include:
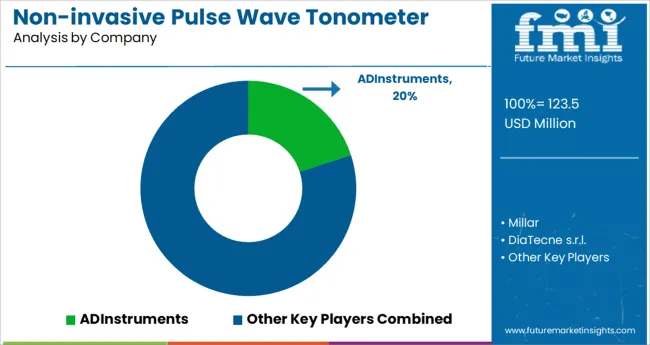
Prominent players in the Non-invasive Pulse Wave Tonometer market are ADInstruments, Millar, DiaTecne s.r.l. and AtCor Medical Pty Ltd., and various other regional players.
| Report Attribute | Details |
|---|---|
| Growth Rate | CAGR of 5.8% from 2025 to 2035 |
| Market Value in 2025 | USD 123.5 million |
| Market Value in 2035 | USD 217.1 million |
| Base Year for Estimation | 2024 |
| Historical Data | 2020 to 2024 |
| Forecast Period | 2025 to 2035 |
| Quantitative Units | Revenue in million and CAGR from 2025 to 2035 |
| Report Coverage | Revenue Forecast, Company Ranking, Competitive Landscape, Growth Factors, Trends and Pricing Analysis |
| Segments Covered | End-User, Indication, Region |
| Regions Covered | North America; Latin America; Europe; South Asia; East Asia; Oceania; Middle East and Africa (MEA) |
| Key Countries Profiled | The USA, Canada, Brazil, Mexico, Germany, The United Kingdom, France, Spain, Italy, India, Malaysia, Singapore, Thailand, China, Japan, South Korea, Australia, New Zealand, GCC, South Africa, Israel |
| Key Companies Profiled | ADInstruments; Millar; DiaTecne s.r.l; AtCor Medical Pty. Ltd.; Haag Streit AG; Ametek Industries Technology; Ray Vision International Corporation; Crystalvue Medical; Shanghai Vowish Optical Co. Ltd. |
| Customization | Available upon Request |
The global non-invasive pulse wave tonometer market is estimated to be valued at USD 123.5 million in 2025.
It is projected to reach USD 217.1 million by 2035.
The market is expected to grow at a 5.8% CAGR between 2025 and 2035.
The key product types are hypertension, renal disease, copd, diabetes, heart failure and others.
hospitals segment is expected to dominate with a 48.0% industry share in 2025.


Our Research Products

The "Full Research Suite" delivers actionable market intel, deep dives on markets or technologies, so clients act faster, cut risk, and unlock growth.

The Leaderboard benchmarks and ranks top vendors, classifying them as Established Leaders, Leading Challengers, or Disruptors & Challengers.

Locates where complements amplify value and substitutes erode it, forecasting net impact by horizon

We deliver granular, decision-grade intel: market sizing, 5-year forecasts, pricing, adoption, usage, revenue, and operational KPIs—plus competitor tracking, regulation, and value chains—across 60 countries broadly.

Spot the shifts before they hit your P&L. We track inflection points, adoption curves, pricing moves, and ecosystem plays to show where demand is heading, why it is changing, and what to do next across high-growth markets and disruptive tech

Real-time reads of user behavior. We track shifting priorities, perceptions of today’s and next-gen services, and provider experience, then pace how fast tech moves from trial to adoption, blending buyer, consumer, and channel inputs with social signals (#WhySwitch, #UX).

Partner with our analyst team to build a custom report designed around your business priorities. From analysing market trends to assessing competitors or crafting bespoke datasets, we tailor insights to your needs.
Supplier Intelligence
Discovery & Profiling
Capacity & Footprint
Performance & Risk
Compliance & Governance
Commercial Readiness
Who Supplies Whom
Scorecards & Shortlists
Playbooks & Docs
Category Intelligence
Definition & Scope
Demand & Use Cases
Cost Drivers
Market Structure
Supply Chain Map
Trade & Policy
Operating Norms
Deliverables
Buyer Intelligence
Account Basics
Spend & Scope
Procurement Model
Vendor Requirements
Terms & Policies
Entry Strategy
Pain Points & Triggers
Outputs
Pricing Analysis
Benchmarks
Trends
Should-Cost
Indexation
Landed Cost
Commercial Terms
Deliverables
Brand Analysis
Positioning & Value Prop
Share & Presence
Customer Evidence
Go-to-Market
Digital & Reputation
Compliance & Trust
KPIs & Gaps
Outputs
Full Research Suite comprises of:
Market outlook & trends analysis
Interviews & case studies
Strategic recommendations
Vendor profiles & capabilities analysis
5-year forecasts
8 regions and 60+ country-level data splits
Market segment data splits
12 months of continuous data updates
DELIVERED AS:
PDF EXCEL ONLINE
Pulse Ingredient Industry Analysis in Japan Size and Share Forecast Outlook 2025 to 2035
Pulse Ingredient Industry Analysis in Western Europe Size and Share Forecast Outlook 2025 to 2035
Pulse Ingredient Industry Analysis in Korea Size and Share Forecast Outlook 2025 to 2035
Pulse Safety Resistor Market Size and Share Forecast Outlook 2025 to 2035
Pulses Market Analysis - Size, Share, & Forecast Outlook 2025 to 2035
Pulse Flours Market Size and Share Forecast Outlook 2025 to 2035
Pulse Lavage Market Size and Share Forecast Outlook 2025 to 2035
Pulse Electromagnetic Field Therapy Devices Market Size and Share Forecast Outlook 2025 to 2035
Pulse Ingredients Market Analysis – Size, Share, and Forecast 2025 to 2035
Pulse Oximeter Market Size and Share Forecast Outlook 2025 to 2035
Pulse Width Modulation Controllers Market Size and Share Forecast Outlook 2025 to 2035
Pulse Products Market Analysis - Size, Share, and Forecast Outlook 2025 to 2035
Analyzing Pulses Market Share & Industry Trends
Pulsed Field Ablation Market Analysis by Product, End User, and Region - Forecast for 2025 to 2035
Pulse Generator Market
UK Pulses Market Growth – Trends, Demand & Innovations 2025–2035
MRI Pulse Oximeters Market Size and Share Forecast Outlook 2025 to 2035
USA Pulses Market Insights – Demand, Size & Industry Trends 2025–2035
LiDAR Pulsed Fiber Laser Market Size and Share Forecast Outlook 2025 to 2035
Smart Pulse Oximeters Market Size and Share Forecast Outlook 2025 to 2035

Thank you!
You will receive an email from our Business Development Manager. Please be sure to check your SPAM/JUNK folder too.
Chat With
MaRIA