Reports

- Global Locations -

Headquarters

Future Market Insights, Inc.

Christiana Corporate, 200
Continental Drive, Suite 401,
Newark, Delaware - 19713,
United States

T: +1-845-579-5705

Americas

Future Market Insights, Inc.

616 Corporate Way, Suite 2-9018,
Valley Cottage, NY 10989, United States

T: +1-347-918-3531

MEA

Future Market Insights

1602-6 Jumeirah Bay X2 Tower, Plot No: JLT-PH2-X2A,
Jumeirah Lakes Towers, Dubai,
United Arab Emirates

Europe

Future Market Insights

3rd Floor, 207 Regent Street,
W1B 3HH London
United Kingdom

T: + 44 (0) 20 8123 9659
D: +44 (0) 20 3287 4268

Asia Pacific

Future Market Insights

IndiaLand Global Tech Park, Unit UG-1, Behind Grand HighStreet, Phase 1, Hinjawadi, MH, Pune – 411057, India

Glaucoma treatment Market Snapshot

The global glaucoma treatment market holds a valuation of US$ 5.7 Billion by the end of the year 2022. Throughout the forecast period of 2023 to 2033, the market is likely to display growth at a CAGR of 3.18%, and is expected to hold a market value of around US$ 8.0 Billion in 2033.

Market Outlook:

Data Points Market Insights
Market Value 2022 US$ 5.7 Billion
Market Value 2023 US$ 5.8 Billion
Market Value 2033 US$ 8.0 Billion
CAGR 2023 to 2033 3.2%
Market Share of Top 5 Countries (2022) 55.2%
Key Market Players AERIE Pharmaceuticals, Inc., Cipla Inc., Akorn Operating Company LLC, AbbVie, Bausch & Lomb Incorporated, Inoteck Pharmaceuticals, Merck & Co., Inc., Novartis AG, Pfizer Inc., Santen Pharmaceutical Co., Ltd., Teva Pharmaceutical Industries Ltd.

Glaucoma is the most common and second leading eye diseases and causes irreversible blindness by damaging optic nerve by high eye pressure. The common glaucoma type is open angle glaucoma causes vision loss with no apparent symptoms, while angle closure glaucoma is infrequent glaucoma and occurs with symptoms like eye pain with visual disturbance, and nausea. Glaucoma aetiology includes age-related macular degeneration, cataract, diabetic retinopathy, glaucoma, uncorrected refractive errors, and other factors.

According to the World Health Organization (WHO), about 4.5 million people suffers from glaucoma globally in 2019. As per published data of National Glaucoma Research data in 2022, currently glaucoma patients are more than 80 million and it is anticipated to increase beyond 111 million till 2040.

Don't pay for what you don't need

Customize your report by selecting specific countries or regions and save 30%!

Sales Analysis from 2017 to 2022 Vs Market Outlook for 2023 to 2033 for Glaucoma Treatment industry

The glaucoma treatment industry expanded at a CAGR of 3.0% for 2017 to 2022 period due to increasing prevalence of glaucoma disease and diabetes, old - age population, and innovative technologies with novel pharmacological discoveries.

The global glaucoma treatment market contributes 15.9% value share to the global eye disorders and treatment market valued at US$ 35.8 Billion in 2022.

The glaucoma condition is frequently known as silent thief of sigh since most of the glaucoma variations rarely show pain or other obvious signs before causing noticeable vision loss; hence, number of glaucoma cases are rising. Government and pharmaceutical company activities are raising awareness of glaucoma are promoting the expansion of the market for glaucoma treatments.

Another factor driving the expansion of the market of glaucoma treatment is technological development in eye drops, which are the primary glaucoma control measure. Pharmaceutical and biotech businesses are also investing in the creation of novel glaucoma products. The most common medications used to treat glaucoma today include alpha-adrenergic agonists, beta-blockers, carbonic anhydrase inhibitors, prostaglandin analogues, and combinations of these drugs. In contrast, the absence of discomfort and symptoms other than apparent vision loss are regarded as a problem for the market of glaucoma treatment.

H1-H2 Update

Market Statistics Details
Jan-Jun (H1), 2021 (A) 2.44%
Jul-Dec (H2), 2021 (A) 3.55%
Jan-Jun (H1),2022 Projected (P) 2.33%
Jan-Jun (H1),2022 Outlook (O) 2.57%
Jul-Dec (H2), 2022 Outlook (O) 3.39%
Jul-Dec (H2), 2022 Projected (P) 3.19%
Jan-Jun (H1), 2023 Projected (P) 2.70%
BPS Change : H1,2022 (O) - H1,2022 (P) 24 ↑
BPS Change : H1,2022 (O) - H1,2021 (A) 13 ↑
BPS Change: H2, 2022 (O) - H2, 2022 (P) 20 ↑
BPS Change: H2, 2022 (O) - H2, 2022 (A) (-) 17 ↓
Sabyasachi Ghosh
Sabyasachi Ghosh

Principal Consultant

Talk to Analyst

Find your sweet spots for generating winning opportunities in this market.

What are the Key Opportunities for Glaucoma Treatment Industry?

Rising elderly populations and glaucoma awareness in several countries, as well as an increase in government and private sector initiatives to cure glaucoma and reduce the financial treatment cost, are expected to drive the glaucoma market demand.

An increase in the number of new innovative products and clinical trial products is boosting the industry's growth. The University of Minnesota College of Pharmacy's Department of Medicinal Chemistry and the Institute for Therapeutics Discovery & Development (ITDD) collaborated to create a novel medicine for the treatment of glaucoma in 2022.

The market is primarily driven by the ophthalmology industry's rapid technical advancements and the growing use of innovative surgical methods. The need for optometrists has grown as a result of advancements in optical coherence tomography (OCT), selective laser trabeculoplasty (SLT), medical imaging, progression analysis software, and microinvasive glaucoma surgery (MIGS). This is one of the key driving forces for the market's expansion. The size of the glaucoma market is anticipated to increase with the introduction of laser therapy and pharmaceuticals for the condition.

What are the Factors Restraining Demand for Glaucoma Treatment Industry?

It is challenging to treat glaucoma because it does not initially cause symptoms like pain or vision loss. Glaucoma surgery also frequently results in a number of post-operative problems. Shortage of experienced healthcare workers and a lack of knowledge about glaucoma treatment in emerging nations may impede the growth of the industry of glaucoma treatment in the years to come.

The glaucoma drug approval process is stringent, and sometimes need to remove or reject a product from market due to safety issues concerns and also, by various other reasons, including bioavailability, drug performance, efficacy, PH properties, toxicity. Apotex Corp, for example, is recalling 22,027 bottles of timolol maleate ophthalmic solution in 2023 due to drug samples failed to meet stability specifications.

Drug side effects are also associated with glaucoma treatment. Prostaglandin analogues, for example, have side effects such as eye redness and itching; beta blockers have side effects such as low blood pressure and decreased libido; and Rho kinase inhibitors have side effects such as stinging and small bleeds on the white part of the eye.

Get the data you need at a Fraction of the cost

Personalize your report by choosing insights you need
and save 40%!

Country-wise insights

Country The USA
Market Share (2023) 29.7%
Market Share (2033) 29.8%
BPS Analysis 9
Country China
Market Share (2023) 11.1%
Market Share (2033) 11.3%
BPS Analysis 21
Country Russia
Market Share (2023) 5.6%
Market Share (2033) 5.7%
BPS Analysis 1
Country Germany
Market Share (2023) 5.2%
Market Share (2033) 5.4%
BPS Analysis 25
Country Canada
Market Share (2023) 4.1%
Market Share (2033) 3.9%
BPS Analysis -19

What is Driving the USA Glaucoma treatment Industry?

The USA will dominate the global market of glaucoma treatment in 2023 with a market share of 29.7% in global glaucoma treatment market. The rising prevalence of various types of glaucoma in the region would boost the demand for glaucoma therapies.

The market will grow as more people become aware of the importance of eye care and the associated diagnoses and treatments. The region's significant presence of important market companies involved in new drug research and product approvals would boost regional industry growth.

Due to the increased glaucoma incidence and improved healthcare infrastructure, the United States is likely to be the largest glaucoma treatment industry. According to the BrightFocus Foundation, more than 3 million Americans are affected by glaucoma, with open-angle glaucoma being the most frequent type.

Glaucoma costs the USA economy around USD 2.86 billion in direct costs and productivity losses each year. Many organizations in the United States are raising awareness of glaucoma, which is projected to boost the market's overall growth.

Why is the Germany Glaucoma Treatment Market Considered Lucrative?

Germany will hold the market share of 5.2% for its glaucoma treatment in 2023 global market.

Glaucoma is one of the leading causes of blindness in the world. Around 500,000 people in Germany have high intraocular pressure, and 10% of them are at risk of going blind. The number of unreported cases, however, is likely to be even higher. Glaucoma affects both men and women at a younger age. Acute glaucoma can strike at any age, but the risk rises significantly with age. Women are more vulnerable than men.

According to hospital quality reports, glaucoma treatment in Germany became more efficient from classical to modern treatment procedures after 2006, and it became a potential for stringent repayment guidelines.

What Makes the Indian Glaucoma Treatment Sector Attractive?

The Indian Glaucoma treatment sector is expected to grow at a CAGR of 4.3% between 2023 and 2033.

Market expansion is fuelled by the rising elderly population as well as innovations in glaucoma and cataract surgery equipment technology. The development of micro-invasive glaucoma drainage implants, which are used to treat glaucoma and offer a safer and less intrusive means of reducing intraocular pressure (IOP) as compared to standard glaucoma surgery devices, is another area where manufacturers are placing more emphasis.

However, a shortage of qualified experts, a refusal to pay for the use of glaucoma and cataract surgical tools, and the exorbitant cost of cataract operation, particularly in emerging economies hinder market expansion. The government and other charitable groups' efforts to educate the public about the advantages of cataract surgery, eye problems, and the availability of cutting-edge technology have also opened up lucrative market potential in India.

Category-wise Insights

Which Disease Type for Glaucoma treatment is Driving the Market Growth?

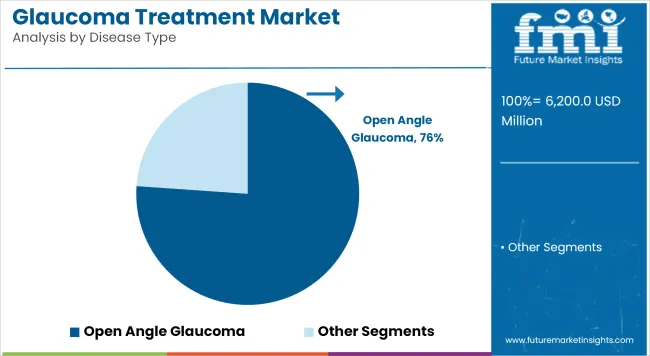
Open angle Glaucoma disease type will contribute market share for about 81.35% in 2023 global market and it is expected to be stable through the forecast.

The most common type of glaucoma in the population is primary open angle glaucoma (POAG). According to a glaucoma genetics article published in the human molecular genetics journal, more than 57.5 million people worldwide were affected by POAG in 2020, with a global prevalence of 2.2%. As a result, rising glaucoma disease burden is expected to provide lucrative market growth opportunities.

The development of biologics is one of the main open angle glaucoma therapeutics industry trends driving market expansion. Several biologics are being developed for the treatment of open angle glaucoma. These drugs are expected to be more effective and safer than small molecules. As a result, it is expected that the development of such new biologics for the treatment of open angle glaucoma will meet the unmet need for an innovative and secure treatment of open-angle glaucoma, assisting the market to expand to a certain amount over the forecast period.

Which Drug Class is Anticipated to Lead the Glaucoma Treatment Market?

The prostaglandin analogue sector will hold a 33.36% market share in the global market for treating glaucoma in 2023 because ophthalmic drugs are becoming more widely accessible and available. Prostaglandin analogues are widely used to lower intraocular pressure due to their effectiveness, once-daily dose, lack of adverse effects, and improved recovery rates in the treatment of glaucoma, which will drive market demand. It is also projected that rising demand for prostaglandin medications in combination therapy would present the market with significant potential prospects. The overall market statistics will be further boosted by growing consumer awareness of early glaucoma therapy and an increase in the number of patients receiving early eye illness diagnosis.

On the Basis of Distribution Channel, which are the Key Segments of the Glaucoma Treatment Market?

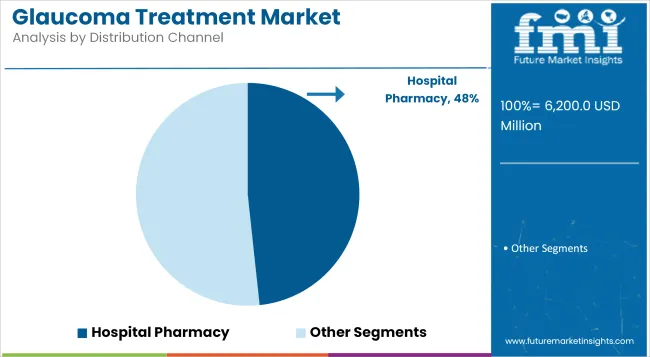
Hospital pharmacies segment will hold the market share of 56.55% in 2023 globally. The demand for hospital pharmacies will be boosted by the increased availability of innovative medications.

In 2022, the hospital pharmacy segment was worth more than USD 3 billion. Throughout the analysis, the segment is expected to grow significantly. The significant growth is due to the widespread availability of products in various settings for various forms of glaucoma therapy.

Patient's preference for hospital pharmacies for prescribed medications also contributes to income growth. Reimbursement rules and insurance coverage for drug purchases made in hospital settings are also expected to improve market predictions.

Comparative View of Adjacent Glaucoma Treatment Market

Glaucoma treatment Market:

Attributes Glaucoma treatment Market
CAGR (2023 to 2033) 3.18%
Market Value (2023) US$ 5.7 Billion
Growth Factor Innovation in new technologies to offer impetus to the market. Investments in prostaglandin analogs to create opportunities.
Key Market Trend Ease of use of eye drops to remain a dominant market trend.

Glaucoma Therapeutics Market:

Attributes Glaucoma Therapeutics Market
CAGR (2023 to 2033) 3.6%
Market Value (2023) US$ 7.2 Billion
Growth Factor Rising awareness about the condition to offer growth prospects. Demand for minimally invasive surgeries to offer opportunities.
Key Trend Intense focus on advanced technology for product development to remain a key trend.

Cataract Surgery Devices Market:

Attributes Cataract Surgery Devices Market
CAGR (2023 to 2033) 4.8%
Market Value (2023) US$ 8.6 Billion
Growth Factor The global market is driven by the aging population and increased prevalence of ocular disorders which results in higher demand for cataract surgery devices.
Key Trend Bringing new levels of safety and accuracy, surging the demand for cataract surgery devices.

Competitive Landscape

The key companies in the glaucoma treatment are concentrating their efforts on partnerships and collaborations as the primary means of increasing their geographical presence. These will aid market participants in expanding both their new product launch and market penetration.

  • Teva Pharmaceuticals announced the first generic version of AZOPT (brinzolamide ophthalmic suspension) 1 percent in March 2021 in the United States to treat open-angle glaucoma and ocular hypertension. The company's product portfolio has been strengthened as a result of this.
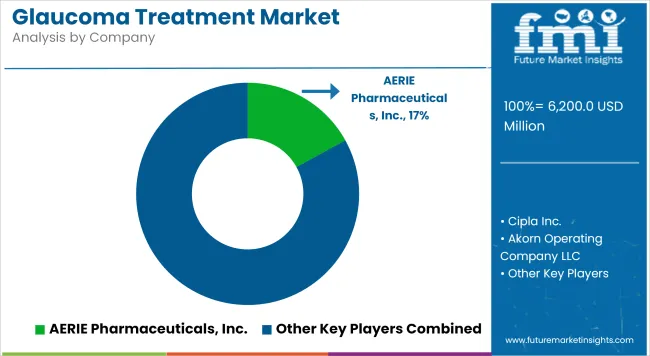
  • Aerie Pharmaceuticals and Santen Pharmaceuticals entered into a partnership agreement in December 2021. This partnership will lead to development and marketing of product for glaucoma therapy which included Rhopressa/Rhokiinsa and Rocklatan/Roclanda. Both companies are set to commercialize these products across various geographies including India, Europe, Oceania, China, and parts of Latin America, thereby strengthening their current market positioning in these regions.

Similarly, recent developments have been tracked by the team at Future Market Insights related to companies in the glaucoma treatment market, which are available in the full report.

Report Scope as Per Glaucoma Treatment Market Industry Analysis

Attribute Details
Forecast Period 2023 to 2033
Historical Data Available for 2017 to 2022
Market Analysis US$ Million for Value
Key Regions Covered North America, Latin America, Europe, East Asia, South Asia, Oceania and Middle East and Africa (MEA)
Key Countries Covered USA, Canada, Brazil, Mexico, Argentina, United Kingdom, Germany, Italy, France, Spain, Russia, BENELUX, China, Japan, South Korea, India, Indonesia, Malaysia, Thailand, Australia, New Zealand, GCC countries, Türkiye, South Africa and North Africa.
Key Market Segments Covered Disease Type, Drug Class, Distribution Channel, and Region
Key Companies Profiled
  • AERIE Pharmaceuticals, Inc.
  • Cipla Inc.
  • Akorn Operating Company LLC
  • AbbVie
  • Bausch & Lomb Incorporated
  • Inoteck Pharmaceuticals
  • Merck & Co., Inc.
  • Novartis AG
  • Pfizer Inc.
  • Santen Pharmaceutical Co., Ltd.
  • Teva Pharmaceutical Industries Ltd.
Report Coverage Market Forecast, Competition Intelligence, DROT Analysis, Market Dynamics and Challenges, Strategic Growth Initiatives
Pricing Available upon Request

Key Market Segments Covered in Glaucoma Treatment Market Research

By Disease Type:

  • Open Angle Glaucoma
  • Angle Closure Glaucoma
  • Other

By Drug Class:

  • Prostaglandin Analog
  • Beta Blockers
  • Adrenergic Agonist
  • Carbonic Anhydrase Inhibitors
  • Others

By Distribution Channel:

  • Hospital Pharmacy
  • Retail Pharmacy
  • Online Pharmacy

By Region:

  • North America
  • Latin America
  • Europe
  • East Asia
  • South Asia
  • Oceania
  • The Middle East and Africa (MEA)

Frequently Asked Questions

What is the global market of glaucoma treatment worth in 2022?

The global market of glaucoma treatment is worth US$ 5.7 Billion in 2022 and is set to expand 1.4X over the next ten years.

What is the global market estimated to reach in 2023?

The global market in estimated to reach a valuation of US$ 5.8 Billion in 2023.

What was the last 5 year’s market CAGR for glaucoma treatment sector?

Between 2017 and 2022, the global market expanded at the rate of 3.0%.

What is the sales forecast for market of glaucoma treatment through 2033?

The market of glaucoma treatment is expected to reach US$ 8.0 Billion by the end of 2033, with sales revenue expected to register 3.2% CAGR.

What is the projected CAGR for the global market from 2023 to 2033?

The global market is projected to expand at a CAGR of around 3.2% between 2023 and 2033.

Which are the top 5 countries driving demand for glaucoma treatment in 2022?

The USA, China, Russia, Germany, and Canada are expected to drive demand for glaucoma treatment sector; and the market share of these top 5 countries will be 55.2% for the year 2022.

What is the Europe market outlook for market of glaucoma treatment in 2023?

Europe is set to hold around 30.0% market share in the global market of glaucoma treatment in 2023.

Which are the key players of glaucoma treatment market?

AERIE Pharmaceuticals, Inc., Cipla Inc., Akorn Operating Company LLC, AbbVie, Bausch & Lomb Incorporated, Inoteck Pharmaceuticals, Merck & Co., Inc., Novartis AG, Pfizer Inc., Santen Pharmaceutical Co., Ltd., Teva Pharmaceutical Industries Ltd. are the key players of glaucoma treatment market.

Which disease type segment will garner significant value share in 2023?

Open angle Glaucoma disease type presents market share for about 81.35% in 2023 global market.

Which is the most lucrative market for glaucoma treatment sector in 2023?

North America is one of the key markets for glaucoma treatment sector, with the USA to account for about 29.7% of the global glaucoma treatment sector in the year 2023.

What is the Glaucoma Treatment Market Value in 2023?

The market is valued at US$ 5.8 billion in 2023.

What is the Market CAGR from 2023 to 2033?

A 3.2% CAGR is expected between 2023 and 2033 for the market.

What was the Top 5 Countries’ Share in 2022?

In 2022, the top 5 countries held 55.2% of the market share.

What is the United States Expected Revenue in 2033?

The United States is estimated to generate a 29.8% share by 2033.

Which is the Key Segment by Disease Type?

Open and glaucoma disease is to hold an 81.35% share in 2023.

Table of Content

1. Executive Summary | Glaucoma Treatment Market 

    1.1. Global Market Outlook

    1.2. Demand Side Trends

    1.3. Supply Side Trends

    1.4. Analysis and Recommendations

2. Market Overview

    2.1. Market Coverage / Taxonomy

    2.2. Market Definition / Scope / Limitations

    2.3. Inclusions and Exclusions

3. Key Market Trends

    3.1. Key Trends Impacting the Market

    3.2. Product Innovation / Development Trends

4. Key Success Factors

    4.1. Product Adoption/Usage Analysis

    4.2. Key Promotional Strategies, by Manufacturers

    4.3. Key Regulations

    4.4. PESTEL Analysis

    4.5. Porter’s Analysis

    4.6. Disease Epidemiology

    4.7. Pipeline Assessment

    4.8. Reimbursement

    4.9. Supply Chain Analysis

5. Market Background

    5.1. Macro-Economic Factors

        5.1.1. Global GDP Growth Outlook

        5.1.2. Global Healthcare Outlook

        5.1.3. Global Eye Disorders & Diseases Overview

    5.2. Forecast Factors - Relevance & Impact

        5.2.1. Top Companies Historical & Current Growth

        5.2.2. New Drug Launches and Approvals

        5.2.3. Global Ophthalmic Epidemiology

        5.2.4. R&D Expenditure by Key Players

        5.2.5. Rising Consumer Awareness of the Eye Health

        5.2.6. Rising Adoption of Glaucoma Treatment

        5.2.7. Strategic Developments by Key Players

        5.2.8. Increased Adoption of Therapies for Glaucoma

        5.2.9. Strategic Collaborations among Players

    5.3. Market Dynamics

        5.3.1. Drivers

        5.3.2. Restraints

        5.3.3. Opportunity Analysis

6. COVID-19 Crisis Analysis

    6.1. COVID-19 and Impact Analysis

        6.1.1. By Disease Type

        6.1.2. By Drug Class

        6.1.3. By Distribution Channel

        6.1.4. By Country

    6.2. 2022 Market Scenario

7. Global Market Demand (in Value or Size in US$ Million) Analysis 2017 to 2022 and Forecast, 2023 to 2033

    7.1. Historical Market Value (US$ Million) Analysis, 2017 to 2022

    7.2. Current and Future Market Size (US$ Million) Analysis and Forecast by Market Taxonomy, 2023 to 2033

        7.2.1. Y-o-Y Growth Trend Analysis

        7.2.2. Absolute $ Opportunity Analysis

8. Global Market Analysis 2017 to 2022 and Forecast 2023 to 2033, By Disease Type

    8.1. Introduction / Key Findings

    8.2. Historical Market Size (US$ Million) Analysis by Disease Type, 2017 to 2022

    8.3. Current and Future Market Size (US$ Million) Analysis and Forecast by Disease Type, 2023 to 2033

        8.3.1. Open Angle Glaucoma

        8.3.2. Angle Closure Glaucoma

        8.3.3. Other

    8.4. Market Attractiveness Analysis by Disease Type

9. Global Market Analysis 2017 to 2022 and Forecast 2023 to 2033, By Drug Class

    9.1. Introduction / Key Findings

    9.2. Historical Market Size (US$ Million) Analysis by Drug Class, 2017 to 2022

    9.3. Current and Future Market Size (US$ Million) Analysis and Forecast by Drug Class, 2023 to 2033

        9.3.1. Prostaglandin Analog

        9.3.2. Beta Blockers

        9.3.3. Adrenergic Agonist

        9.3.4. Carbonic Anhydrase Inhibitors

        9.3.5. Others

    9.4. Market Attractiveness Analysis by Drug Class

10. Global Market Analysis 2017 to 2022 and Forecast 2023 to 2033, By Distribution Channel

    10.1. Introduction / Key Findings

    10.2. Historical Market Size (US$ Million) Analysis by Distribution Channel, 2017 to 2022

    10.3. Current and Future Market Size (US$ Million) Analysis and Forecast by Distribution Channel, 2023 to 2033

        10.3.1. Hospital Pharmacy

        10.3.2. Retail Pharmacy

        10.3.3. Online Pharmacy

    10.4. Market Attractiveness Analysis by Distribution Channel

11. Global Market Analysis 2017 to 2022 and Forecast 2023 to 2033, By Region

    11.1. Introduction / Key Findings

    11.2. Historical Market Size (US$ Million) Analysis, by Region, 2017 to 2022

    11.3. Current and Future Market Size (US$ Million) Analysis and Forecast by Region, 2023 to 2033

        11.3.1. North America

        11.3.2. Latin America

        11.3.3. Europe

        11.3.4. East Asia

        11.3.5. South Asia

        11.3.6. Oceania

        11.3.7. Middle East & Africa

    11.4. Market Attractiveness Analysis by Region

12. North America Market Analysis 2017 to 2022 and Forecast 2023 to 2033

    12.1. Introduction

    12.2. Historical Market Size (US$ Million) Analysis Trend Analysis by Market Taxonomy, 2017 to 2022

    12.3. Current and Future Market Size (US$ Million) Analysis and Forecast by Market Taxonomy, 2023 to 2033

        12.3.1. By Country

            12.3.1.1. The USA

            12.3.1.2. Canada

        12.3.2. By Disease Type

        12.3.3. BY Drug Class

        12.3.4. By Distribution Channel

    12.4. Market Attractiveness Analysis

        12.4.1. By Country

        12.4.2. By Disease Type

        12.4.3. By Drug Class

        12.4.4. By Distribution Channel

    12.5. Market Trends

    12.6. Key Market Participants - Intensity Mapping

    12.7. Drivers and Restraints - Impact Analysis

    12.8. Country Level Analysis & Forecast

        12.8.1. USA Market Analysis

            12.8.1.1. Introduction

            12.8.1.2. Market Analysis and Forecast by Market Taxonomy

                12.8.1.2.1. By Disease Type

                12.8.1.2.2. By Drug Class

                12.8.1.2.3. By Distribution Channel

        12.8.2. Canada Market Analysis

            12.8.2.1. Introduction

            12.8.2.2. Market Analysis and Forecast by Market Taxonomy

                12.8.2.2.1. By Disease Type

                12.8.2.2.2. By Drug Class

                12.8.2.2.3. By Distribution Channel

13. Latin America Market Analysis 2017 to 2022 and Forecast 2023 to 2033

    13.1. Introduction

    13.2. Historical Market Size (US$ Million) Analysis Trend Analysis By Market Taxonomy, 2017 to 2022

    13.3. Current and Future Market Size (US$ Million) Analysis and Forecast by Market Taxonomy, 2023 to 2033

        13.3.1. By Country

            13.3.1.1. Mexico

            13.3.1.2. Brazil

            13.3.1.3. Argentina

            13.3.1.4. Rest of Latin America

        13.3.2. By Disease Type

        13.3.3. By Drug Class

        13.3.4. By Distribution Channel

    13.4. Market Attractiveness Analysis

        13.4.1. By Country

        13.4.2. By Disease Type

        13.4.3. By Drug Class

        13.4.4. By Distribution Channel

    13.5. Market Trends

    13.6. Key Market Participants - Intensity Mapping

    13.7. Drivers and Restraints - Impact Analysis

    13.8. Country Level Analysis & Forecast

        13.8.1. Mexico Market Analysis

            13.8.1.1. Introduction

            13.8.1.2. Market Analysis and Forecast by Market Taxonomy

                13.8.1.2.1. By Disease Type

                13.8.1.2.2. By Drug Class

                13.8.1.2.3. By Distribution Channel

        13.8.2. Brazil Market Analysis

            13.8.2.1. Introduction

            13.8.2.2. Market Analysis and Forecast by Market Taxonomy

                13.8.2.2.1. By Disease Type

                13.8.2.2.2. By Drug Class

                13.8.2.2.3. By Distribution Channel

        13.8.3. Argentina Market Analysis

            13.8.3.1. Introduction

            13.8.3.2. Market Analysis and Forecast by Market Taxonomy

                13.8.3.2.1. By Disease Type

                13.8.3.2.2. By Drug Class

                13.8.3.2.3. By Distribution Channel

14. Europe Market Analysis 2017 to 2022 and Forecast 2023 to 2033

    14.1. Introduction

    14.2. Historical Market Size (US$ Million) Analysis Trend Analysis by Market Taxonomy, 2017 to 2022

    14.3. Current and Future Market Size (US$ Million) Analysis and Forecast by Market Taxonomy, 2023 to 2033

        14.3.1. By Country

            14.3.1.1. Germany

            14.3.1.2. Italy

            14.3.1.3. France

            14.3.1.4. United Kingdom (UK)

            14.3.1.5. Spain

            14.3.1.6. BENELUX

            14.3.1.7. Russia

            14.3.1.8. Rest of Europe

        14.3.2. By Disease Type

        14.3.3. By Drug Class

        14.3.4. By Distribution Channel

    14.4. Market Attractiveness Analysis

        14.4.1. By Country

        14.4.2. By Disease Type

        14.4.3. By Drug Class

        14.4.4. By Distribution Channel

    14.5. Market Trends

    14.6. Key Market Participants - Intensity Mapping

    14.7. Drivers and Restraints - Impact Analysis

    14.8. Country Level Analysis & Forecast

        14.8.1. Germany Market Analysis

            14.8.1.1. Introduction

            14.8.1.2. Market Analysis and Forecast by Market Taxonomy

                14.8.1.2.1. By Disease Type

                14.8.1.2.2. By Drug Class

                14.8.1.2.3. By Distribution Channel

        14.8.2. Italy Market Analysis

            14.8.2.1. Introduction

            14.8.2.2. Market Analysis and Forecast by Market Taxonomy

                14.8.2.2.1. By Disease Type

                14.8.2.2.2. By Drug Class

                14.8.2.2.3. By Distribution Channel

        14.8.3. France Market Analysis

            14.8.3.1. Introduction

            14.8.3.2. Market Analysis and Forecast by Market Taxonomy

                14.8.3.2.1. By Disease Type

                14.8.3.2.2. By Drug Class

                14.8.3.2.3. By Distribution Channel

        14.8.4. United Kingdom Market Analysis

            14.8.4.1. Introduction

            14.8.4.2. Market Analysis and Forecast by Market Taxonomy

                14.8.4.2.1. By Disease Type

                14.8.4.2.2. By Drug Class

                14.8.4.2.3. By Distribution Channel

        14.8.5. Spain Market Analysis

            14.8.5.1. Introduction

            14.8.5.2. Market Analysis and Forecast by Market Taxonomy

                14.8.5.2.1. By Disease Type

                14.8.5.2.2. By Drug Class

                14.8.5.2.3. By Distribution Channel

        14.8.6. BENELUX Market Analysis

            14.8.6.1. Introduction

            14.8.6.2. Market Analysis and Forecast by Market Taxonomy

                14.8.6.2.1. By Disease Type

                14.8.6.2.2. By Drug Class

                14.8.6.2.3. By Distribution Channel

        14.8.7. Russia Market Analysis

            14.8.7.1. Introduction

            14.8.7.2. Market Analysis and Forecast by Market Taxonomy

                14.8.7.2.1. By Disease Type

                14.8.7.2.2. By Drug Class

                14.8.7.2.3. By Distribution Channel

15. East Asia Market Analysis 2017 to 2022 and Forecast 2023 to 2033

    15.1. Introduction

    15.2. Historical Market Size (US$ Million) Analysis Trend Analysis By Market Taxonomy, 2017 to 2022

    15.3. Current and Future Market Size (US$ Million) Analysis and Forecast by Market Taxonomy, 2023 to 2033

        15.3.1. By Country

            15.3.1.1. China

            15.3.1.2. Japan

            15.3.1.3. South Korea

        15.3.2. By Disease Type

        15.3.3. By Drug Class

        15.3.4. By Distribution Channel

    15.4. Market Attractiveness Analysis

        15.4.1. By Country

        15.4.2. By Disease Type

        15.4.3. By Drug Class

        15.4.4. By Distribution Channel

    15.5. Market Trends

    15.6. Key Market Participants - Intensity Mapping

    15.7. Drivers and Restraints - Impact Analysis

    15.8. Country Level Analysis & Forecast

        15.8.1. China Market Analysis

            15.8.1.1. Introduction

            15.8.1.2. Market Analysis and Forecast by Market Taxonomy

                15.8.1.2.1. By Disease Type

                15.8.1.2.2. By Drug Class

                15.8.1.2.3. By Distribution Channel

        15.8.2. Japan Market Analysis

            15.8.2.1. Introduction

            15.8.2.2. Market Analysis and Forecast by Market Taxonomy

                15.8.2.2.1. By Disease Type

                15.8.2.2.2. By Drug Class

                15.8.2.2.3. By Distribution Channel

        15.8.3. South Korea Market Analysis

            15.8.3.1. Introduction

            15.8.3.2. Market Analysis and Forecast by Market Taxonomy

                15.8.3.2.1. By Disease Type

                15.8.3.2.2. By Drug Class

                15.8.3.2.3. By Distribution Channel

16. South Asia Market Analysis 2017 to 2022 and Forecast 2023 to 2033

    16.1. Introduction

    16.2. Historical Market Size (US$ Million) Analysis Trend Analysis By Market Taxonomy, 2017 to 2022

    16.3. Current and Future Market Size (US$ Million) Analysis and Forecast by Market Taxonomy, 2023 to 2033

        16.3.1. By Country

            16.3.1.1. India

            16.3.1.2. Indonesia

            16.3.1.3. Malaysia

            16.3.1.4. Thailand

            16.3.1.5. Rest of South Asia

        16.3.2. By Disease Type

        16.3.3. By Drug Class

        16.3.4. By Distribution Channel

    16.4. Market Attractiveness Analysis

        16.4.1. By Country

        16.4.2. By Disease Type

        16.4.3. By Drug Class

        16.4.4. By Distribution Channel

    16.5. Market Trends

    16.6. Key Market Participants - Intensity Mapping

    16.7. Drivers and Restraints - Impact Analysis

    16.8. Country Level Analysis & Forecast

        16.8.1. India Market Analysis

            16.8.1.1. Introduction

            16.8.1.2. Market Analysis and Forecast by Market Taxonomy

                16.8.1.2.1. By Disease Type

                16.8.1.2.2. By Drug Class

                16.8.1.2.3. By Distribution Channel

        16.8.2. Indonesia Market Analysis

            16.8.2.1. Introduction

            16.8.2.2. Market Analysis and Forecast by Market Taxonomy

                16.8.2.2.1. By Disease Type

                16.8.2.2.2. By Drug Class

                16.8.2.2.3. By Distribution Channel

        16.8.3. Malaysia Market Analysis

            16.8.3.1. Introduction

            16.8.3.2. Market Analysis and Forecast by Market Taxonomy

                16.8.3.2.1. By Disease Type

                16.8.3.2.2. By Drug Class

                16.8.3.2.3. By Distribution Channel

        16.8.4. Thailand Market Analysis

            16.8.4.1. Introduction

            16.8.4.2. Market Analysis and Forecast by Market Taxonomy

                16.8.4.2.1. By Disease Type

                16.8.4.2.2. By Drug Class

                16.8.4.2.3. By Distribution Channel

17. Oceania Market 2017 to 2022 and Forecast 2023 to 2033

    17.1. Introduction

    17.2. Historical Market Size (US$ Million) Analysis Trend Analysis By Market Taxonomy, 2017 to 2022

    17.3. Current and Future Market Size (US$ Million) Analysis and Forecast by Market Taxonomy, 2023 to 2033

        17.3.1. By Country

            17.3.1.1. Australia

            17.3.1.2. New Zealand

        17.3.2. By Disease Type

        17.3.3. By Drug Class

        17.3.4. By Distribution Channel

    17.4. Market Attractiveness Analysis

        17.4.1. By Disease Type

        17.4.2. By Drug Class

        17.4.3. By Distribution Channel

    17.5. Market Trends

    17.6. Key Market Participants - Intensity Mapping

    17.7. Drivers and Restraints - Impact Analysis

    17.8. Country Level Analysis & Forecast

        17.8.1. Australia Market Analysis

            17.8.1.1. Introduction

            17.8.1.2. Market Analysis and Forecast by Market Taxonomy

                17.8.1.2.1. By Disease Type

                17.8.1.2.2. By Drug Class

                17.8.1.2.3. By Distribution Channel

        17.8.2. New Zealand Market Analysis

            17.8.2.1. Introduction

            17.8.2.2. Market Analysis and Forecast by Market Taxonomy

                17.8.2.2.1. By Disease Type

                17.8.2.2.2. By Drug Class

                17.8.2.2.3. By Distribution Channel

18. Middle East and Africa (MEA) Market Analysis 2017 to 2022 and Forecast 2023 to 2033

    18.1. Introduction

    18.2. Historical Market Size (US$ Million) Analysis Trend Analysis by Market Taxonomy, 2017 to 2022

    18.3. Current and Future Market Size (US$ Million) Analysis and Forecast by Market Taxonomy, 2023 to 2033

        18.3.1. By Country

            18.3.1.1. GCC Countries

            18.3.1.2. Türkiye

            18.3.1.3. North Africa

            18.3.1.4. South Africa

            18.3.1.5. Rest of Middle East and Africa

        18.3.2. By Disease Type

        18.3.3. By Drug Class

        18.3.4. By Distribution Channel

    18.4. Market Attractiveness Analysis

        18.4.1. By Country

        18.4.2. By Disease Type

        18.4.3. By Drug Class

        18.4.4. By Distribution Channel

    18.5. Market Trends

    18.6. Key Market Participants - Intensity Mapping

    18.7. Drivers and Restraints - Impact Analysis

    18.8. Country Level Analysis & Forecast

        18.8.1. GCC Countries Market Analysis

            18.8.1.1. Introduction

            18.8.1.2. Market Analysis and Forecast by Market Taxonomy

                18.8.1.2.1. By Disease Type

                18.8.1.2.2. By Drug Class

                18.8.1.2.3. By Distribution Channel

        18.8.2. Türkiye Market Analysis

            18.8.2.1. Introduction

            18.8.2.2. Market Analysis and Forecast by Market Taxonomy

                18.8.2.2.1. By Disease Type

                18.8.2.2.2. By Drug Class

                18.8.2.2.3. By Distribution Channel

        18.8.3. South Africa Market Analysis

            18.8.3.1. Introduction

            18.8.3.2. Market Analysis and Forecast by Market Taxonomy

                18.8.3.2.1. By Disease Type

                18.8.3.2.2. By Drug Class

                18.8.3.2.3. By Distribution Channel

        18.8.4. North Africa Market Analysis

            18.8.4.1. Introduction

            18.8.4.2. Market Analysis and Forecast by Market Taxonomy

                18.8.4.2.1. By Disease Type

                18.8.4.2.2. By Drug Class

                18.8.4.2.3. By Distribution Channel

19. Market Structure Analysis

    19.1. Market Analysis by Tier of Companies

    19.2. Market Share Analysis of Top Players

    19.3. Market Presence Analysis

20. Competition Analysis

    20.1. Competition Dashboard

    20.2. Competition Benchmarking

    20.3. Competition Deep Dive

        20.3.1. AERIE Pharmaceuticals, Inc.

            20.3.1.1. Overview

            20.3.1.2. Drug Type Portfolio

            20.3.1.3. Sales Footprint

            20.3.1.4. Key Financials

            20.3.1.5. SWOT Analysis

            20.3.1.6. Key Developments

            20.3.1.7. Strategy Overview

                20.3.1.7.1. Marketing Strategy

                20.3.1.7.2. Product Type Strategy

                20.3.1.7.3. Channel Strategy

        20.3.2. Cipla Inc.

            20.3.2.1. Overview

            20.3.2.2. Drug Type Portfolio

            20.3.2.3. Sales Footprint

            20.3.2.4. Key Financials

            20.3.2.5. SWOT Analysis

            20.3.2.6. Key Developments

            20.3.2.7. Strategy Overview

                20.3.2.7.1. Marketing Strategy

                20.3.2.7.2. Product Type Strategy

                20.3.2.7.3. Channel Strategy

        20.3.3. Akorn Operating Company LLC

            20.3.3.1. Overview

            20.3.3.2. Drug Type Portfolio

            20.3.3.3. Sales Footprint

            20.3.3.4. Key Financials

            20.3.3.5. SWOT Analysis

            20.3.3.6. Key Developments

            20.3.3.7. Strategy Overview

                20.3.3.7.1. Marketing Strategy

                20.3.3.7.2. Product Type Strategy

                20.3.3.7.3. Channel Strategy

        20.3.4. AbbVie

            20.3.4.1. Overview

            20.3.4.2. Drug Type Portfolio

            20.3.4.3. Sales Footprint

            20.3.4.4. Key Financials

            20.3.4.5. SWOT Analysis

            20.3.4.6. Key Developments

            20.3.4.7. Strategy Overview

                20.3.4.7.1. Marketing Strategy

                20.3.4.7.2. Product Type Strategy

                20.3.4.7.3. Channel Strategy

        20.3.5. Bausch & Lomb Incorporated

            20.3.5.1. Overview

            20.3.5.2. Drug Type Portfolio

            20.3.5.3. Sales Footprint

            20.3.5.4. Key Financials

            20.3.5.5. SWOT Analysis

            20.3.5.6. Key Developments

            20.3.5.7. Strategy Overview

                20.3.5.7.1. Marketing Strategy

                20.3.5.7.2. Product Type Strategy

                20.3.5.7.3. Channel Strategy

        20.3.6. Inoteck Pharmaceuticals

            20.3.6.1. Overview

            20.3.6.2. Drug Type Portfolio

            20.3.6.3. Sales Footprint

            20.3.6.4. Key Financials

            20.3.6.5. SWOT Analysis

            20.3.6.6. Key Developments

            20.3.6.7. Strategy Overview

                20.3.6.7.1. Marketing Strategy

                20.3.6.7.2. Product Type Strategy

                20.3.6.7.3. Channel Strategy

        20.3.7. Merck & Co. Inc.

            20.3.7.1. Overview

            20.3.7.2. Drug Type Portfolio

            20.3.7.3. Sales Footprint

            20.3.7.4. Key Financials

            20.3.7.5. SWOT Analysis

            20.3.7.6. Key Developments

            20.3.7.7. Strategy Overview

                20.3.7.7.1. Marketing Strategy

                20.3.7.7.2. Product Type Strategy

                20.3.7.7.3. Channel Strategy

        20.3.8. Novartis AG

            20.3.8.1. Overview

            20.3.8.2. Drug Type Portfolio

            20.3.8.3. Sales Footprint

            20.3.8.4. Key Financials

            20.3.8.5. SWOT Analysis

            20.3.8.6. Key Developments

            20.3.8.7. Strategy Overview

                20.3.8.7.1. Marketing Strategy

                20.3.8.7.2. Product Type Strategy

                20.3.8.7.3. Channel Strategy

        20.3.9. Pfizer Inc.

            20.3.9.1. Overview

            20.3.9.2. Drug Type Portfolio

            20.3.9.3. Sales Footprint

            20.3.9.4. Key Financials

            20.3.9.5. SWOT Analysis

            20.3.9.6. Key Developments

            20.3.9.7. Strategy Overview

                20.3.9.7.1. Marketing Strategy

                20.3.9.7.2. Product Type Strategy

                20.3.9.7.3. Channel Strategy

        20.3.10. Santen Pharmaceutical Co. Ltd.

            20.3.10.1. Overview

            20.3.10.2. Drug Type Portfolio

            20.3.10.3. Sales Footprint

            20.3.10.4. Key Financials

            20.3.10.5. SWOT Analysis

            20.3.10.6. Key Developments

            20.3.10.7. Strategy Overview

                20.3.10.7.1. Marketing Strategy

                20.3.10.7.2. Product Type Strategy

                20.3.10.7.3. Channel Strategy

        20.3.11. Teva Pharmaceutical Industries Ltd.

            20.3.11.1. Overview

            20.3.11.2. Drug Type Portfolio

            20.3.11.3. Sales Footprint

            20.3.11.4. Key Financials

            20.3.11.5. SWOT Analysis

            20.3.11.6. Key Developments

            20.3.11.7. Strategy Overview

                20.3.11.7.1. Marketing Strategy

                20.3.11.7.2. Product Type Strategy

                20.3.11.7.3. Channel Strategy

21. Assumptions and Acronyms Used

22. Research Methodology

Don't pay for what you don't need

Customize your report by selecting specific countries or regions and save 30%!

List of Tables

Table 1: Global Market Value (US$ Million) Analysis 2017 to 2022 and Forecast 2023 to 2033 by Disease Type

Table 2: Global Market Value (US$ Million) Analysis 2017 to 2022 and Forecast 2023 to 2033 by Drug Class

Table 3: Global Market Value (US$ Million) Analysis 2017 to 2022 and Forecast 2023 to 2033 by Distribution Channel

Table 4: Global Market Analysis 2017 to 2022 and Forecast 2023 to 2033, by Region

Table 5: North America Market Value (US$ Million) Analysis 2017 to 2022 and Forecast 2023 to 2033 by Country

Table 6: North America Market Value (US$ Million) Analysis 2017 to 2022 and Forecast 2023 to 2033 by Disease Type

Table 7: North America Market Value (US$ Million) Analysis 2017 to 2022 and Forecast 2023 to 2033 by Drug Class

Table 8: North America Market Value (US$ Million) Analysis 2017 to 2022 and Forecast 2023 to 2033 by Distribution Channel

Table 9: Latin America Market Value (US$ Million) Analysis 2017 to 2022 and Forecast 2023 to 2033 by Country

Table 10: Latin America Market Value (US$ Million) Analysis 2017 to 2022 and Forecast 2023 to 2033 by Disease Type

Table 11: Latin America Market Value (US$ Million) Analysis 2017 to 2022 and Forecast 2023 to 2033 by Drug Class

Table 12: Latin America Market Value (US$ Million) Analysis 2017 to 2022 and Forecast 2023 to 2033 by Distribution Channel

Table 13: Europe Market Value (US$ Million) Analysis 2017 to 2022 and Forecast 2023 to 2033 by Country

Table 14: Europe Market Value (US$ Million) Analysis 2017 to 2022 and Forecast 2023 to 2033 by Disease Type

Table 15: Europe Market Value (US$ Million) Analysis 2017 to 2022 and Forecast 2023 to 2033 by Drug Class

Table 16: Europe Market Value (US$ Million) Analysis 2017 to 2022 and Forecast 2023 to 2033 by Distribution Channel

Table 17: East Asia Market Value (US$ Million) Analysis 2017 to 2022 and Forecast 2023 to 2033 by Country

Table 18: East Asia Market Value (US$ Million) Analysis 2017 to 2022 and Forecast 2023 to 2033 by Disease Type

Table 19: East Asia Market Value (US$ Million) Analysis 2017 to 2022 and Forecast 2023 to 2033 by Drug Class

Table 20: East Asia Market Value (US$ Million) Analysis 2017 to 2022 and Forecast 2023 to 2033 by Distribution Channel

Table 21: South Asia Market Value (US$ Million) Analysis 2017 to 2022 and Forecast 2023 to 2033 by Country

Table 22: South Asia Market Value (US$ Million) Analysis 2017 to 2022 and Forecast 2023 to 2033 by Disease Type

Table 23: South Asia Market Value (US$ Million) Analysis 2017 to 2022 and Forecast 2023 to 2033 by Drug Class

Table 24: South Asia Market Value (US$ Million) Analysis 2017 to 2022 and Forecast 2023 to 2033 by Distribution Channel

Table 25: Oceania Market Value (US$ Million) Analysis 2017 to 2022 and Forecast 2023 to 2033 by Country

Table 26: Oceania Market Value (US$ Million) Analysis 2017 to 2022 and Forecast 2023 to 2033 by Disease Type

Table 27: Oceania Market Value (US$ Million) Analysis 2017 to 2022 and Forecast 2023 to 2033 by Drug Class

Table 28: Oceania Market Value (US$ Million) Analysis 2017 to 2022 and Forecast 2023 to 2033 by Distribution Channel

Table 29: Middle East & Africa Market Value (US$ Million) Analysis 2017 to 2022 and Forecast 2023 to 2033 by Country

Table 30: Middle East & Africa Market Value (US$ Million) Analysis 2017 to 2022 and Forecast 2023 to 2033 by Disease Type

Table 31: Middle East & Africa Market Value (US$ Million) Analysis 2017 to 2022 and Forecast 2023 to 2033 by Drug Class

Table 32: Middle East & Africa Market Value (US$ Million) Analysis 2017 to 2022 and Forecast 2023 to 2033 by Distribution Channel
Sabyasachi Ghosh
Sabyasachi Ghosh

Principal Consultant

Talk to Analyst

Find your sweet spots for generating winning opportunities in this market.

List of Charts

Figure 01: Global Market Value (US$ Million) Analysis, 2017 to 2022

Figure 02: Global Market Forecast & Y-o-Y Growth, 2023 to 2033

Figure 03: Global Market Absolute $ Opportunity (US$ Million) Analysis, 2022 to 2033

Figure 04: Global Market Value Share (%) Analysis 2023 and 2033, by Disease Type

Figure 05: Global Market Y-o-Y Growth (%) Analysis 2022-2033, by Disease Type

Figure 06: Global Market Attractiveness Analysis 2023 to 2033, by Disease Type

Figure 07: Global Market Value Share (%) Analysis 2023 and 2033, by Drug Class

Figure 08: Global Market Y-o-Y Growth (%) Analysis 2022-2033, by Drug Class

Figure 09: Global Market Attractiveness Analysis 2023 to 2033, by Drug Class

Figure 10: Global Market Value Share (%) Analysis 2023 and 2033, by Distribution Channel

Figure 11: Global Market Y-o-Y Growth (%) Analysis 2022-2033, by Distribution Channel

Figure 12: Global Market Attractiveness Analysis 2023 to 2033, by Distribution Channel

Figure 13: Global Market Value Share (%) Analysis 2023 and 2033, by Region

Figure 14: Global Market Y-o-Y Growth (%) Analysis 2022-2033, by Region

Figure 15: Global Market Attractiveness Analysis 2023 to 2033, by Region

Figure 16: North America Market Value (US$ Million) Analysis, 2017 to 2022

Figure 17: North America Market Value (US$ Million) Forecast, 2023 to 2033

Figure 18: North America Market Value Share, by Disease Type (2023 E)

Figure 19: North America Market Value Share, by Drug Class (2023 E)

Figure 20: North America Market Value Share, by Distribution Channel (2023 E)

Figure 21: North America Market Value Share, by Country (2023 E)

Figure 22: North America Market Attractiveness Analysis by Disease Type, 2023 to 2033

Figure 23: North America Market Attractiveness Analysis by Drug Class, 2023 to 2033

Figure 24: North America Market Attractiveness Analysis by Distribution Channel, 2023 to 2033

Figure 25: North America Market Attractiveness Analysis by Country, 2023 to 2033

Figure 26: USA Market Value Proportion Analysis, 2022

Figure 27: Global Vs. USA Growth Comparison

Figure 28: USA Market Share Analysis (%) by Disease Type, 2022 & 2033

Figure 29: USA Market Share Analysis (%) by Drug Class, 2022 & 2033

Figure 30: USA Market Share Analysis (%) by Distribution Channel, 2022 & 2033

Figure 31: Canada Market Value Proportion Analysis, 2022

Figure 32: Global Vs. Canada. Growth Comparison

Figure 33: Canada Market Share Analysis (%) by Disease Type, 2022 & 2033

Figure 34: Canada Market Share Analysis (%) by Drug Class, 2022 & 2033

Figure 35: Canada Market Share Analysis (%) by Distribution Channel, 2022 & 2033

Figure 36: Latin America Market Value (US$ Million) Analysis, 2017 to 2022

Figure 37: Latin America Market Value (US$ Million) Forecast, 2023 to 2033

Figure 38: Latin America Market Value Share, by Disease Type (2023 E)

Figure 39: Latin America Market Value Share, by Drug Class (2023 E)

Figure 40: Latin America Market Value Share, by Distribution Channel (2023 E)

Figure 41: Latin America Market Value Share, by Country (2023 E)

Figure 42: Latin America Market Attractiveness Analysis by Disease Type, 2023 to 2033

Figure 43: Latin America Market Attractiveness Analysis by Drug Class, 2023 to 2033

Figure 44: Latin America Market Attractiveness Analysis by Distribution Channel, 2023 to 2033

Figure 45: Latin America Market Attractiveness Analysis by Country, 2023 to 2033

Figure 46: Mexico Market Value Proportion Analysis, 2022

Figure 47: Global Vs Mexico Growth Comparison

Figure 48: Mexico Market Share Analysis (%) by Disease Type, 2022 & 2033

Figure 49: Mexico Market Share Analysis (%) by Drug Class, 2022 & 2033

Figure 50: Mexico Market Share Analysis (%) by Distribution Channel, 2022 & 2033

Figure 51: Brazil Market Value Proportion Analysis, 2022

Figure 52: Global Vs. Brazil. Growth Comparison

Figure 53: Brazil Market Share Analysis (%) by Disease Type, 2022 & 2033

Figure 54: Brazil Market Share Analysis (%) by Drug Class, 2022 & 2033

Figure 55: Brazil Market Share Analysis (%) by Distribution Channel, 2022 & 2033

Figure 56: Argentina Market Value Proportion Analysis, 2022

Figure 57: Global Vs Argentina Growth Comparison

Figure 58: Argentina Market Share Analysis (%) by Disease Type, 2022 & 2033

Figure 59: Argentina Market Share Analysis (%) by Drug Class, 2022 & 2033

Figure 60: Argentina Market Share Analysis (%) by Distribution Channel, 2022 & 2033

Figure 61: Europe Market Value (US$ Million) Analysis, 2017 to 2022

Figure 62: Europe Market Value (US$ Million) Forecast, 2023 to 2033

Figure 63: Europe Market Value Share, by Disease Type (2023 E)

Figure 64: Europe Market Value Share, by Drug Class (2023 E)

Figure 65: Europe Market Value Share, by Distribution Channel (2023 E)

Figure 66: Europe Market Value Share, by Country (2023 E)

Figure 67: Europe Market Attractiveness Analysis by Disease Type, 2023 to 2033

Figure 68: Europe Market Attractiveness Analysis by Drug Class, 2023 to 2033

Figure 69: Europe Market Attractiveness Analysis by Distribution Channel, 2023 to 2033

Figure 70: Europe Market Attractiveness Analysis by Country, 2023 to 2033

Figure 71: United Kingdom Market Value Proportion Analysis, 2022

Figure 72: Global Vs. United Kingdom Growth Comparison

Figure 73: United Kingdom Market Share Analysis (%) by Disease Type, 2022 & 2033

Figure 74: United Kingdom Market Share Analysis (%) by Drug Class, 2022 & 2033

Figure 75: United Kingdom Market Share Analysis (%) by Distribution Channel, 2022 & 2033

Figure 76: Germany Market Value Proportion Analysis, 2022

Figure 77: Global Vs. Germany Growth Comparison

Figure 78: Germany Market Share Analysis (%) by Disease Type, 2022 & 2033

Figure 79: Germany Market Share Analysis (%) by Drug Class, 2022 & 2033

Figure 80: Germany Market Share Analysis (%) by Distribution Channel, 2022 & 2033

Figure 81: Italy Market Value Proportion Analysis, 2022

Figure 82: Global Vs. Italy Growth Comparison

Figure 83: Italy Market Share Analysis (%) by Disease Type, 2022 & 2033

Figure 84: Italy Market Share Analysis (%) by Drug Class, 2022 & 2033

Figure 85: Italy Market Share Analysis (%) by Distribution Channel, 2022 & 2033

Figure 86: France Market Value Proportion Analysis, 2022

Figure 87: Global Vs France Growth Comparison

Figure 88: France Market Share Analysis (%) by Disease Type, 2022 & 2033

Figure 89: France Market Share Analysis (%) by Drug Class, 2022 & 2033

Figure 90: France Market Share Analysis (%) by Distribution Channel, 2022 & 2033

Figure 91: Spain Market Value Proportion Analysis, 2022

Figure 92: Global Vs Spain Growth Comparison

Figure 93: Spain Market Share Analysis (%) by Disease Type, 2022 & 2033

Figure 94: Spain Market Share Analysis (%) by Drug Class, 2022 & 2033

Figure 95: Spain Market Share Analysis (%) by Distribution Channel, 2022 & 2033

Figure 96: Russia Market Value Proportion Analysis, 2022

Figure 97: Global Vs Russia Growth Comparison

Figure 98: Russia Market Share Analysis (%) by Disease Type, 2022 & 2033

Figure 99: Russia Market Share Analysis (%) by Drug Class, 2022 & 2033

Figure 100: Russia Market Share Analysis (%) by Distribution Channel, 2022 & 2033

Figure 101: BENELUX Market Value Proportion Analysis, 2022

Figure 102: Global Vs BENELUX Growth Comparison

Figure 103: BENELUX Market Share Analysis (%) by Disease Type, 2022 & 2033

Figure 104: BENELUX Market Share Analysis (%) by Drug Class, 2022 & 2033

Figure 105: BENELUX Market Share Analysis (%) by Distribution Channel, 2022 & 2033

Figure 106: East Asia Market Value (US$ Million) Analysis, 2017 to 2022

Figure 107: East Asia Market Value (US$ Million) Forecast, 2023 to 2033

Figure 108: East Asia Market Value Share, by Disease Type (2023 E)

Figure 109: East Asia Market Value Share, by Drug Class (2023 E)

Figure 110: East Asia Market Value Share, by Distribution Channel (2023 E)

Figure 111: East Asia Market Value Share, by Country (2023 E)

Figure 112: East Asia Market Attractiveness Analysis by Disease Type, 2023 to 2033

Figure 113: East Asia Market Attractiveness Analysis by Drug Class, 2023 to 2033

Figure 114: East Asia Market Attractiveness Analysis by Distribution Channel, 2023 to 2033

Figure 115: East Asia Market Attractiveness Analysis by Country, 2023 to 2033

Figure 116: China Market Value Proportion Analysis, 2022

Figure 117: Global Vs. China Growth Comparison

Figure 118: China Market Share Analysis (%) by Disease Type, 2022 & 2033

Figure 119: China Market Share Analysis (%) by Drug Class, 2022 & 2033

Figure 120: China Market Share Analysis (%) by Distribution Channel, 2022 & 2033

Figure 121: Japan Market Value Proportion Analysis, 2022

Figure 122: Global Vs. Japan Growth Comparison

Figure 123: Japan Market Share Analysis (%) by Disease Type, 2022 & 2033

Figure 124: Japan Market Share Analysis (%) by Drug Class, 2022 & 2033

Figure 125: Japan Market Share Analysis (%) by Distribution Channel, 2022 & 2033

Figure 126: South Korea Market Value Proportion Analysis, 2022

Figure 127: Global Vs South Korea Growth Comparison

Figure 128: South Korea Market Share Analysis (%) by Disease Type, 2022 & 2033

Figure 129: South Korea Market Share Analysis (%) by Drug Class, 2022 & 2033

Figure 130: South Korea Market Share Analysis (%) by Distribution Channel, 2022 & 2033

Figure 131: South Asia Market Value (US$ Million) Analysis, 2017 to 2022

Figure 132: South Asia Market Value (US$ Million) Forecast, 2023 to 2033

Figure 133: South Asia Market Value Share, by Disease Type (2023 E)

Figure 134: South Asia Market Value Share, by Drug Class (2023 E)

Figure 135: South Asia Market Value Share, by Distribution Channel (2023 E)

Figure 136: South Asia Market Value Share, by Country (2023 E)

Figure 137: South Asia Market Attractiveness Analysis by Disease Type, 2023 to 2033

Figure 138: South Asia Market Attractiveness Analysis by Drug Class, 2023 to 2033

Figure 139: South Asia Market Attractiveness Analysis by Distribution Channel, 2023 to 2033

Figure 140: South Asia Market Attractiveness Analysis by Country, 2023 to 2033

Figure 141: India Market Value Proportion Analysis, 2022

Figure 142: Global Vs. India Growth Comparison

Figure 143: India Market Share Analysis (%) by Disease Type, 2022 & 2033

Figure 144: India Market Share Analysis (%) by Drug Class, 2022 & 2033

Figure 145: India Market Share Analysis (%) by Distribution Channel, 2022 & 2033

Figure 146: Indonesia Market Value Proportion Analysis, 2022

Figure 147: Global Vs. Indonesia Growth Comparison

Figure 148: Indonesia Market Share Analysis (%) by Disease Type, 2022 & 2033

Figure 149: Indonesia Market Share Analysis (%) by Drug Class, 2022 & 2033

Figure 150: Indonesia Market Share Analysis (%) by Distribution Channel, 2022 & 2033

Figure 151: Malaysia Market Value Proportion Analysis, 2022

Figure 152: Global Vs. Malaysia Growth Comparison

Figure 153: Malaysia Market Share Analysis (%) by Disease Type, 2022 & 2033

Figure 154: Malaysia Market Share Analysis (%) by Drug Class, 2022 & 2033

Figure 155: Malaysia Market Share Analysis (%) by Distribution Channel, 2022 & 2033

Figure 156: Thailand Market Value Proportion Analysis, 2022

Figure 157: Global Vs. Thailand Growth Comparison

Figure 158: Thailand Market Share Analysis (%) by Disease Type, 2022 & 2033

Figure 159: Thailand Market Share Analysis (%) by Drug Class, 2022 & 2033

Figure 160: Thailand Market Share Analysis (%) by Distribution Channel, 2022 & 2033

Figure 161: Oceania Market Value (US$ Million) Analysis, 2017 to 2022

Figure 162: Oceania Market Value (US$ Million) Forecast, 2023 to 2033

Figure 163: Oceania Market Value Share, by Disease Type (2023 E)

Figure 164: Oceania Market Value Share, by Drug Class (2023 E)

Figure 165: Oceania Market Value Share, by Distribution Channel (2023 E)

Figure 166: Oceania Market Value Share, by Country (2023 E)

Figure 167: Oceania Market Attractiveness Analysis by Disease Type, 2023 to 2033

Figure 168: Oceania Market Attractiveness Analysis by Drug Class, 2023 to 2033

Figure 169: Oceania Market Attractiveness Analysis by Distribution Channel, 2023 to 2033

Figure 170: Oceania Market Attractiveness Analysis by Country, 2023 to 2033

Figure 171: Australia Market Value Proportion Analysis, 2022

Figure 172: Global Vs. Australia Growth Comparison

Figure 173: Australia Market Share Analysis (%) by Disease Type, 2022 & 2033

Figure 174: Australia Market Share Analysis (%) by Drug Class, 2022 & 2033

Figure 175: Australia Market Share Analysis (%) by Distribution Channel, 2022 & 2033

Figure 176: New Zealand Market Value Proportion Analysis, 2022

Figure 177: Global Vs New Zealand Growth Comparison

Figure 178: New Zealand Market Share Analysis (%) by Disease Type, 2022 & 2033

Figure 179: New Zealand Market Share Analysis (%) by Drug Class, 2022 & 2033

Figure 180: New Zealand Market Share Analysis (%) by Distribution Channel, 2022 & 2033

Figure 181: Middle East & Africa Market Value (US$ Million) Analysis, 2017 to 2022

Figure 182: Middle East & Africa Market Value (US$ Million) Forecast, 2023 to 2033

Figure 183: Middle East & Africa Market Value Share, by Disease Type (2023 E)

Figure 184: Middle East & Africa Market Value Share, by Drug Class (2023 E)

Figure 185: Middle East & Africa Market Value Share, by Distribution Channel (2023 E)

Figure 186: Middle East & Africa Market Value Share, by Country (2023 E)

Figure 187: Middle East & Africa Market Attractiveness Analysis by Disease Type, 2023 to 2033

Figure 188: Middle East & Africa Market Attractiveness Analysis by Drug Class 2023 to 2033

Figure 189: Middle East & Africa Market Attractiveness Analysis by Distribution Channel 2023 to 2033

Figure 190: Middle East & Africa Market Attractiveness Analysis by Country, 2023 to 2033

Figure 191: GCC Countries Market Value Proportion Analysis, 2022

Figure 192: Global Vs GCC Countries Growth Comparison

Figure 193: GCC Countries Market Share Analysis (%) by Disease Type, 2022 & 2033

Figure 194: GCC Countries Market Share Analysis (%) by Drug Class, 2022 & 2033

Figure 195: GCC Countries Market Share Analysis (%) by Distribution Channel, 2022 & 2033

Figure 196: Türkiye Market Value Proportion Analysis, 2022

Figure 197: Global Vs. Türkiye Growth Comparison

Figure 198: Türkiye Market Share Analysis (%) by Disease Type, 2022 & 2033

Figure 199: Türkiye Market Share Analysis (%) by Drug Class, 2022 & 2033

Figure 200: Türkiye Market Share Analysis (%) by Distribution Channel, 2022 & 2033

Figure 201: South Africa Market Value Proportion Analysis, 2022

Figure 202: Global Vs. South Africa Growth Comparison

Figure 203: South Africa Market Share Analysis (%) by Disease Type, 2022 & 2033

Figure 204: South Africa Market Share Analysis (%) by Drug Class, 2022 & 2033

Figure 205: South Africa Market Share Analysis (%) by Distribution Channel, 2022 & 2033

Figure 206: North Africa Market Value Proportion Analysis, 2022

Figure 207: Global Vs North Africa Growth Comparison

Figure 208: North Africa Market Share Analysis (%) by Disease Type, 2022 & 2033

Figure 209: North Africa Market Share Analysis (%) by Drug Class, 2022 & 2033

Figure 210: North Africa Market Share Analysis (%) by Distribution Channel, 2022 & 2033

Recommendations

Healthcare

Glaucoma Therapeutics Market

Published : October 2022

Healthcare

Eye Infections Treatment Market

Published : July 2022

Healthcare

Cataract Surgery Devices Market

Published : June 2022

Explore Healthcare Insights

View Reports

Glaucoma Treatment Market