Asthma Treatment Market Size and Forecast Outlook (2024 to 2034)

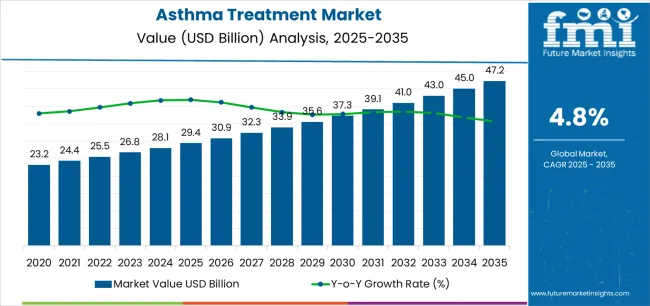
Future Market Insights (FMI)’ updated report on the asthma treatment market highlights several opportunities and growth prospects for the coming decade. As per the report, the asthma treatment market is set to surge from USD 28.0 billion in 2024 and USD 46.0 billion by 2034. The report reflects a robust CAGR of 5.1% between 2024 and 2034, inferring strong market growth.

Attributes Key Insights
Global Asthma Treatment Market Size (2024E) USD 28.0 billion
Market Value (2034F) USD 46.0 billion
Value-based CAGR (2024 to 2034) 5.1%

Prevalence of Asthma Driving Growth in the Global Asthma Treatment Market

The increasing incidence of asthma, growing knowledge about asthma medications, and advancements in asthma treatment choices are projected to spur market growth. The industry is further propelled by environmental factors such as air pollution, allergens, and lifestyle changes, which contribute to the surged prevalence of asthma worldwide.

Precision medicine is gaining traction in the asthma treatment industry as demand for individualized asthma medications increases. Mobile applications, smart inhalers, and wearable devices are improving tailored asthma therapy by allowing for real-time monitoring of symptoms, medication adherence, and lung function.

This accurate data gathering helps healthcare practitioners and professionals to understand each patient's asthma management better and offer appropriate treatment solutions.

Remote monitoring and telemedicine services are further estimated to enhance personalized treatment for patients in remote and underdeveloped areas. Pharmaceutical companies and research organizations are investing in innovating new drugs and therapies to meet the diverse needs of asthma patients globally.

Public health initiatives and awareness campaigns are further boosting market development. Urbanization, industrialization, genetic susceptibility, and family history of asthma are set to contribute to mounting asthma prevalence, creating an environment favorable for market growth.

Sales Analysis of Asthma Treatments (2019 to 2023) vs Demand Forecast (2024 to 2034)

From 2019 to 2023, bronchodilators such as theophylline and beta-agonists were primarily considered as asthma treatments, providing relief from symptoms. During 2019 and 2023, the market grew at a CAGR of 6.8%. Development in genetics and biomarker research has enabled personalized asthma treatment, optimizing its efficacy and minimizing side effects.

Digital health technologies, such as asthma management mobile apps, smart inhalers, and telemedicine services, further enabled better monitoring of asthma symptoms, medication adherence, and remote patient management.

Key Trends Shaping Innovation in Asthma Treatment Options

Smart inhalers, smartphone applications, and telemedicine are improving asthma therapy by allowing for remote monitoring, medication adherence, and increased patient awareness and education. Preventive methods, such as environmental trigger reduction and lifestyle modifications aimed at reducing exacerbations and improving long-term treatment results, are set to fuel the market development.

Combination inhalers with bronchodilators and corticosteroids are gaining traction in asthma management due to their ease of use and improved patient outcomes. Healthcare policies, reimbursement structures, and value-based care initiatives are set to fuel asthma treatment adoption globally.

Leading companies and producers are focusing on developing novel therapeutic targets, drug delivery systems, and alternative treatments, propelling market development. The shift toward patient-centric care models, self-management education, and empowerment is gaining momentum in several emerging markets.

Country-wise Insights into Asthma Treatment Access and Prevalence

The section below highlights the projected growth rates of leading countries. Among these, South Korea is set to remain a highly lucrative market, exhibiting a CAGR of 7.2%. Japan and the United Kingdom are estimated to follow with CAGRs of 6.8% and 6.3%, respectively.

Countries Projected CAGR (2024 to 2034)
United States 5.4%
United Kingdom 6.3%
China 5.9%
South Korea 7.2%
Japan 6.8%

The asthma treatment industry can be observed in the subsequent tables, which focus on the leading economies, consisting of South Korea, Japan, the United Kingdom, China, and the United States. A comprehensive evaluation demonstrates that the United States has enormous potential for growth in the market.

Countries Market Values (2034)
United States USD 8.3 billion
United Kingdom USD 1.9 billion
China USD 7.3 billion
South Korea USD 3.0 billion
Japan USD 5.2 billion

Rising Consumer Awareness to Boost Asthma Treatment Demand in the United States

The United States is set to dominate the market by 2034, surging at a CAGR of 5.4%. Asthma, a common non-communicable disease in the United States, accounts for around 73% of outpatient clinic visits, creating a wide target population for effective asthma therapeutics.

Established healthcare infrastructure and increasing asthma prevalence in the United States are the key factors propelling market growth. The United States is further projected to grow significantly due to improved government reforms, a rising geriatric population, increasing healthcare expenditure, and growing consumer awareness about lung diseases.

Growing Research and Development Activities Propelling Demand in China

By 2034, China is projected to grow substantially at a CAGR of 5.9%. Government initiatives, subsidies, and reimbursement policies to improve treatment quality, promote evidence-based practices, and reduce healthcare inconsistencies are influencing asthma therapy adoption in China.

Leading companies in China are focusing on research & development to innovate new therapeutic treatments, improve drug delivery systems, and understand asthma pathophysiology to reach wider customers.

The competitive asthma care market in China encourages innovation through collaborations and partnerships between industry stakeholders, academia, and patient advocacy groups.

Improvements in Treatment Options Spurring Growth in Japan

Japan is projected to propel due to factors such as high asthma prevalence, increased consumer awareness, and innovations in treatment options. Developments in biologic medications and targeted therapies, which offer improved efficacy and fewer side effects, are estimated to fuel growth in the market.

The market in Japan is further anticipated to be influenced by increased FDA endorsements and key market strategies such as collaboration, mergers, and partnerships among local and international companies. The market's development is projected to be accelerated by key players intensifying their geographical presence in emerging nations. By 2034, Japan is projected to reach USD 5.2 billion.

Leading Pharmaceutical Companies in South Korea Paving the Road for Success

South Korea is home to several leading pharmaceutical companies specializing in asthma treatment, medication development, and manufacturing. These companies contribute to innovative asthma management therapies, propelling market growth in South Korea. South Korea is projected to reach a market valuation of USD 3.0 billion in 2034.

South Korea's regulatory framework and favorable government reimbursement system encourage asthma treatment adoption, providing patients with a wide range of treatment options and fueling market reach.

South Korea is a leading center for asthma research and clinical trials, involving academic institutions, research centers, and healthcare organizations to develop new treatment methods.

Asthma Treatment Market by Drug Class, Delivery Method, Patient Age Group, and Region

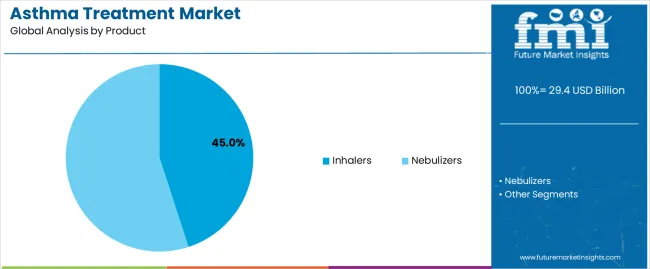
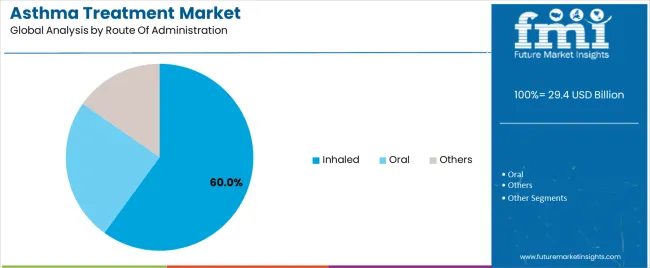
The segmented market analysis is included in the subsequent section. Based on comprehensive studies, the inhaler segment is dominating the product category. Likewise, the oral segment is commanding the route of administration category.

Segment Value CAGR (2024 to 2034)
Inhalers (Product) 4.8%
Oral (Route of Administration) 4.6%

Inhaler Segment Tops the Product Form Category

The inhalers segment, with its reliability, versatility, portability, and cost-effectiveness, is projected to lead the product segment by 2034. The growing prevalence of asthma and COPD, along with the need for emergency treatment alternatives, is propelling the segment’s growth.

The development of progressive products, such as Trelegy Ellipta, a triple therapy inhaler approved in the United States, is also projected to fuel segment growth. Based on product, the inhaler segment is set to surge at a CAGR of 4.8% by 2034.

Demand for Oral Route of Administration to Remain High Through 2034

Based on the route of administration, the oral segment is set to rise at 4.6% CAGR by 2034. The segment is projected to witness a leading growth rate from 2024 to 2034 due to its convenience and efficacy.

Oral medications, taken by mouth and absorbed through the digestive system, are well-preferred and easy to use, making them popular among patients and healthcare providers. The convenience, effectiveness, and versatility of the oral route of administration make the segment a valuable tool for managing asthma, boosting the segment's growth.
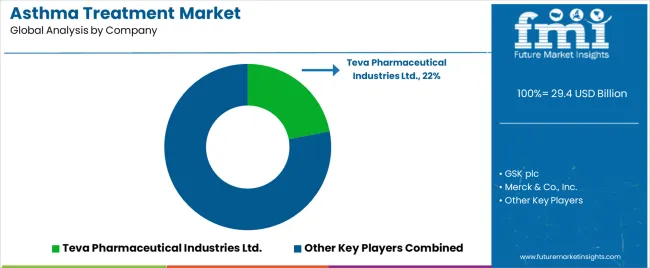
Competitive Landscape of the Global Asthma Treatment Industry

Leading pharmaceutical companies are inclined toward research & development to surge their market reach while emerging biotech companies innovate targeted treatments to uphold their positions. Market growth relies on regulatory adherence, diagnostic research, strategic partnerships, and adapting to evolving consumer tastes.

For instance

  • In July 2023, Teva Pharmaceuticals, headquartered in Israel, partnered with Alvotech, enabling Teva to commercialize new biosimilars in the United States.
  • In March 2023, Teva Pharmaceuticals, headquartered in Israel, collaborated with Rimidi to start a respiratory patient monitoring program at Desert Oasis Healthcare in California, utilizing data from Teva's Digihaler System.
  • In August 2023, Areteia Therapeutics, a United States-based company, announced Phase 2 EXHALE-1 study results.
  • In October 2022, CHIESI USA, headquartered in the United States, partnered with Aptar Digital Health to develop a disease management platform for asthma and COPD patients, focusing on improving their quality of life and pushing demand for treatments.

Key Companies Leading the Asthma Treatment Sector

  • Teva Pharmaceutical Industries Ltd.
  • GSK plc
  • Merck & Co., Inc.
  • F. Hoffmann-La Roche Ltd.
  • AstraZeneca
  • Boehringer Ingelheim International GmbH
  • Sanofi.
  • Koninklijke Philips N.V.
  • BD
  • Covis Pharma

Coverage Scope in the Global Asthma Treatment Market Report

  • Asthma Drug and Pediatric Asthma Treatment Industry Size
  • Competitive Landscape in the Respiratory Therapeutic Market
  • Market Segmentation of Asthma Drugs
  • Industry Growth Factors for Respiratory Medicines
  • Asthma Prevalence and Market Outlook
  • Emerging Opportunities in the Asthma Management Sector
  • Respiratory Healthcare Industry Analysis
  • Asthma Medication Market Demand
  • Market Dynamics Influencing Patient Adherence and Healthcare Provider Preferences in Asthma Management
  • Analysis of Key Players and their Pipeline Products in the Asthma Treatment Industry
  • Evaluation of Healthcare Policies and Reimbursement Frameworks Affecting Asthma Medication Accessibility
  • Technological Developments and Innovations Fueling Personalized Asthma Therapy Approaches
  • Market Research on Pricing Strategies and Cost-effectiveness of Asthma Medications
  • Market Analysis of Asthma Treatment Options and Their Efficacy in Controlling Symptoms
  • Market Forecast for Asthma Care Products by Type, Delivery Method, and Region
  • Impact of Environmental Factors and Pollution on Asthma Prevalence and Treatment Market Growth

Segmentation of the Asthma Treatment Market by Therapeutic Category, Dosage Form, and Distribution Channel

By Drug Class:

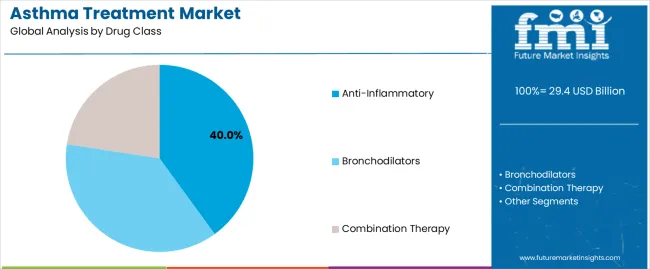
  • Anti-inflammatory
  • Bronchodilators
  • Combination Therapy

By Product:

  • Inhalers
    • Dry Powder
    • Metered Dose
    • Soft Mist
  • Nebulizers

By Route of Administration:

  • Oral
  • Inhaled
  • Others

By Region:

  • North America
  • Latin America
  • Europe
  • East Asia
  • South Asia
  • Oceania
  • Middle East and Africa

Table of Content

  • 1. Executive Summary
  • 2. Market Overview
  • 3. Market Background
  • 4. Global Market Analysis 2019 to 2023 and Forecast, 2024 to 2034
  • 5. Global Market Analysis 2019 to 2023 and Forecast 2024 to 2034, By Drug Class
    • 5.1. Anti-inflammatory
    • 5.2. Bronchodilators
    • 5.3. Combination Therapy
  • 6. Global Market Analysis 2019 to 2023 and Forecast 2024 to 2034, By Product
    • 6.1. Inhalers
      • 6.1.1. Dry Powder
      • 6.1.2. Metered Dose
      • 6.1.3. Soft Mist
    • 6.2. Nebulizers
  • 7. Global Market Analysis 2019 to 2023 and Forecast 2024 to 2034, By Route of Administration
    • 7.1. Oral
    • 7.2. Inhaled
    • 7.3. Others
  • 8. Global Market Analysis 2019 to 2023 and Forecast 2024 to 2034, By Region
    • 8.1. North America
    • 8.2. Latin America
    • 8.3. Western Europe
    • 8.4. Eastern Europe
    • 8.5. South Asia and Pacific
    • 8.6. East Asia
    • 8.7. Middle East and Africa
  • 9. North America Market Analysis 2019 to 2023 and Forecast 2024 to 2034, By Country
  • 10. Latin America Market Analysis 2019 to 2023 and Forecast 2024 to 2034, By Country
  • 11. Western Europe Market Analysis 2019 to 2023 and Forecast 2024 to 2034, By Country
  • 12. Eastern Europe Market Analysis 2019 to 2023 and Forecast 2024 to 2034, By Country
  • 13. South Asia and Pacific Market Analysis 2019 to 2023 and Forecast 2024 to 2034, By Country
  • 14. East Asia Market Analysis 2019 to 2023 and Forecast 2024 to 2034, By Country
  • 15. Middle East and Africa Market Analysis 2019 to 2023 and Forecast 2024 to 2034, By Country
  • 16. Key Countries Market Analysis
  • 17. Market Structure Analysis
  • 18. Competition Analysis
    • 18.1. Teva Pharmaceutical Industries Ltd.
    • 18.2. GSK plc
    • 18.3. Merck & Co., Inc.
    • 18.4. F. Hoffmann-La Roche Ltd
    • 18.5. AstraZeneca
    • 18.6. Boehringer Ingelheim International GmbH
    • 18.7. Sanofi
    • 18.8. Koninklijke Philips N.V.
    • 18.9. BD
    • 18.10. Covis Pharma
  • 19. Assumptions & Acronyms Used
  • 20. Research Methodology

List of Tables

Table 1: Global Market Value (US$ million) Forecast by Region, 2019 to 2034

Table 2: Global Market Volume (Units) Forecast by Region, 2019 to 2034

Table 3: Global Market Value (US$ million) Forecast by Drug Class, 2019 to 2034

Table 4: Global Market Volume (Units) Forecast by Drug Class, 2019 to 2034

Table 5: Global Market Value (US$ million) Forecast by Product, 2019 to 2034

Table 6: Global Market Volume (Units) Forecast by Product, 2019 to 2034

Table 7: Global Market Value (US$ million) Forecast by Route of Administration, 2019 to 2034

Table 8: Global Market Volume (Units) Forecast by Route of Administration, 2019 to 2034

Table 9: North America Market Value (US$ million) Forecast by Country, 2019 to 2034

Table 10: North America Market Volume (Units) Forecast by Country, 2019 to 2034

Table 11: North America Market Value (US$ million) Forecast by Drug Class, 2019 to 2034

Table 12: North America Market Volume (Units) Forecast by Drug Class, 2019 to 2034

Table 13: North America Market Value (US$ million) Forecast by Product, 2019 to 2034

Table 14: North America Market Volume (Units) Forecast by Product, 2019 to 2034

Table 15: North America Market Value (US$ million) Forecast by Route of Administration, 2019 to 2034

Table 16: North America Market Volume (Units) Forecast by Route of Administration, 2019 to 2034

Table 17: Latin America Market Value (US$ million) Forecast by Country, 2019 to 2034

Table 18: Latin America Market Volume (Units) Forecast by Country, 2019 to 2034

Table 19: Latin America Market Value (US$ million) Forecast by Drug Class, 2019 to 2034

Table 20: Latin America Market Volume (Units) Forecast by Drug Class, 2019 to 2034

Table 21: Latin America Market Value (US$ million) Forecast by Product, 2019 to 2034

Table 22: Latin America Market Volume (Units) Forecast by Product, 2019 to 2034

Table 23: Latin America Market Value (US$ million) Forecast by Route of Administration, 2019 to 2034

Table 24: Latin America Market Volume (Units) Forecast by Route of Administration, 2019 to 2034

Table 25: Western Europe Market Value (US$ million) Forecast by Country, 2019 to 2034

Table 26: Western Europe Market Volume (Units) Forecast by Country, 2019 to 2034

Table 27: Western Europe Market Value (US$ million) Forecast by Drug Class, 2019 to 2034

Table 28: Western Europe Market Volume (Units) Forecast by Drug Class, 2019 to 2034

Table 29: Western Europe Market Value (US$ million) Forecast by Product, 2019 to 2034

Table 30: Western Europe Market Volume (Units) Forecast by Product, 2019 to 2034

Table 31: Western Europe Market Value (US$ million) Forecast by Route of Administration, 2019 to 2034

Table 32: Western Europe Market Volume (Units) Forecast by Route of Administration, 2019 to 2034

Table 33: Eastern Europe Market Value (US$ million) Forecast by Country, 2019 to 2034

Table 34: Eastern Europe Market Volume (Units) Forecast by Country, 2019 to 2034

Table 35: Eastern Europe Market Value (US$ million) Forecast by Drug Class, 2019 to 2034

Table 36: Eastern Europe Market Volume (Units) Forecast by Drug Class, 2019 to 2034

Table 37: Eastern Europe Market Value (US$ million) Forecast by Product, 2019 to 2034

Table 38: Eastern Europe Market Volume (Units) Forecast by Product, 2019 to 2034

Table 39: Eastern Europe Market Value (US$ million) Forecast by Route of Administration, 2019 to 2034

Table 40: Eastern Europe Market Volume (Units) Forecast by Route of Administration, 2019 to 2034

Table 41: South Asia and Pacific Market Value (US$ million) Forecast by Country, 2019 to 2034

Table 42: South Asia and Pacific Market Volume (Units) Forecast by Country, 2019 to 2034

Table 43: South Asia and Pacific Market Value (US$ million) Forecast by Drug Class, 2019 to 2034

Table 44: South Asia and Pacific Market Volume (Units) Forecast by Drug Class, 2019 to 2034

Table 45: South Asia and Pacific Market Value (US$ million) Forecast by Product, 2019 to 2034

Table 46: South Asia and Pacific Market Volume (Units) Forecast by Product, 2019 to 2034

Table 47: South Asia and Pacific Market Value (US$ million) Forecast by Route of Administration, 2019 to 2034

Table 48: South Asia and Pacific Market Volume (Units) Forecast by Route of Administration, 2019 to 2034

Table 49: East Asia Market Value (US$ million) Forecast by Country, 2019 to 2034

Table 50: East Asia Market Volume (Units) Forecast by Country, 2019 to 2034

Table 51: East Asia Market Value (US$ million) Forecast by Drug Class, 2019 to 2034

Table 52: East Asia Market Volume (Units) Forecast by Drug Class, 2019 to 2034

Table 53: East Asia Market Value (US$ million) Forecast by Product, 2019 to 2034

Table 54: East Asia Market Volume (Units) Forecast by Product, 2019 to 2034

Table 55: East Asia Market Value (US$ million) Forecast by Route of Administration, 2019 to 2034

Table 56: East Asia Market Volume (Units) Forecast by Route of Administration, 2019 to 2034

Table 57: Middle East and Africa Market Value (US$ million) Forecast by Country, 2019 to 2034

Table 58: Middle East and Africa Market Volume (Units) Forecast by Country, 2019 to 2034

Table 59: Middle East and Africa Market Value (US$ million) Forecast by Drug Class, 2019 to 2034

Table 60: Middle East and Africa Market Volume (Units) Forecast by Drug Class, 2019 to 2034

Table 61: Middle East and Africa Market Value (US$ million) Forecast by Product, 2019 to 2034

Table 62: Middle East and Africa Market Volume (Units) Forecast by Product, 2019 to 2034

Table 63: Middle East and Africa Market Value (US$ million) Forecast by Route of Administration, 2019 to 2034

Table 64: Middle East and Africa Market Volume (Units) Forecast by Route of Administration, 2019 to 2034

List of Figures

Figure 1: Global Market Value (US$ million) by Drug Class, 2024 to 2034

Figure 2: Global Market Value (US$ million) by Product, 2024 to 2034

Figure 3: Global Market Value (US$ million) by Route of Administration, 2024 to 2034

Figure 4: Global Market Value (US$ million) by Region, 2024 to 2034

Figure 5: Global Market Value (US$ million) Analysis by Region, 2019 to 2034

Figure 6: Global Market Volume (Units) Analysis by Region, 2019 to 2034

Figure 7: Global Market Value Share (%) and BPS Analysis by Region, 2024 to 2034

Figure 8: Global Market Y-o-Y Growth (%) Projections by Region, 2024 to 2034

Figure 9: Global Market Value (US$ million) Analysis by Drug Class, 2019 to 2034

Figure 10: Global Market Volume (Units) Analysis by Drug Class, 2019 to 2034

Figure 11: Global Market Value Share (%) and BPS Analysis by Drug Class, 2024 to 2034

Figure 12: Global Market Y-o-Y Growth (%) Projections by Drug Class, 2024 to 2034

Figure 13: Global Market Value (US$ million) Analysis by Product, 2019 to 2034

Figure 14: Global Market Volume (Units) Analysis by Product, 2019 to 2034

Figure 15: Global Market Value Share (%) and BPS Analysis by Product, 2024 to 2034

Figure 16: Global Market Y-o-Y Growth (%) Projections by Product, 2024 to 2034

Figure 17: Global Market Value (US$ million) Analysis by Route of Administration, 2019 to 2034

Figure 18: Global Market Volume (Units) Analysis by Route of Administration, 2019 to 2034

Figure 19: Global Market Value Share (%) and BPS Analysis by Route of Administration, 2024 to 2034

Figure 20: Global Market Y-o-Y Growth (%) Projections by Route of Administration, 2024 to 2034

Figure 21: Global Market Attractiveness by Drug Class, 2024 to 2034

Figure 22: Global Market Attractiveness by Product, 2024 to 2034

Figure 23: Global Market Attractiveness by Route of Administration, 2024 to 2034

Figure 24: Global Market Attractiveness by Region, 2024 to 2034

Figure 25: North America Market Value (US$ million) by Drug Class, 2024 to 2034

Figure 26: North America Market Value (US$ million) by Product, 2024 to 2034

Figure 27: North America Market Value (US$ million) by Route of Administration, 2024 to 2034

Figure 28: North America Market Value (US$ million) by Country, 2024 to 2034

Figure 29: North America Market Value (US$ million) Analysis by Country, 2019 to 2034

Figure 30: North America Market Volume (Units) Analysis by Country, 2019 to 2034

Figure 31: North America Market Value Share (%) and BPS Analysis by Country, 2024 to 2034

Figure 32: North America Market Y-o-Y Growth (%) Projections by Country, 2024 to 2034

Figure 33: North America Market Value (US$ million) Analysis by Drug Class, 2019 to 2034

Figure 34: North America Market Volume (Units) Analysis by Drug Class, 2019 to 2034

Figure 35: North America Market Value Share (%) and BPS Analysis by Drug Class, 2024 to 2034

Figure 36: North America Market Y-o-Y Growth (%) Projections by Drug Class, 2024 to 2034

Figure 37: North America Market Value (US$ million) Analysis by Product, 2019 to 2034

Figure 38: North America Market Volume (Units) Analysis by Product, 2019 to 2034

Figure 39: North America Market Value Share (%) and BPS Analysis by Product, 2024 to 2034

Figure 40: North America Market Y-o-Y Growth (%) Projections by Product, 2024 to 2034

Figure 41: North America Market Value (US$ million) Analysis by Route of Administration, 2019 to 2034

Figure 42: North America Market Volume (Units) Analysis by Route of Administration, 2019 to 2034

Figure 43: North America Market Value Share (%) and BPS Analysis by Route of Administration, 2024 to 2034

Figure 44: North America Market Y-o-Y Growth (%) Projections by Route of Administration, 2024 to 2034

Figure 45: North America Market Attractiveness by Drug Class, 2024 to 2034

Figure 46: North America Market Attractiveness by Product, 2024 to 2034

Figure 47: North America Market Attractiveness by Route of Administration, 2024 to 2034

Figure 48: North America Market Attractiveness by Country, 2024 to 2034

Figure 49: Latin America Market Value (US$ million) by Drug Class, 2024 to 2034

Figure 50: Latin America Market Value (US$ million) by Product, 2024 to 2034

Figure 51: Latin America Market Value (US$ million) by Route of Administration, 2024 to 2034

Figure 52: Latin America Market Value (US$ million) by Country, 2024 to 2034

Figure 53: Latin America Market Value (US$ million) Analysis by Country, 2019 to 2034

Figure 54: Latin America Market Volume (Units) Analysis by Country, 2019 to 2034

Figure 55: Latin America Market Value Share (%) and BPS Analysis by Country, 2024 to 2034

Figure 56: Latin America Market Y-o-Y Growth (%) Projections by Country, 2024 to 2034

Figure 57: Latin America Market Value (US$ million) Analysis by Drug Class, 2019 to 2034

Figure 58: Latin America Market Volume (Units) Analysis by Drug Class, 2019 to 2034

Figure 59: Latin America Market Value Share (%) and BPS Analysis by Drug Class, 2024 to 2034

Figure 60: Latin America Market Y-o-Y Growth (%) Projections by Drug Class, 2024 to 2034

Figure 61: Latin America Market Value (US$ million) Analysis by Product, 2019 to 2034

Figure 62: Latin America Market Volume (Units) Analysis by Product, 2019 to 2034

Figure 63: Latin America Market Value Share (%) and BPS Analysis by Product, 2024 to 2034

Figure 64: Latin America Market Y-o-Y Growth (%) Projections by Product, 2024 to 2034

Figure 65: Latin America Market Value (US$ million) Analysis by Route of Administration, 2019 to 2034

Figure 66: Latin America Market Volume (Units) Analysis by Route of Administration, 2019 to 2034

Figure 67: Latin America Market Value Share (%) and BPS Analysis by Route of Administration, 2024 to 2034

Figure 68: Latin America Market Y-o-Y Growth (%) Projections by Route of Administration, 2024 to 2034

Figure 69: Latin America Market Attractiveness by Drug Class, 2024 to 2034

Figure 70: Latin America Market Attractiveness by Product, 2024 to 2034

Figure 71: Latin America Market Attractiveness by Route of Administration, 2024 to 2034

Figure 72: Latin America Market Attractiveness by Country, 2024 to 2034

Figure 73: Western Europe Market Value (US$ million) by Drug Class, 2024 to 2034

Figure 74: Western Europe Market Value (US$ million) by Product, 2024 to 2034

Figure 75: Western Europe Market Value (US$ million) by Route of Administration, 2024 to 2034

Figure 76: Western Europe Market Value (US$ million) by Country, 2024 to 2034

Figure 77: Western Europe Market Value (US$ million) Analysis by Country, 2019 to 2034

Figure 78: Western Europe Market Volume (Units) Analysis by Country, 2019 to 2034

Figure 79: Western Europe Market Value Share (%) and BPS Analysis by Country, 2024 to 2034

Figure 80: Western Europe Market Y-o-Y Growth (%) Projections by Country, 2024 to 2034

Figure 81: Western Europe Market Value (US$ million) Analysis by Drug Class, 2019 to 2034

Figure 82: Western Europe Market Volume (Units) Analysis by Drug Class, 2019 to 2034

Figure 83: Western Europe Market Value Share (%) and BPS Analysis by Drug Class, 2024 to 2034

Figure 84: Western Europe Market Y-o-Y Growth (%) Projections by Drug Class, 2024 to 2034

Figure 85: Western Europe Market Value (US$ million) Analysis by Product, 2019 to 2034

Figure 86: Western Europe Market Volume (Units) Analysis by Product, 2019 to 2034

Figure 87: Western Europe Market Value Share (%) and BPS Analysis by Product, 2024 to 2034

Figure 88: Western Europe Market Y-o-Y Growth (%) Projections by Product, 2024 to 2034

Figure 89: Western Europe Market Value (US$ million) Analysis by Route of Administration, 2019 to 2034

Figure 90: Western Europe Market Volume (Units) Analysis by Route of Administration, 2019 to 2034

Figure 91: Western Europe Market Value Share (%) and BPS Analysis by Route of Administration, 2024 to 2034

Figure 92: Western Europe Market Y-o-Y Growth (%) Projections by Route of Administration, 2024 to 2034

Figure 93: Western Europe Market Attractiveness by Drug Class, 2024 to 2034

Figure 94: Western Europe Market Attractiveness by Product, 2024 to 2034

Figure 95: Western Europe Market Attractiveness by Route of Administration, 2024 to 2034

Figure 96: Western Europe Market Attractiveness by Country, 2024 to 2034

Figure 97: Eastern Europe Market Value (US$ million) by Drug Class, 2024 to 2034

Figure 98: Eastern Europe Market Value (US$ million) by Product, 2024 to 2034

Figure 99: Eastern Europe Market Value (US$ million) by Route of Administration, 2024 to 2034

Figure 100: Eastern Europe Market Value (US$ million) by Country, 2024 to 2034

Figure 101: Eastern Europe Market Value (US$ million) Analysis by Country, 2019 to 2034

Figure 102: Eastern Europe Market Volume (Units) Analysis by Country, 2019 to 2034

Figure 103: Eastern Europe Market Value Share (%) and BPS Analysis by Country, 2024 to 2034

Figure 104: Eastern Europe Market Y-o-Y Growth (%) Projections by Country, 2024 to 2034

Figure 105: Eastern Europe Market Value (US$ million) Analysis by Drug Class, 2019 to 2034

Figure 106: Eastern Europe Market Volume (Units) Analysis by Drug Class, 2019 to 2034

Figure 107: Eastern Europe Market Value Share (%) and BPS Analysis by Drug Class, 2024 to 2034

Figure 108: Eastern Europe Market Y-o-Y Growth (%) Projections by Drug Class, 2024 to 2034

Figure 109: Eastern Europe Market Value (US$ million) Analysis by Product, 2019 to 2034

Figure 110: Eastern Europe Market Volume (Units) Analysis by Product, 2019 to 2034

Figure 111: Eastern Europe Market Value Share (%) and BPS Analysis by Product, 2024 to 2034

Figure 112: Eastern Europe Market Y-o-Y Growth (%) Projections by Product, 2024 to 2034

Figure 113: Eastern Europe Market Value (US$ million) Analysis by Route of Administration, 2019 to 2034

Figure 114: Eastern Europe Market Volume (Units) Analysis by Route of Administration, 2019 to 2034

Figure 115: Eastern Europe Market Value Share (%) and BPS Analysis by Route of Administration, 2024 to 2034

Figure 116: Eastern Europe Market Y-o-Y Growth (%) Projections by Route of Administration, 2024 to 2034

Figure 117: Eastern Europe Market Attractiveness by Drug Class, 2024 to 2034

Figure 118: Eastern Europe Market Attractiveness by Product, 2024 to 2034

Figure 119: Eastern Europe Market Attractiveness by Route of Administration, 2024 to 2034

Figure 120: Eastern Europe Market Attractiveness by Country, 2024 to 2034

Figure 121: South Asia and Pacific Market Value (US$ million) by Drug Class, 2024 to 2034

Figure 122: South Asia and Pacific Market Value (US$ million) by Product, 2024 to 2034

Figure 123: South Asia and Pacific Market Value (US$ million) by Route of Administration, 2024 to 2034

Figure 124: South Asia and Pacific Market Value (US$ million) by Country, 2024 to 2034

Figure 125: South Asia and Pacific Market Value (US$ million) Analysis by Country, 2019 to 2034

Figure 126: South Asia and Pacific Market Volume (Units) Analysis by Country, 2019 to 2034

Figure 127: South Asia and Pacific Market Value Share (%) and BPS Analysis by Country, 2024 to 2034

Figure 128: South Asia and Pacific Market Y-o-Y Growth (%) Projections by Country, 2024 to 2034

Figure 129: South Asia and Pacific Market Value (US$ million) Analysis by Drug Class, 2019 to 2034

Figure 130: South Asia and Pacific Market Volume (Units) Analysis by Drug Class, 2019 to 2034

Figure 131: South Asia and Pacific Market Value Share (%) and BPS Analysis by Drug Class, 2024 to 2034

Figure 132: South Asia and Pacific Market Y-o-Y Growth (%) Projections by Drug Class, 2024 to 2034

Figure 133: South Asia and Pacific Market Value (US$ million) Analysis by Product, 2019 to 2034

Figure 134: South Asia and Pacific Market Volume (Units) Analysis by Product, 2019 to 2034

Figure 135: South Asia and Pacific Market Value Share (%) and BPS Analysis by Product, 2024 to 2034

Figure 136: South Asia and Pacific Market Y-o-Y Growth (%) Projections by Product, 2024 to 2034

Figure 137: South Asia and Pacific Market Value (US$ million) Analysis by Route of Administration, 2019 to 2034

Figure 138: South Asia and Pacific Market Volume (Units) Analysis by Route of Administration, 2019 to 2034

Figure 139: South Asia and Pacific Market Value Share (%) and BPS Analysis by Route of Administration, 2024 to 2034

Figure 140: South Asia and Pacific Market Y-o-Y Growth (%) Projections by Route of Administration, 2024 to 2034

Figure 141: South Asia and Pacific Market Attractiveness by Drug Class, 2024 to 2034

Figure 142: South Asia and Pacific Market Attractiveness by Product, 2024 to 2034

Figure 143: South Asia and Pacific Market Attractiveness by Route of Administration, 2024 to 2034

Figure 144: South Asia and Pacific Market Attractiveness by Country, 2024 to 2034

Figure 145: East Asia Market Value (US$ million) by Drug Class, 2024 to 2034

Figure 146: East Asia Market Value (US$ million) by Product, 2024 to 2034

Figure 147: East Asia Market Value (US$ million) by Route of Administration, 2024 to 2034

Figure 148: East Asia Market Value (US$ million) by Country, 2024 to 2034

Figure 149: East Asia Market Value (US$ million) Analysis by Country, 2019 to 2034

Figure 150: East Asia Market Volume (Units) Analysis by Country, 2019 to 2034

Figure 151: East Asia Market Value Share (%) and BPS Analysis by Country, 2024 to 2034

Figure 152: East Asia Market Y-o-Y Growth (%) Projections by Country, 2024 to 2034

Figure 153: East Asia Market Value (US$ million) Analysis by Drug Class, 2019 to 2034

Figure 154: East Asia Market Volume (Units) Analysis by Drug Class, 2019 to 2034

Figure 155: East Asia Market Value Share (%) and BPS Analysis by Drug Class, 2024 to 2034

Figure 156: East Asia Market Y-o-Y Growth (%) Projections by Drug Class, 2024 to 2034

Figure 157: East Asia Market Value (US$ million) Analysis by Product, 2019 to 2034

Figure 158: East Asia Market Volume (Units) Analysis by Product, 2019 to 2034

Figure 159: East Asia Market Value Share (%) and BPS Analysis by Product, 2024 to 2034

Figure 160: East Asia Market Y-o-Y Growth (%) Projections by Product, 2024 to 2034

Figure 161: East Asia Market Value (US$ million) Analysis by Route of Administration, 2019 to 2034

Figure 162: East Asia Market Volume (Units) Analysis by Route of Administration, 2019 to 2034

Figure 163: East Asia Market Value Share (%) and BPS Analysis by Route of Administration, 2024 to 2034

Figure 164: East Asia Market Y-o-Y Growth (%) Projections by Route of Administration, 2024 to 2034

Figure 165: East Asia Market Attractiveness by Drug Class, 2024 to 2034

Figure 166: East Asia Market Attractiveness by Product, 2024 to 2034

Figure 167: East Asia Market Attractiveness by Route of Administration, 2024 to 2034

Figure 168: East Asia Market Attractiveness by Country, 2024 to 2034

Figure 169: Middle East and Africa Market Value (US$ million) by Drug Class, 2024 to 2034

Figure 170: Middle East and Africa Market Value (US$ million) by Product, 2024 to 2034

Figure 171: Middle East and Africa Market Value (US$ million) by Route of Administration, 2024 to 2034

Figure 172: Middle East and Africa Market Value (US$ million) by Country, 2024 to 2034

Figure 173: Middle East and Africa Market Value (US$ million) Analysis by Country, 2019 to 2034

Figure 174: Middle East and Africa Market Volume (Units) Analysis by Country, 2019 to 2034

Figure 175: Middle East and Africa Market Value Share (%) and BPS Analysis by Country, 2024 to 2034

Figure 176: Middle East and Africa Market Y-o-Y Growth (%) Projections by Country, 2024 to 2034

Figure 177: Middle East and Africa Market Value (US$ million) Analysis by Drug Class, 2019 to 2034

Figure 178: Middle East and Africa Market Volume (Units) Analysis by Drug Class, 2019 to 2034

Figure 179: Middle East and Africa Market Value Share (%) and BPS Analysis by Drug Class, 2024 to 2034

Figure 180: Middle East and Africa Market Y-o-Y Growth (%) Projections by Drug Class, 2024 to 2034

Figure 181: Middle East and Africa Market Value (US$ million) Analysis by Product, 2019 to 2034

Figure 182: Middle East and Africa Market Volume (Units) Analysis by Product, 2019 to 2034

Figure 183: Middle East and Africa Market Value Share (%) and BPS Analysis by Product, 2024 to 2034

Figure 184: Middle East and Africa Market Y-o-Y Growth (%) Projections by Product, 2024 to 2034

Figure 185: Middle East and Africa Market Value (US$ million) Analysis by Route of Administration, 2019 to 2034

Figure 186: Middle East and Africa Market Volume (Units) Analysis by Route of Administration, 2019 to 2034

Figure 187: Middle East and Africa Market Value Share (%) and BPS Analysis by Route of Administration, 2024 to 2034

Figure 188: Middle East and Africa Market Y-o-Y Growth (%) Projections by Route of Administration, 2024 to 2034

Figure 189: Middle East and Africa Market Attractiveness by Drug Class, 2024 to 2034

Figure 190: Middle East and Africa Market Attractiveness by Product, 2024 to 2034

Figure 191: Middle East and Africa Market Attractiveness by Route of Administration, 2024 to 2034

Figure 192: Middle East and Africa Market Attractiveness by Country, 2024 to 2034

Frequently Asked Questions

How big is the asthma treatment market?

The market is set to reach USD 28.0 billion in 2024.

What is the forecast for the market?

Demand for asthma treatment is slated to rise at a 5.1% CAGR by 2034.

What is the future of the asthma treatment market?

The market is set to reach USD 46.0 billion in 2034.

Who are the key players in the market?

Teva Pharmaceutical Industries Ltd, GSK plc, Merck & Co.Inc, and AstraZeneca are the key players.

Which product form would lead the market?

The inhaler segment is estimated to hold a significant market share in 2024.

Explore Similar Insights

Future Market Insights

Asthma Treatment Market