Reports

- Global Locations -

Headquarters

Future Market Insights, Inc.

Christiana Corporate, 200
Continental Drive, Suite 401,
Newark, Delaware - 19713,
United States

T: +1-347-918-3531

Americas

Future Market Insights, Inc.

616 Corporate Way, Suite 2-9018,
Valley Cottage, NY 10989, United States

MEA

Future Market Insights

1602-6 Jumeirah Bay X2 Tower, Plot No: JLT-PH2-X2A,
Jumeirah Lakes Towers, Dubai,
United Arab Emirates

Europe

Future Market Insights

3rd Floor, 207 Regent Street,
W1B 3HH London
United Kingdom

T: + 44 (0) 20 8123 9659

Asia Pacific

Future Market Insights

IndiaLand Global Tech Park, Unit UG-1, Behind Grand HighStreet, Phase 1, Hinjawadi, MH, Pune – 411057, India

Bronchodilator Market Outlook from 2024 to 2034

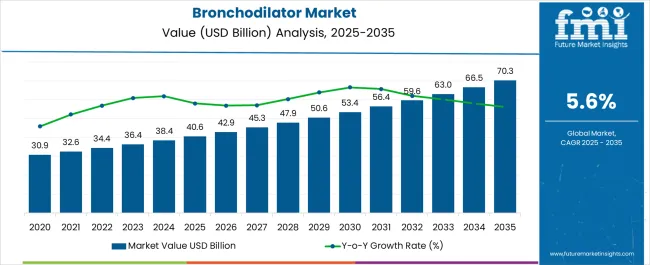
The global bronchodilator market size is projected to expand from US$ 38.2 billion in 2024 to US$ 67.8 billion by 2034. Sales of bronchodilators are predicted to soar at a CAGR of 5.9% in the estimated period 2024 to 2034. In 2023, the bronchodilator market value totaled US$ 36.2 billion and is set to exhibit a y-o-y growth of 5.7% in 2024.

Attributes Key Insights
Bronchodilator Market Value in 2023 US$ 36.2 billion
Estimated Bronchodilator Market Size (2024) US$ 38.2 billion
Projected Bronchodilator Market Revenue (2034) US$ 67.8 billion
Expected Bronchodilator Market CAGR (2024 to 2034) 5.9%
Market Share of Top 5 Countries 46.9%

Bronchodilator Market Overview

Bronchodilators have become highly sought-after medications to treat different respiratory diseases and other medical conditions. This class of drugs is set to aid in relaxing the airway-restricting muscles.

Bronchodilators are expected to be extensively used to reduce pulmonary mucus. Patients with respiratory disorders are recommended to use inhalers or nebulizers to administer these drugs.

Bronchodilators used for inhalation also affect mucociliary clearance. They are set to be used in the treatment of obstructive lung disorders (bronchi), such as asthma, and chronic obstructive pulmonary disorders (COPD) by loosening the muscles in the lungs and widening the airways. Hence, the growing prevalence of these diseases will likely drive demand for bronchodilators.

Short-acting and long-acting bronchodilators are the two types of bronchodilators used by patients suffering from respiratory disease. To treat respiratory conditions, bronchodilators come in a range of forms, including sympathomimetic, anticholinergic, phosphodiesterase inhibitors, and combination drugs. Depending on the method of administration, these types are available in different forms, such as inhalers, tablets, liquids, and injectables.

Other factors influencing market growth include:

  • Growing demand for advanced COPD treatment drugs
  • Rising popularity of inhalation therapy solutions
  • Increasing interest in bronchoconstriction relief drugs

Don't pay for what you don't need

Customize your report by selecting specific countries or regions and save 30%!

Historical Performance Vs. Global Bronchodilator Market Forecast

As per the latest bronchodilator industry analysis, global bronchodilator sales grew at a CAGR of 5.0% between 2019 and 2023. The market value for bronchodilators was about 43.3% of the respiratory diseases drug market in 2022, which was valued at US$ 79.8 billion.

Historical CAGR (2019 to 2023) 5.0%
Forecast CAGR (2024 to 2034) 5.9%

The main factor propelling the growth of the bronchodilator industry is the rising prevalence of respiratory illnesses, including asthma and chronic obstructive pulmonary disease (COPD), worldwide. Similarly, rising disposable income, a growing geriatric population, and a rise in public awareness of healthcare are all predicted to spur market expansion.

The market is also growing as a result of increased bronchodilator use in the treatment of cystic fibrosis. Subsequently, favorable government initiatives to reduce the burden of respiratory diseases are set to elevate demand for bronchodilators through 2034.

In recent years, there has been a spike in respiratory illnesses such as asthma. For instance, as per the Centers for Disease Control and Prevention (CDC), 1 in 13 individuals have asthma, which results in 9.8 million doctor visits, 188,968 hospital inpatient discharges, and 1.8 million trips to emergency rooms annually.

Over 25 million people in the United States, or 7.7% of adults and 8.4% of children, suffer from asthma, making it a common condition globally. With 8% of the adult population and 12% to 13% of children estimated to have asthma, the United Arab Emirates has a higher reported prevalence of the disease than the United States.

To treat asthma and relieve its symptoms, bronchodilators are set to be frequently used. Hence, the growing prevalence of asthma will play a key role in bolstering sales of bronchodilators.

The market for bronchodilators is expected to see new prospects due to continuous research and development efforts. New drug administration methods are being developed by manufacturers, which is anticipated to increase drug consumption and fuel the global bronchodilator market.

Top bronchodilator manufacturers are investing significantly in developing multiple nebulizer and inhaler types that would give patients convenient access. The development of novel bronchodilators with higher effectiveness and minimal side effects will boost the target market.

Key Opportunities for Bronchodilator Manufacturers

Improvements in healthcare structures and increasing government initiatives are expected to boost the market for bronchodilators globally. These factors will create lucrative growth opportunities for bronchodilator manufacturing companies.

Governments worldwide are launching different schemes to reduce the burden of respiratory diseases. Several steps are also taken to make the treatments affordable for everyone and spread awareness about the prevention of diseases. This is predicted to positively impact bronchodilator sales.

The growing incidence of COPD is acting as a catalyst fueling demand for bronchodilators, and the trend is expected to continue through 2034. Subsequently, the introduction of new programs to tackle the COPD burden will likely foster the growth of the bronchodilator industry.

Countries worldwide are launching new programs and initiatives to counter the burden of respiratory diseases. For instance, the COPD National Action Plan was recently launched to reduce COPD burden.

The COPD action plan aims to enhance the prevention, diagnosis, treatment, and management of COPD by enhancing the quality of care provided throughout the healthcare continuum. It strives to help those with COPD, their family members, and their caregivers.

Sabyasachi Ghosh
Sabyasachi Ghosh

Principal Consultant

Talk to Analyst

Find your sweet spots for generating winning opportunities in this market.

Factors Restraining Growth of the Bronchodilator Industry

Bronchodilators play an important role in terms of loosening up the muscles that constrict the airways. However, the side effects associated with bronchodilators are the main hindrance to the growth of this market.

Beta-2 agonists such as salbutamol and anticholinergics have several common adverse effects. These include trembling, especially in the hands, nervous tension, headaches, muscular cramps, dry mouth, constipation, difficulty in swallowing (dysphagia), heartburn, and palpitations.

When using an inhaler or nebulizer, patients can aggravate their glaucoma if the anticholinergic medicine gets in their eyes. If theophylline builds up in a patient’s body in excess, it can have negative side effects.

Theophylline side effects are more likely to affect older persons since their livers can be less able to eliminate it from their systems. A quick heartbeat (tachycardia), an irregular heartbeat (arrhythmia), headaches, and difficulty sleeping are a handful of theophylline's negative effects. These factors are expected to limit the growth of the bronchodilator market.

Comparative View of Adjacent Bronchodilator Markets

The global market for bronchodilators is set to be impacted by the peer or tangential markets in the healthcare industry. This includes the global bleeding disorder testing market and the severe asthma treatment market. On analysis of these related industries, profound insights have been found that will be helpful for developing unique differentiating strategies to pursue growth and opportunity.

Bronchodilator Market:

Attribute Bronchodilator Industry
CAGR (2024 to 2034) 5.9%
Growth Factor The increasing incidence of respiratory illnesses is a key factor driving the growth of the bronchodilator market.
Key Trend Rising government initiatives and the growing popularity of inhaled bronchodilators are key bronchodilator market trends.

Bleeding Disorder Testing Market:

Attribute Bleeding Disorder Testing Industry
CAGR (2024 to 2034) 7.2%
Growth Factor The rising prevalence of bleeding disorders is expected to boost growth in the bleeding disorder testing market.
Key Trend Increasing government investments in healthcare interoperability is set to create new opportunities for the bleeding disorder testing industry.

Severe Asthma Market:

Attribute Severe Asthma Industry
CAGR (2024 to 2034) 5.1%
Growth Factor The growing prevalence of asthma is expected to boost the growth of the severe asthma treatment market.
Key Trend The development of novel biological therapies is a key trend impacting the growth of the severe asthma treatment industry.

Get the data you need at a Fraction of the cost

Personalize your report by choosing insights you need
and save 40%!

Country-wise Insights

The table below shows the anticipated growth rates of the top countries. The United States, India, and China are expected to record lucrative CAGRs of 6.1%, 6.2%, and 5.3%, respectively, through 2034.

Countries CAGR (2023 to 2034)
United States 6.1%
Canada 5.0%
China 5.3%
India 6.2%
Germany 5.1%

Rising Prevalence of COPD in the United States Driving Sales

The United States bronchodilator market value totaled US$ 9.39 billion in 2023. It accounted for about 25.9% share of the global bronchodilator industry in 2023. Over the forecast period, sales of bronchodilators in the United States are predicted to rise at a 6.1% CAGR.

As per the latest report, the United States is expected to experience significant growth throughout the forecast period. This is attributable to the rising prevalence of COPD and other respiratory diseases, the high demand for breathing disorder medications, and the growing popularity of inhaled bronchodilators.

The increasing prevalence of COPD and asthma is playing a vital role in bolstering sales of bronchodilators in the United States. As per the Centers for Disease Control and Prevention (CDC), chronic lower respiratory disease remained the fourth most common cause of death in the United States in 2021.

More than 15 million people have COPD, and over 150,000 of them die from it each year, or one every four minutes. This is prompting patients suffering from COPD to opt for COPD treatment drugs, including bronchodilators.

Bronchodilators are mainly used as medication for COPD and asthma. They help relax the muscles in the airways and open them up, making breathing easier for patients with asthma and COPD. This is a prime driver boosting the growth of the bronchodilator market in the country.

Increasing Healthcare Expenditure Boosting Germany’s Market

Germany is set to exhibit a CAGR of 5.1% during the assessment period. It held a value share of about 4.0% in the global bronchodilator industry in 2023. The good healthcare infrastructure and increased awareness among people about hygiene are driving the growth of the bronchodilator market in Germany.

According to the World Health Organization (WHO), Germany is a top global leader in public health, as seen by its global health strategy and programs and the experience, knowledge, and funding it offers to WHO. Due to these reasons, the market for bronchodilators in Germany is increasing.

Growing preference for long-acting bronchodilators is another key factor expected to boost sales in the country. Similarly, rising cases of asthma will improve Germany’s bronchodilator industry share through 2034.

Rising Government Initiatives to Fuel Bronchodilator Demand in India

India held a 4.3% share of the worldwide bronchodilator industry in 2023. Over the assessment period, demand for bronchodilators in the country is anticipated to increase at a CAGR of 6.2%.

The increasing burden of non-communicable diseases and government initiatives toward the healthcare sector is expected to drive the growth of the bronchodilator market in India. The government is launching different initiatives and programs to reduce the burden of respiratory diseases.

For instance, in February 2017, the honorable Health and Family Welfare Minister launched the Kerala COPD Prevention and Control Program- ‘SWAAS.’ It is the country's first COPD prevention and control program that can help to tackle the burden of COPD. Such initiatives are creating a favorable environment for the expansion of the bronchodilator market.

Growing Incidence of Respiratory Diseases Making Canada a Lucrative Market

Canada’s bronchodilator market size reached over US$ 1.6 billion at the end of 2023. For the assessment period, bronchodilator sales in the country are projected to soar at a 5.0% CAGR, making it a lucrative market for companies.

Multiple factors are expected to stimulate growth in Canada’s bronchodilator industry. These include rising incidence of respiratory diseases, favorable government support, and growing adoption of combination therapies.

The cases of respiratory diseases like COPD and asthma are rising dramatically across Canada. This is expected to elevate the demand for bronchodilators as they are often used to treat these respiratory diseases.

Growing Awareness of Bronchodilators Driving Demand in China

China is emerging as a highly lucrative market for bronchodilators across East Asia. This is attributable to factors such as the rising cases of COPD and asthma, increasing awareness about bronchodilators, and the rising popularity of home healthcare.

China’s bronchodilator market size reached US$ 2.94 billion in 2023. Demand for bronchodilators in China is predicted to surge at a steady CAGR of 5.3% throughout the forecast period.

Bronchodilators and other airway expansion medications are becoming highly popular among patients and healthcare professionals in China, leading to increased demand for these medications. This is due to the rising awareness about the benefits of these bronchodilators.

Several public health campaigns are being launched in China to educate people about respiratory diseases and their treatment approaches. This is expected to uplift demand for bronchodilators and other related medications, thereby fostering China’s bronchodilator market growth.

Category-wise Insights

The section below shows the phosphodiesterase inhibitor segment dominating the bronchodilator market. It is poised to exhibit a CAGR of 6.2% during the forecast period. By application, the asthma segment is expected to thrive at a 6.6% CAGR.

Based on the route of administration, the oral segment is expected to lead the global bronchodilator industry. It will likely expand at a 6.4% CAGR between 2024 and 2034. By distribution channel, the retail pharmacies segment is anticipated to thrive at a CAGR of 6.0% through 2034.

High Effectiveness of Phosphodiesterase Inhibitors Makes Them Popular

Market Growth Outlook by Drug Class

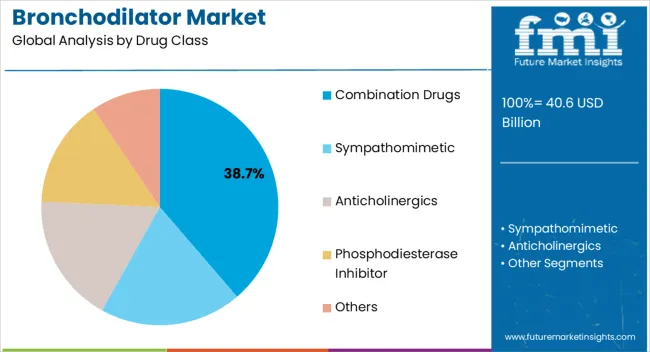
Drug Class Value CAGR
Sympathomimetic 6.7%
Anticholinergics 5.3%
Phosphodiesterase Inhibitor 6.2%
Combination Drugs 4.9%
Others 5.9%

Based on drug class, the phosphodiesterase inhibitor segment dominated the global bronchodilator market with a revenue share of 25.6% in 2023. Over the forecast period, demand for phosphodiesterase inhibitors is projected to rise at a CAGR of around 6.2%.

Phosphodiesterase inhibitors have become highly sought-after drugs to treat a variety of respiratory disorders. For instance, they are effective in treating asthma and chronic obstructive pulmonary disease (COPD).

Phosphodiesterase inhibitors work by curbing the breakdown of cyclic guanosine monophosphate (cGMP) and cyclic adenosine monophosphate (cAMP). These molecules are essential for the relaxation of smooth muscles, thereby helping to open up airways and making it easier to breathe.

The growing adoption of phosphodiesterase inhibitors to treat several respiratory diseases is expected to boost the target segment. Key bronchodilator companies are expected to capitalize on this rising demand by releasing new phosphodiesterase inhibitors.

Sympathomimetic drugs, on the other hand, are expected to witness a higher demand in the global market. This is due to their ability to treat different respiratory diseases by mimicking the effects of the sympathetic nervous system. The target segment is set to thrive at a 6.7% CAGR through 2034.

Asthma to Remain Key Revenue-generation Application for Companies

Market Growth Outlook by Application

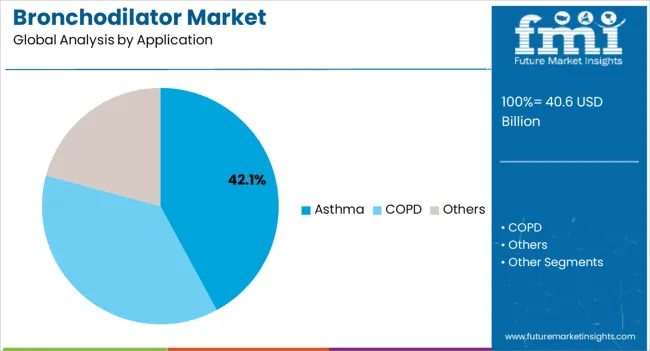
Application Value CAGR
Asthma 6.6%
COPD 5.9%
Others 5.2

As per the latest bronchodilator market analysis, asthma is predicted to remain a key revenue-generation segment for manufacturers of bronchodilators. This is due to the rising prevalence of asthma and the growing need for asthma relief medications.

In 2023, the asthma segment accounted for a revenue share of 34.2%. Over the forecast period, the target segment is poised to exhibit a CAGR of 6.6%, owing to the rising prevalence of pediatric asthma cases.

In recent years, there has been a spike in asthma cases worldwide. As per the World Health Organization (WHO), around 262 million people were affected by asthma in 2019, while there were 455000 asthma-related deaths. This is expected to drive the demand for bronchodilators as they relieve asthma symptoms and allow people with asthma to lead a normal life.

Better Convenience Making Oral Route of Administration Preferable

Market Growth Outlook by Route of Administration

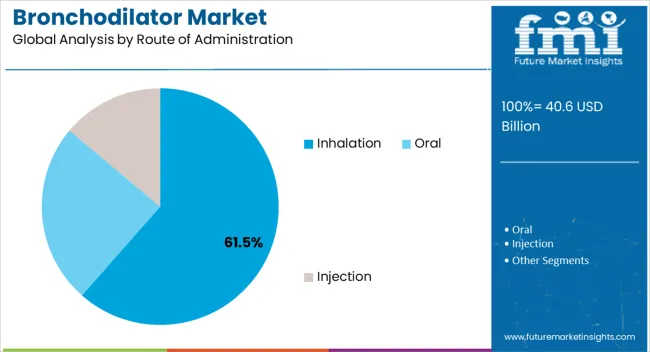
Route of Administration Value CAGR
Oral 6.4%
Injection 5.7%
Inhalation 5.1%

Orally used bronchodilators held a prominent market share value of 46.5% in 2023 and are expected to rise with a CAGR of 6.4% during the forecast period. This is attributable to the convenience and cost-effectiveness of the orally administered bronchodilators.

Oral bronchodilators remain the preferable route of drug administration owing to their better convenience and inexpensive nature. They tend to be more readily accepted by patients, which promotes greater adherence to prescribed treatment regimens, eventually leading to improved health outcomes.

Retail Pharmacies Remain the Most Popular Distribution Channel

Market Growth Outlook by Distribution Channel

Distribution Channel Value CAGR
Retail Pharmacies 6.0%
Hospital Pharmacies 5.3%
E-Commerce 6.4%
Drug Stores 6.1%

The retail pharmacies segment accounted for a dominant market share value of 32.4% at the end of 2023. For the projection period, the target segment is anticipated to thrive at a CAGR of 6.0%. This is due to the easy availability of bronchodilators in retail pharmacies.

Retail pharmacies provide a diverse selection of bronchodilators with heavy discounts. As a result, they are becoming an ideal destination for people to purchase bronchodilators. Hence, the growing inclination of patients toward purchasing bronchodilators from retail pharmacies will boost the target segment.
Competitive Landscape

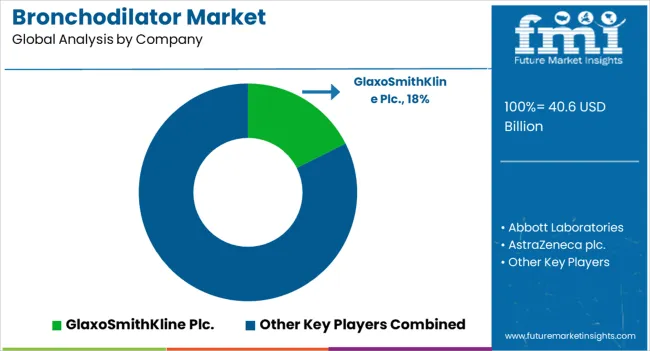
The bronchodilator industry is highly fragmented, with several companies competing for market share. Top manufacturers of bronchodilators are focusing on launching new products to match consumer demand and increase their client base. They are also using strategies such as mergers, acquisitions, partnerships and collaborations, and celebrity endorsements to stay ahead of the competition.

Recent Developments in the Bronchodilator Market

  • In July 2022, Theravance Biopharma, Inc. and Innoviva, Inc. agreed to sell a royalty stake in TRELEGY ELLIPTA (Trelegy) to Royalty Pharma plc. Trelegy, marketed by GSK, combines an inhaled corticosteroid for the maintenance treatment of asthma and chronic obstructive pulmonary disease (COPD) in patients who are 18 years of age and older.
  • In August 2021, Sanofi announced the acquisition of all the remaining shares of Translate Bio, advancing the use of mRNA technology in the development of vaccines and treatments.
  • In January 2023, the Food and Drug Administration (FDA) approved Airsupra (albuterol/budesonide) in the United States.

Bronchodilator Market Outlook by Category

By Drug Class:

  • Sympathomimetic
  • Anticholinergics
  • Phosphodiesterase Inhibitor
  • Combination Drugs
  • Others

By Application:

  • Asthma
  • COPD
  • Others

By Route of Administration:

  • Oral
  • Injection
  • Inhalation

By Distribution Channel:

  • Retail Pharmacies
  • Hospital Pharmacies
  • E-commerce
  • Drug Stores

By Region:

  • North America
  • Latin America
  • Europe
  • South Asia
  • East Asia
  • Oceania
  • Middle East and Africa

Frequently Asked Questions

What is the market value of bronchodilators?

The global bronchodilator market value totaled US$ 36.2 billion in 2023.

What is the current global bronchodilator market size?

The bronchodilator market size is expected to reach US$ 38.2 billion in 2024.

How big will the bronchodilator market be in 2034?

By 2034, the global bronchodilator market value is projected to reach US$ 67.8 billion.

What is the demand outlook for bronchodilators?

Demand for bronchodilators is predicted to rise at a 5.9% CAGR through 2034.

What are the key trends in the bronchodilator market?

High prevalence of lung diseases such as COPD & asthma and new product launches.

Which region dominates the global bronchodilator market?

North America dominated the global market with a share of 27.5% in 2023.

What is the sales forecast for the bronchodilator market in Germany?

Sales in Germany are set to expand at a 5.1% CAGR through 2034.

Which are the top five countries driving demand for bronchodilators?

The United States, China, India, Germany, and the United Kingdom.

Who are the key manufacturers of bronchodilators?

Abbott Laboratories, AstraZeneca plc., and Boehringer Ingelheim International GmbH.

What was the last 5 years’ CAGR for the bronchodilator market?

From 2019 to 2023, the market for bronchodilators expanded at 5.0% CAGR.

How big is the bronchodilator market in India?

India's bronchodilator market is expected to total US$ 1.5 billion by 2034.

What is the demand outlook for China's bronchodilator market?

Bronchodilator demand in China is projected to surge at 5.3% CAGR through 2034.

What is the main target of bronchodilators?

Cholinergic and adrenergic receptors are the main targets of bronchodilators.

Which drug is commonly used as a bronchodilator?

Anticholinergics and sympathomimetic drugs are used as bronchodilators.

What are 3 types of bronchodilators?

Anticholinergics, Theophylline, and beta 2-agonists.

Table of Content

1. Executive Summary

    1.1. Global Market Outlook

    1.2. Demand Side Trends

    1.3. Supply Side Trends

    1.4. Market Round Offs

    1.5. Future Market Insights (FMI) Analysis and Recommendations

2. Market Overview

    2.1. Market Coverage / Taxonomy

    2.2. Market Definition / Scope / Limitations

    2.3. Inclusions/Exclusions

3. Brand Mapping Analysis

    3.1. Price v/s Product

    3.2. Value for Money

    3.3. Top of Mind Bronchodilator

    3.4. Brand Portfolio-by Key Players

    3.5. Brand Loyalty Mapping

    3.6. Usage Pattern Overview

    3.7. Branded vs Unbranded-Market Mix

4. Distribution Channel Wise Key Brand Positioning

    4.1. Global Top Retailers and their Brand Offerings

        4.1.1. Retail Pharmacies

        4.1.2. Hospital Pharmacies

        4.1.3. E-Commerce

        4.1.4. Drug Stores

    4.2. Retail Pricing Strategies

5. Consumer Buying Behavior Analysis

    5.1. Functionality and Drug Class Demand

        5.1.1. Sympathomimetic

        5.1.2. Anticholinergics

        5.1.3. Phosphodiesterase Inhibitor

        5.1.4. Combination Drugs

        5.1.5. Others

    5.2. What factors do you consider when deciding to purchase bronchodilator?

    5.3. How important are product certifications when choosing bronchodilator?

    5.4. How important is the brand reputation and recognition when selecting bronchodilator?

    5.5. What marketing channels do you prefer for learning about new bronchodilator?

    5.6. How often do you purchase new bronchodilator?

        5.6.1. Once or More Every Month

        5.6.2. Once Every 2 months

        5.6.3. Once Every 6 Months

        5.6.4. Once a Year

        5.6.5. Less Than Once A Year

6. Market Trends & Dynamics

    6.1. Per Capita Spending on Bronchodilator

    6.2. Key Trends Impacting the Market

    6.3. Product Innovation / Development Trends

        6.3.1. Latest Trends and Demands

        6.3.2. Latest Innovations and New Launches

    6.4. Future Prospects of Organic Cosmetics Industry

    6.5. Market Dynamics

        6.5.1. Drivers

        6.5.2. Restraints

        6.5.3. Opportunity Analysis

7. Value Added Insights

    7.1. Disease Epidemiology, by Region

    7.2. Key promotional strategies by manufacturers

    7.3. Regulatory Landscape

    7.4. Value chain analysis

    7.5. Product adoption analysis

    7.6. PESTEL Analysis

    7.7. Porter’s Analysis

8. Market Background

    8.1. Macro-Economic Factors

        8.1.1. Global GDP Growth Outlook

        8.1.2. Global Healthcare Expenditure

        8.1.3. Global Respiratory Disease Drug Market Overview

    8.2. Forecast Factors - Relevance & Impact

        8.2.1. Top Companies Historical Growth

        8.2.2. Key Player’s Historic Growth

        8.2.3. Increasing Incidence of COPD

        8.2.4. Increasing Incidence Asthma

        8.2.5. Product Innovation

        8.2.6. Rising Geriatric Population

        8.2.7. Increase Awareness About HealthCare

9. Global Market Demand Analysis 2019 to 2023 and Forecast, 2024 to 2034

    9.1. Historical Market Volume (Units) Analysis, 2019 to 2023

    9.2. Current and Future Market Volume (Units) Projections, 2024 to 2034

        9.2.1. Y-o-Y Growth Trend Analysis *Per Capita Consumption

10. Global Market - Pricing Analysis

    10.1. Regional Pricing Analysis By Drug Class

    10.2. Global Average Pricing Analysis Benchmark

    10.3. Pricing Assumptions

11. Global Market Demand (in Value or Size in US$ billion) Analysis 2019 to 2023 and Forecast, 2024 to 2034

    11.1. Historical Market Value (US$ billion) Analysis, 2019 to 2023

    11.2. Current and Future Market Value (US$ billion) Projections, 2024 to 2034

        11.2.1. Y-o-Y Growth Trend Analysis

        11.2.2. Absolute $ Opportunity Analysis

12. Global Market Analysis 2019 to 2023 and Forecast 2024 to 2034, by Drug Class 

    12.1. Introduction / Key Findings

    12.2. Historical Market Size (US$ billion) and Volume (Units) Analysis By Drug Class, 2019 to 2023

    12.3. Current and Future Market Size (US$ billion) and Volume (Units) Analysis and Forecast By Drug Class, 2024 to 2034

        12.3.1. Sympathomimetic

        12.3.2. Anticholinergics

        12.3.3. Phosphodiesterase Inhibitor

        12.3.4. Combination Drugs

        12.3.5. Others

    12.4. Market Attractiveness Analysis By Drug Class

13. Global Market Analysis 2019 to 2023 and Forecast 2024 to 2034, By Application

    13.1. Introduction / Key Findings

    13.2. Historical Market Size (US$ billion) Analysis By Application, 2019 to 2023

    13.3. Current and Future Market Size (US$ billion) Analysis and Forecast By Application, 2024 to 2034

        13.3.1. Asthma

        13.3.2. COPD

        13.3.3. Others

    13.4. Market Attractiveness Analysis By Application

14. Global Market Analysis 2019 to 2023 and Forecast 2024 to 2034, By Route of Administration

    14.1. Introduction / Key Findings

    14.2. Historical Market Size (US$ billion) Analysis By Route of Administration, 2019 to 2023

    14.3. Current and Future Market Size (US$ billion) Analysis and Forecast By Route of Administration, 2024 to 2034

        14.3.1. Oral

        14.3.2. Injection

        14.3.3. Inhalation

    14.4. Market Attractiveness Analysis By Route of Administration

15. Global Market Analysis 2019 to 2023 and Forecast 2024 to 2034, By Distribution Channel

    15.1. Introduction / Key Findings

    15.2. Historical Market Size (US$ billion) Analysis By Distribution Channel, 2019 to 2023

    15.3. Current and Future Market Size (US$ billion) Analysis and Forecast By Distribution Channel, 2024 to 2034

        15.3.1. Retail Pharmacies

        15.3.2. Hospital Pharmacies

        15.3.3. E-commerce

        15.3.4. Drug Stores

    15.4. Market Attractiveness Analysis By Distribution Channel

16. Global Market Analysis 2019 to 2023 and Forecast 2024 to 2034, by Region

    16.1. Introduction

    16.2. Historical Market Size (US$ billion) Analysis By Region, 2019 to 2023

    16.3. Current and Future Market Size (US$ billion) and Volume (Units) Analysis and Forecast By Region, 2024 to 2034

        16.3.1. North America

        16.3.2. Latin America

        16.3.3. Europe

        16.3.4. South Asia

        16.3.5. East Asia

        16.3.6. Oceania

        16.3.7. Middle East & Africa

    16.4. Market Attractiveness Analysis By Region

17. North America Market Analysis 2019 to 2023 and Forecast 2024 to 2034

    17.1. Introduction

    17.2. Historical Market Size (US$ billion) and Volume (Units) Trend Analysis By Market Taxonomy, 2019 to 2023

    17.3. Current and Future Market Size (US$ billion) and Volume (Units) Analysis and Forecast By Market Taxonomy, 2024 to 2034

        17.3.1. By Country

            17.3.1.1. United States

            17.3.1.2. Canada

        17.3.2. By Drug Class

        17.3.3. By Application

        17.3.4. By Route of Administration

        17.3.5. By Distribution Channel

    17.4. Market Attractiveness Analysis

        17.4.1. By Country

        17.4.2. By Drug Class

        17.4.3. By Application

        17.4.4. By Route of Administration

        17.4.5. By Distribution Channel

    17.5. Market Trends

    17.6. Market Drivers & Restraints – Intensity Mapping

    17.7. Country Level Analysis & Forecast

        17.7.1. United States Market

            17.7.1.1. Introduction

            17.7.1.2. Market Analysis and Forecast by Market Taxonomy

                17.7.1.2.1. By Drug Class Type

                17.7.1.2.2. By Application

                17.7.1.2.3. By Route of Administration

                17.7.1.2.4. By Distribution Channel

        17.7.2. Canada Market

            17.7.2.1. Introduction

            17.7.2.2. Market Analysis and Forecast by Market Taxonomy

                17.7.2.2.1. By Drug Class Type

                17.7.2.2.2. By Application

                17.7.2.2.3. By Route of Administration

                17.7.2.2.4. By Distribution Channel

18. Latin America Market Analysis 2019 to 2023 and Forecast 2024 to 2034

    18.1. Introduction

    18.2. Historical Market Size (US$ billion) and Volume (Units) Trend Analysis By Market Taxonomy, 2019 to 2023

    18.3. Current and Future Market Size (US$ billion) and Volume (Units) Analysis and Forecast By Market Taxonomy, 2024 to 2034

        18.3.1. By Country

            18.3.1.1. Brazil

            18.3.1.2. Mexico

            18.3.1.3. Argentina

            18.3.1.4. Rest of LATAM

        18.3.2. By Drug Class

        18.3.3. By Application

        18.3.4. By Route of Administration

        18.3.5. By Distribution Channel

    18.4. Market Attractiveness Analysis

        18.4.1. By Country

        18.4.2. By Drug Class

        18.4.3. By Application

        18.4.4. By Route of Administration

        18.4.5. By Distribution Channel

    18.5. Market Trends

    18.6. Market Drivers & Restraints – Intensity Mapping

    18.7. Country Level Analysis & Forecast

        18.7.1. Brazil Market

            18.7.1.1. Introduction

            18.7.1.2. Market Analysis and Forecast by Market Taxonomy

                18.7.1.2.1. By Drug Class Type

                18.7.1.2.2. By Application

                18.7.1.2.3. By Route of Administration

                18.7.1.2.4. By Distribution Channel

        18.7.2. Mexico Market

            18.7.2.1. Introduction

            18.7.2.2. Market Analysis and Forecast by Market Taxonomy

                18.7.2.2.1. By Drug Class Type

                18.7.2.2.2. By Application

                18.7.2.2.3. By Route of Administration

                18.7.2.2.4. By Distribution Channel

        18.7.3. Argentina Market

            18.7.3.1. Introduction

            18.7.3.2. Market Analysis and Forecast by Market Taxonomy

                18.7.3.2.1. By Drug Class Type

                18.7.3.2.2. By Application

                18.7.3.2.3. By Route of Administration

                18.7.3.2.4. By Distribution Channel

19. Europe Market Analysis 2019 to 2023 and Forecast 2024 to 2034

    19.1. Introduction

    19.2. Historical Market Size (US$ billion) and Volume (Units) Trend Analysis By Market Taxonomy, 2019 to 2023

    19.3. Current and Future Market Size (US$ billion) and Volume (Units) Analysis and Forecast By Market Taxonomy, 2024 to 2034

        19.3.1. By Country

            19.3.1.1. United Kingdom

            19.3.1.2. Germany

            19.3.1.3. France

            19.3.1.4. Italy

            19.3.1.5. Spain

            19.3.1.6. BENELUX

            19.3.1.7. Russia

            19.3.1.8. Rest of Europe

        19.3.2. By Drug Class

        19.3.3. By Application

        19.3.4. By Route of Administration

        19.3.5. By Distribution Channel

    19.4. Market Attractiveness Analysis

        19.4.1. By Country

        19.4.2. By Drug Class

        19.4.3. By Application

        19.4.4. By Route of Administration

        19.4.5. By Distribution Channel

    19.5. Market Trends

    19.6. Market Drivers & Restraints – Intensity Mapping

    19.7. Country Level Analysis & Forecast

        19.7.1. United Kingdom Market

            19.7.1.1. Introduction

            19.7.1.2. Market Analysis and Forecast by Market Taxonomy

                19.7.1.2.1. By Drug Class Type

                19.7.1.2.2. By Application

                19.7.1.2.3. By Route of Administration

                19.7.1.2.4. By Distribution Channel

        19.7.2. Germany Market

            19.7.2.1. Introduction

            19.7.2.2. Market Analysis and Forecast by Market Taxonomy

                19.7.2.2.1. By Drug Class Type

                19.7.2.2.2. By Application

                19.7.2.2.3. By Route of Administration

                19.7.2.2.4. By Distribution Channel

        19.7.3. France Market

            19.7.3.1. Introduction

            19.7.3.2. Market Analysis and Forecast by Market Taxonomy

                19.7.3.2.1. By Drug Class Type

                19.7.3.2.2. By Application

                19.7.3.2.3. By Route of Administration

                19.7.3.2.4. By Distribution Channel

        19.7.4. Spain Market

            19.7.4.1. Introduction

            19.7.4.2. Market Analysis and Forecast by Market Taxonomy

                19.7.4.2.1. By Drug Class Type

                19.7.4.2.2. By Application

                19.7.4.2.3. By Route of Administration

                19.7.4.2.4. By Distribution Channel

        19.7.5. Italy Market

            19.7.5.1. Introduction

            19.7.5.2. Market Analysis and Forecast by Market Taxonomy

                19.7.5.2.1. By Drug Class Type

                19.7.5.2.2. By Application

                19.7.5.2.3. By Route of Administration

                19.7.5.2.4. By Distribution Channel

        19.7.6. BENELUX Market

            19.7.6.1. Introduction

            19.7.6.2. Market Analysis and Forecast by Market Taxonomy

                19.7.6.2.1. By Drug Class Type

                19.7.6.2.2. By Application

                19.7.6.2.3. By Route of Administration

                19.7.6.2.4. By Distribution Channel

        19.7.7. Russia Market

            19.7.7.1. Introduction

            19.7.7.2. Market Analysis and Forecast by Market Taxonomy

                19.7.7.2.1. By Drug Class Type

                19.7.7.2.2. By Application

                19.7.7.2.3. By Route of Administration

                19.7.7.2.4. By Distribution Channel

20. East Asia Market Analysis 2019 to 2023 and Forecast 2024 to 2034

    20.1. Introduction

    20.2. Historical Market Size (US$ billion) and Volume (Units) Trend Analysis By Market Taxonomy, 2019 to 2023

    20.3. Current and Future Market Size (US$ billion) and Volume (Units) Analysis and Forecast By Market Taxonomy, 2024 to 2034

        20.3.1. By Country

            20.3.1.1. China

            20.3.1.2. Japan

            20.3.1.3. South Korea

        20.3.2. By Drug Class

        20.3.3. By Application

        20.3.4. By Route of Administration

        20.3.5. By Distribution Channel

    20.4. Market Attractiveness Analysis

        20.4.1. By Country

        20.4.2. By Drug Class

        20.4.3. By Application

        20.4.4. By Route of Administration

        20.4.5. By Distribution Channel

    20.5. Market Trends

    20.6. Market Drivers & Restraints – Intensity Mapping

    20.7. Country Level Analysis & Forecast

        20.7.1. China Market

            20.7.1.1. Introduction

            20.7.1.2. Market Analysis and Forecast by Market Taxonomy

                20.7.1.2.1. By Drug Class Type

                20.7.1.2.2. By Application

                20.7.1.2.3. By Route of Administration

                20.7.1.2.4. By Distribution Channel

        20.7.2. Japan Market

            20.7.2.1. Introduction

            20.7.2.2. Market Analysis and Forecast by Market Taxonomy

                20.7.2.2.1. By Drug Class Type

                20.7.2.2.2. By Application

                20.7.2.2.3. By Route of Administration

                20.7.2.2.4. By Distribution Channel

        20.7.3. South Korea Market

            20.7.3.1. Introduction

            20.7.3.2. Market Analysis and Forecast by Market Taxonomy

                20.7.3.2.1. By Drug Class Type

                20.7.3.2.2. By Application

                20.7.3.2.3. By Route of Administration

                20.7.3.2.4. By Distribution Channel

21. South Asia Market Analysis 2019 to 2023 and Forecast 2024 to 2034

    21.1. Introduction

    21.2. Historical Market Size (US$ billion) and Volume (Units) Trend Analysis By Market Taxonomy, 2019 to 2023

    21.3. Current and Future Market Size (US$ billion) and Volume (Units) Analysis and Forecast By Market Taxonomy, 2024 to 2034

        21.3.1. By Country

            21.3.1.1. India

            21.3.1.2. Indonesia

            21.3.1.3. Thailand

            21.3.1.4. Malaysia

            21.3.1.5. Rest of South Asia

        21.3.2. By Drug Class

        21.3.3. By Application

        21.3.4. By Route of Administration

        21.3.5. By Distribution Channel

    21.4. Market Attractiveness Analysis

        21.4.1. By Country

        21.4.2. By Drug Class

        21.4.3. By Application

        21.4.4. By Route of Administration

        21.4.5. By Distribution Channel

    21.5. Market Trends

    21.6. Market Drivers & Restraints – Intensity Mapping

    21.7. Country Level Analysis & Forecast

        21.7.1. India Market

            21.7.1.1. Introduction

            21.7.1.2. Market Analysis and Forecast by Market Taxonomy

                21.7.1.2.1. By Drug Class Type

                21.7.1.2.2. By Application

                21.7.1.2.3. By Route of Administration

                21.7.1.2.4. By Distribution Channel

        21.7.2. Indonesia Market

            21.7.2.1. Introduction

            21.7.2.2. Market Analysis and Forecast by Market Taxonomy

                21.7.2.2.1. By Drug Class Type

                21.7.2.2.2. By Application

                21.7.2.2.3. By Route of Administration

                21.7.2.2.4. By Distribution Channel

        21.7.3. Thailand Market

            21.7.3.1. Introduction

            21.7.3.2. Market Analysis and Forecast by Market Taxonomy

                21.7.3.2.1. By Drug Class Type

                21.7.3.2.2. By Application

                21.7.3.2.3. By Route of Administration

                21.7.3.2.4. By Distribution Channel

        21.7.4. Malaysia Market

            21.7.4.1. Introduction

            21.7.4.2. Market Analysis and Forecast by Market Taxonomy

                21.7.4.2.1. By Drug Class Type

                21.7.4.2.2. By Application

                21.7.4.2.3. By Route of Administration

                21.7.4.2.4. By Distribution Channel

22. Oceania Market Analysis 2019 to 2023 and Forecast 2024 to 2034

    22.1. Introduction

    22.2. Historical Market Size (US$ billion) and Volume (Units) Trend Analysis By Market Taxonomy, 2019 to 2023

    22.3. Current and Future Market Size (US$ billion) and Volume (Units) Analysis and Forecast By Market Taxonomy, 2024 to 2034

        22.3.1. By Country

            22.3.1.1. Australia

            22.3.1.2. New Zealand

        22.3.2. By Drug Class

        22.3.3. By Application

        22.3.4. By Route of Administration

        22.3.5. By Distribution Channel

    22.4. Market Attractiveness Analysis

        22.4.1. By Country

        22.4.2. By Drug Class

        22.4.3. By Application

        22.4.4. By Route of Administration

        22.4.5. By Distribution Channel

    22.5. Market Trends

    22.6. Market Drivers & Restraints – Intensity Mapping

    22.7. Country Level Analysis & Forecast

        22.7.1. Australia Market

            22.7.1.1. Introduction

            22.7.1.2. Market Analysis and Forecast by Market Taxonomy

                22.7.1.2.1. By Drug Class Type

                22.7.1.2.2. By Application

                22.7.1.2.3. By Route of Administration

                22.7.1.2.4. By Distribution Channel

        22.7.2. New Zealand Market

            22.7.2.1. Introduction

            22.7.2.2. Market Analysis and Forecast by Market Taxonomy

                22.7.2.2.1. By Drug Class Type

                22.7.2.2.2. By Application

                22.7.2.2.3. By Route of Administration

                22.7.2.2.4. By Distribution Channel

23. Middle East & Africa Market Analysis 2019 to 2023 and Forecast 2024 to 2034

    23.1. Introduction

    23.2. Historical Market Size (US$ billion) and Volume (Units) Trend Analysis By Market Taxonomy, 2019 to 2023

    23.3. Current and Future Market Size (US$ billion) and Volume (Units) Analysis and Forecast By Market Taxonomy, 2024 to 2034

        23.3.1. By Country

            23.3.1.1. GCC Countries

            23.3.1.2. Türkiye

            23.3.1.3. South Africa

            23.3.1.4. North Africa

            23.3.1.5. Rest of Middle East & Africa

        23.3.2. By Drug Class

        23.3.3. By Application

        23.3.4. By Route of Administration

        23.3.5. By Distribution Channel

    23.4. Market Attractiveness Analysis

        23.4.1. By Country

        23.4.2. By Drug Class

        23.4.3. By Application

        23.4.4. By Route of Administration

        23.4.5. By Distribution Channel

    23.5. Market Trends

    23.6. Market Drivers & Restraints – Intensity Mapping

    23.7. Country Level Analysis & Forecast

        23.7.1. GCC Countries Market

            23.7.1.1. Introduction

            23.7.1.2. Market Analysis and Forecast by Market Taxonomy

                23.7.1.2.1. By Drug Class Type

                23.7.1.2.2. By Application

                23.7.1.2.3. By Route of Administration

                23.7.1.2.4. By Distribution Channel

        23.7.2. Türkiye Market

            23.7.2.1. Introduction

            23.7.2.2. Market Analysis and Forecast by Market Taxonomy

                23.7.2.2.1. By Drug Class Type

                23.7.2.2.2. By Application

                23.7.2.2.3. By Route of Administration

                23.7.2.2.4. By Distribution Channel

        23.7.3. South Africa Market

            23.7.3.1. Introduction

            23.7.3.2. Market Analysis and Forecast by Market Taxonomy

                23.7.3.2.1. By Drug Class Type

                23.7.3.2.2. By Application

                23.7.3.2.3. By Route of Administration

                23.7.3.2.4. By Distribution Channel

        23.7.4. North Africa Market

            23.7.4.1. Introduction

            23.7.4.2. Market Analysis and Forecast by Market Taxonomy

                23.7.4.2.1. By Drug Class Type

                23.7.4.2.2. By Application

                23.7.4.2.3. By Route of Administration

                23.7.4.2.4. By Distribution Channel

24. Market Structure Analysis

    24.1. Market Analysis by Tier of Companies

    24.2. Market Share Analysis of Top Players

    24.3. Market Presence Analysis

25. Competition Analysis

    25.1. Competition Dashboard

    25.2. Branding and Promotional Strategies, By Key Players

    25.3. Key Development Analysis

    25.4. Competition Deep Dive

        25.4.1. Abbott Laboratories Overview

            25.4.1.1. Product Portfolio

            25.4.1.2. Key Financials

            25.4.1.3. Sales Footprint

            25.4.1.4. Strategy Overview

                25.4.1.4.1. Marketing Strategy

                25.4.1.4.2. Component Type Strategy

                25.4.1.4.3. Channel Strategy

        25.4.2. AstraZeneca plc.

        25.4.3. Boehringer Ingelheim International GmbH

        25.4.4. GlaxoSmithKline Plc.

        25.4.5. F. Hoffmann-La Roche Ltd.

        25.4.6. Novartis AG.

        25.4.7. Pfizer Inc.

        25.4.8. SANOFI

        25.4.9. Teva Pharmaceutical Industries Ltd.

        25.4.10. Vectura Group Plc.

        25.4.11. Sunovion Pharmaceuticals Inc

        25.4.12. Aerogen Pharma Ltd

        25.4.13. Aurobindo Pharma Ltd.

        25.4.14. Cipla Ltd.

26. Assumptions and Acronyms Used

27. Research Methodology

List of Tables

Table 01: Global Market Analysis 2019 to 2023 and Forecast 2024 to 2034, by Drug Class

Table 02: Global Market Analysis 2019 to 2023 and Forecast 2024 to 2034, by Application

Table 03: Global Market Analysis 2019 to 2023 and Forecast 2024 to 2034, by Route of Administration

Table 04: Global Market Analysis 2019 to 2023 and Forecast 2024 to 2034, by Distribution Channel

Table 05: Global Market Analysis 2019 to 2023 and Forecast 2024 to 2034, by Region

Table 06: North America Market Value (US$ billion) Analysis 2019 to 2023 and Forecast 2024 to 2034, by Country

Table 07: North America Market Value (US$ billion) Analysis 2019 to 2023 and Forecast 2024 to 2034, by Drug Class

Table 08: North America Market Value (US$ billion) Analysis 2019 to 2023 and Forecast 2024 to 2034, by Application

Table 09: North America Market Value (US$ billion) Analysis 2019 to 2023 and Forecast 2024 to 2034, by Route of Administration

Table 10: North America Market Value (US$ billion) Analysis 2019 to 2023 and Forecast 2024 to 2034, by Distribution Channel

Table 11: Latin America Market Value (US$ billion) Analysis 2019 to 2023 and Forecast 2024 to 2034, by Country

Table 12: Latin America Market Value (US$ billion) Analysis 2019 to 2023 and Forecast 2024 to 2034, by Drug Class

Table 13: Latin America Market Value (US$ billion) Analysis 2019 to 2023 and Forecast 2024 to 2034, by Application

Table 14: Latin America Market Value (US$ billion) Analysis 2019 to 2023 and Forecast 2024 to 2034, by Route of Administration

Table 15: Latin America Market Value (US$ billion) Analysis 2019 to 2023 and Forecast 2024 to 2034, by Distribution Channel

Table 16: Europe Market Value (US$ billion) Analysis 2019 to 2023 and Forecast 2024 to 2034, by Country

Table 17: Europe Market Value (US$ billion) Analysis 2019 to 2023 and Forecast 2024 to 2034, by Drug Class

Table 18: Europe Market Analysis 2019 to 2023 and Forecast 2024 to 2034, by Application

Table 19: Europe Market Analysis 2019 to 2023 and Forecast 2024 to 2034, by Route of Administration

Table 20: Europe Market Analysis 2019 to 2023 and Forecast 2024 to 2034, by Distribution Channel

Table 21: East Asia Market Value (US$ billion) Analysis 2019 to 2023 and Forecast 2024 to 2034, by Country

Table 22: East Asia Market Value (US$ billion) Analysis 2019 to 2023 and Forecast 2024 to 2034, by Drug Class

Table 23: East Asia Market Value (US$ billion) Analysis 2019 to 2023 and Forecast 2024 to 2034, by Application

Table 24: East Asia Market Value (US$ billion) Analysis 2019 to 2023 and Forecast 2024 to 2034, by Route of Administration

Table 25: East Asia Market Value (US$ billion) Analysis 2019 to 2023 and Forecast 2024 to 2034, by Distribution Channel

Table 26: South Asia Market Value (US$ billion) Analysis 2019 to 2023 and Forecast 2024 to 2034, by Country

Table 27: South Asia Market Value (US$ billion) Analysis 2019 to 2023 and Forecast 2024 to 2034, by Drug Class

Table 28: South Asia Market Value (US$ billion) Analysis 2019 to 2023 and Forecast 2024 to 2034, by Application

Table 29: South Asia Market Value (US$ billion) Analysis 2019 to 2023 and Forecast 2024 to 2034, by Route of Administration

Table 30: South Asia Market Value (US$ billion) Analysis 2019 to 2023 and Forecast 2024 to 2034, by Distribution Channel

Table 31: Oceania Market Value (US$ billion) Analysis 2019 to 2023 and Forecast 2024 to 2034, by Country

Table 32: Oceania Market Value (US$ billion) Analysis 2019 to 2023 and Forecast 2024 to 2034, by Drug Class

Table 33: Oceania Market Analysis 2019 to 2023 and Forecast 2024 to 2034, by Application

Table 34: Oceania Market Analysis 2019 to 2023 and Forecast 2024 to 2034, by Route of Administration

Table 35: Oceania Market Analysis 2019 to 2023 and Forecast 2024 to 2034, by Distribution Channel

Table 36: Middle East & Africa Market Value (US$ billion) Analysis 2019 to 2023 and Forecast 2024 to 2034, by Country

Table 37: Middle East & Africa Market Value (US$ billion) Analysis 2019 to 2023 and Forecast 2024 to 2034, by Drug Class

Table 38: Middle East & Africa Market Analysis 2019 to 2023 and Forecast 2024 to 2034, by Application

Table 39: Middle East & Africa Market Analysis 2019 to 2023 and Forecast 2024 to 2034, by Route of Administration

Table 40: Middle East & Africa Market Analysis 2019 to 2023 and Forecast 2024 to 2034, by Distribution Channel

List of Charts

Figure 01: Global Market Value (US$ billion) Analysis, 2019 to 2023

Figure 02: Global Market Forecast & Y-o-Y Growth, 2024 to 2034

Figure 03: Global Market Absolute $ Opportunity (US$ billion) Analysis, 2024 to 2034

Figure 04: Global Market Value Share (%) Analysis 2024 and 2034, by Drug Class

Figure 05: Global Market Y-o-Y Growth (%) Analysis 2024 to 2034, by Drug Class

Figure 06: Global Market Attractiveness Analysis 2024 to 2034, by Drug Class

Figure 07: Global Market Value Share (%) Analysis 2024 and 2034, by Application

Figure 08: Global Market Y-o-Y Growth (%) Analysis 2024 to 2034, by Application

Figure 09: Global Market Attractiveness Analysis 2024 to 2034, by Application

Figure 10: Global Market Value Share (%) Analysis 2024 and 2034, by Route of Administration

Figure 11: Global Market Y-o-Y Growth (%) Analysis 2024 to 2034, by Route of Administration

Figure 12: Global Market Attractiveness Analysis 2024 to 2034, by Route of Administration

Figure 13: Global Market Value Share (%) Analysis 2024 and 2034, by Distribution Channel

Figure 14: Global Market Y-o-Y Growth (%) Analysis 2024 to 2034, by Distribution Channel

Figure 15: Global Market Attractiveness Analysis 2024 to 2034, by Distribution Channel

Figure 16: Global Market Value Share (%) Analysis 2024 and 2034, by Region

Figure 17: Global Market Y-o-Y Growth (%) Analysis 2024 to 2034, by Region

Figure 18: Global Market Attractiveness Analysis 2024 to 2034, by Region

Figure 19: North America Market Value (US$ billion) Analysis, 2019 to 2023

Figure 20: North America Market Value (US$ billion) Forecast, 2024 to 2034

Figure 21: North America Market Value Share, by Drug Class (2024 E)

Figure 22: North America Market Value Share, by Application (2024 E)

Figure 23: North America Market Value Share, by Route of Administration (2024 E)

Figure 24: North America Market Value Share, by Distribution Channel (2024 E)

Figure 25: North America Market Value Share, by Country (2024 E)

Figure 26: North America Market Attractiveness Analysis by Drug Class, 2024 to 2034

Figure 27: North America Market Attractiveness Analysis by Application, 2024 to 2034

Figure 28: North America Market Attractiveness Analysis by Route of Administration, 2024 to 2034

Figure 29: North America Market Attractiveness Analysis by Distribution Channel, 2024 to 2034

Figure 30: North America Market Attractiveness Analysis by Country, 2024 to 2034

Figure 31: United States Market Value Proportion Analysis, 2024

Figure 32: Global Vs. United States Growth Comparison

Figure 33: United States Market Share Analysis (%) by Drug Class, 2024 to 2034

Figure 34: United States Market Share Analysis (%) by Application, 2024 to 2034

Figure 35: United States Market Share Analysis (%) by Route of Administration, 2024 to 2034

Figure 36: United States Market Share Analysis (%) by Distribution Channel, 2024 to 2034

Figure 37: Canada Market Value Proportion Analysis, 2024

Figure 38: Global Vs. Canada. Growth Comparison

Figure 39: Canada Market Share Analysis (%) by Drug Class, 2024 to 2034

Figure 40: Canada Market Share Analysis (%) by Application, 2024 to 2034

Figure 41: Canada Market Share Analysis (%) by Route of Administration, 2024 to 2034

Figure 42: Canada Market Share Analysis (%) by Distribution Channel, 2024 to 2034

Figure 43: Latin America Market Value (US$ billion) Analysis, 2019 to 2023

Figure 44: Latin America Market Value (US$ billion) Forecast, 2024 to 2034

Figure 45: Latin America Market Value Share, by Drug Class (2024 E)

Figure 46: Latin America Market Value Share, by Application (2024 E)

Figure 47: Latin America Market Value Share, by Route of Administration (2024 E)

Figure 48: Latin America Market Value Share, by Distribution Channel (2024 E)

Figure 49: Latin America Market Value Share, by Country (2024 E)

Figure 50: Latin America Market Attractiveness Analysis by Drug Class, 2024 to 2034

Figure 51: Latin America Market Attractiveness Analysis by Application, 2024 to 2034

Figure 52: Latin America Market Attractiveness Analysis by Route of Administration, 2024 to 2034

Figure 53: Latin America Market Attractiveness Analysis by Distribution Channel, 2024 to 2034

Figure 54: Latin America Market Attractiveness Analysis by Country, 2024 to 2034

Figure 55: Mexico Market Value Proportion Analysis, 2024

Figure 56: Global Vs Mexico Growth Comparison

Figure 57: Mexico Market Share Analysis (%) by Drug Class, 2024 to 2034

Figure 58: Mexico Market Share Analysis (%) by Application, 2024 to 2034

Figure 59: Mexico Market Share Analysis (%) by Route of Administration, 2024 to 2034

Figure 60: Mexico Market Share Analysis (%) by Distribution Channel, 2024 to 2034

Figure 61: Brazil Market Value Proportion Analysis, 2024

Figure 62: Global Vs. Brazil. Growth Comparison

Figure 63: Brazil Market Share Analysis (%) by Drug Class, 2024 to 2034

Figure 64: Brazil Market Share Analysis (%) by Application, 2024 to 2034

Figure 65: Brazil Market Share Analysis (%) by Route of Administration, 2024 to 2034

Figure 66: Brazil Market Share Analysis (%) by Distribution Channel, 2024 to 2034

Figure 67: Argentina Market Value Proportion Analysis, 2024

Figure 68: Global Vs Argentina Growth Comparison

Figure 69: Argentina Market Share Analysis (%) by Drug Class, 2024 to 2034

Figure 70: Argentina Market Share Analysis (%) by Application, 2024 to 2034

Figure 71: Argentina Market Share Analysis (%) by Route of Administration, 2024 to 2034

Figure 72: Argentina Market Share Analysis (%) by Distribution Channel, 2024 to 2034

Figure 73: Europe Market Value (US$ billion) Analysis, 2019 to 2023

Figure 74: Europe Market Value (US$ billion) Forecast, 2024 to 2034

Figure 75: Europe Market Value Share, by Drug Class (2024 E)

Figure 76: Europe Market Value Share, by Application (2024 E)

Figure 77: Europe Market Value Share, by Route of Administration (2024 E)

Figure 78: Europe Market Value Share, by Distribution Channel (2024 E)

Figure 79: Europe Market Value Share, by Country (2024 E)

Figure 80: Europe Market Attractiveness Analysis by Drug Class, 2024 to 2034

Figure 81: Europe Market Attractiveness Analysis by Application, 2024 to 2034

Figure 82: Europe Market Attractiveness Analysis by Route of Administration, 2024 to 2034

Figure 83: Europe Market Attractiveness Analysis by Distribution Channel, 2024 to 2034

Figure 84: Europe Market Attractiveness Analysis by Country, 2024 to 2034

Figure 85: United Kingdom Market Value Proportion Analysis, 2024

Figure 86: Global Vs. United Kingdom Growth Comparison

Figure 87: United Kingdom Market Share Analysis (%) by Drug Class, 2024 to 2034

Figure 88: United Kingdom Market Share Analysis (%) by Application, 2024 to 2034

Figure 89: United Kingdom Market Share Analysis (%) by Route of Administration, 2024 to 2034

Figure 90: United Kingdom Market Share Analysis (%) by Distribution Channel, 2024 to 2034

Figure 91: Germany Market Value Proportion Analysis, 2024

Figure 92: Global Vs. Germany Growth Comparison

Figure 93: Germany Market Share Analysis (%) by Drug Class, 2024 to 2034

Figure 94: Germany Market Share Analysis (%) by Application, 2024 to 2034

Figure 95: Germany Market Share Analysis (%) by Route of Administration, 2024 to 2034

Figure 96: Germany Market Share Analysis (%) by Distribution Channel, 2024 to 2034

Figure 97: Italy Market Value Proportion Analysis, 2024

Figure 98: Global Vs. Italy Growth Comparison

Figure 99: Italy Market Share Analysis (%) by Drug Class, 2024 to 2034

Figure 100: Italy Market Share Analysis (%) by Application, 2024 to 2034

Figure 101: Italy Market Share Analysis (%) by Route of Administration, 2024 to 2034

Figure 102: Italy Market Share Analysis (%) by Distribution Channel, 2024 to 2034

Figure 103: France Market Value Proportion Analysis, 2024

Figure 104: Global Vs France Growth Comparison

Figure 105: France Market Share Analysis (%) by Drug Class, 2024 to 2034

Figure 106: France Market Share Analysis (%) by Application, 2024 to 2034

Figure 107: France Market Share Analysis (%) by Route of Administration, 2024 to 2034

Figure 108: France Market Share Analysis (%) by Distribution Channel, 2024 to 2034

Figure 109: Spain Market Value Proportion Analysis, 2024

Figure 110: Global Vs Spain Growth Comparison

Figure 111: Spain Market Share Analysis (%) by Drug Class, 2024 to 2034

Figure 112: Spain Market Share Analysis (%) by Application, 2024 to 2034

Figure 113: Spain Market Share Analysis (%) by Route of Administration, 2024 to 2034

Figure 114: Spain Market Share Analysis (%) by Distribution Channel, 2024 to 2034

Figure 115: Russia Market Value Proportion Analysis, 2024

Figure 116: Global Vs Russia Growth Comparison

Figure 117: Russia Market Share Analysis (%) by Drug Class, 2024 to 2034

Figure 118: Russia Market Share Analysis (%) by Application, 2024 to 2034

Figure 119: Russia Market Share Analysis (%) by Route of Administration, 2024 to 2034

Figure 120: Russia Market Share Analysis (%) by Distribution Channel, 2024 to 2034

Figure 121: BENELUX Market Value Proportion Analysis, 2024

Figure 122: Global Vs BENELUX Growth Comparison

Figure 123: BENELUX Market Share Analysis (%) by Drug Class, 2024 to 2034

Figure 124: BENELUX Market Share Analysis (%) by Application, 2024 to 2034

Figure 125: BENELUX Market Share Analysis (%) by Route of Administration, 2024 to 2034

Figure 126: BENELUX Market Share Analysis (%) by Distribution Channel, 2024 to 2034

Figure 127: East Asia Market Value (US$ billion) Analysis, 2019 to 2023

Figure 128: East Asia Market Value (US$ billion) Forecast, 2024 to 2034

Figure 129: East Asia Market Value Share, by Drug Class (2024 E)

Figure 130: East Asia Market Value Share, by Application (2024 E)

Figure 131: East Asia Market Value Share, by Route of Administration (2024 E)

Figure 132: East Asia Market Value Share, by Distribution Channel (2024 E)

Figure 133: East Asia Market Value Share, by Country (2024 E)

Figure 134: East Asia Market Attractiveness Analysis by Drug Class, 2024 to 2034

Figure 135: East Asia Market Attractiveness Analysis by Application, 2024 to 2034

Figure 136: East Asia Market Attractiveness Analysis by Route of Administration, 2024 to 2034

Figure 137: East Asia Market Attractiveness Analysis by Distribution Channel, 2024 to 2034

Figure 138: East Asia Market Attractiveness Analysis by Country, 2024 to 2034

Figure 139: China Market Value Proportion Analysis, 2024

Figure 140: Global Vs. China Growth Comparison

Figure 141: China Market Share Analysis (%) by Drug Class, 2024 to 2034

Figure 142: China Market Share Analysis (%) by Application, 2024 to 2034

Figure 143: China Market Share Analysis (%) by Route of Administration, 2024 to 2034

Figure 144: China Market Share Analysis (%) by Distribution Channel, 2024 to 2034

Figure 145: Japan Market Value Proportion Analysis, 2024

Figure 146: Global Vs. Japan Growth Comparison

Figure 147: Japan Market Share Analysis (%) by Drug Class, 2024 to 2034

Figure 148: Japan Market Share Analysis (%) by Application, 2024 to 2034

Figure 149: Japan Market Share Analysis (%) by Route of Administration, 2024 to 2034

Figure 150: Japan Market Share Analysis (%) by Distribution Channel, 2024 to 2034

Figure 151: South Korea Market Value Proportion Analysis, 2024

Figure 152: Global Vs South Korea Growth Comparison

Figure 153: South Korea Market Share Analysis (%) by Drug Class, 2024 to 2034

Figure 154: South Korea Market Share Analysis (%) by Application, 2024 to 2034

Figure 155: South Korea Market Share Analysis (%) by Route of Administration, 2024 to 2034

Figure 156: South Korea Market Share Analysis (%) by Distribution Channel, 2024 to 2034

Figure 157: South Asia Market Value (US$ billion) Analysis, 2019 to 2023

Figure 158: South Asia Market Value (US$ billion) Forecast, 2024 to 2034

Figure 159: South Asia Market Value Share, by Drug Class (2024 E)

Figure 160: South Asia Market Value Share, by Application (2024 E)

Figure 161: South Asia Market Value Share, by Route of Administration (2024 E)

Figure 162: South Asia Market Value Share, by Distribution Channel (2024 E)

Figure 163: South Asia Market Value Share, by Country (2024 E)

Figure 164: South Asia Market Attractiveness Analysis by Drug Class, 2024 to 2034

Figure 165: South Asia Market Attractiveness Analysis by Application, 2024 to 2034

Figure 166: South Asia Market Attractiveness Analysis by Route of Administration, 2024 to 2034

Figure 167: South Asia Market Attractiveness Analysis by Distribution Channel, 2024 to 2034

Figure 168: South Asia Market Attractiveness Analysis by Country, 2024 to 2034

Figure 169: India Market Value Proportion Analysis, 2024

Figure 170: Global Vs. India Growth Comparison

Figure 171: India Market Share Analysis (%) by Drug Class, 2024 to 2034

Figure 172: India Market Share Analysis (%) by Application, 2024 to 2034

Figure 173: India Market Share Analysis (%) by Route of Administration, 2024 to 2034

Figure 174: India Market Share Analysis (%) by Distribution Channel, 2024 to 2034

Figure 175: Indonesia Market Value Proportion Analysis, 2024

Figure 176: Global Vs. Indonesia Growth Comparison

Figure 177: Indonesia Market Share Analysis (%) by Drug Class, 2024 to 2034

Figure 178: Indonesia Market Share Analysis (%) by Application, 2024 to 2034

Figure 179: Indonesia Market Share Analysis (%) by Route of Administration, 2024 to 2034

Figure 180: Indonesia Market Share Analysis (%) by Distribution Channel, 2024 to 2034

Figure 181: Malaysia Market Value Proportion Analysis, 2024

Figure 182: Global Vs. Malaysia Growth Comparison

Figure 183: Malaysia Market Share Analysis (%) by Drug Class, 2024 to 2034

Figure 184: Malaysia Market Share Analysis (%) by Application, 2024 to 2034

Figure 185: Malaysia Market Share Analysis (%) by Route of Administration, 2024 to 2034

Figure 186: Malaysia Market Share Analysis (%) by Distribution Channel, 2024 to 2034

Figure 187: Thailand Market Value Proportion Analysis, 2024

Figure 188: Global Vs. Thailand Growth Comparison

Figure 189: Thailand Market Share Analysis (%) by Drug Class, 2024 to 2034

Figure 190: Thailand Market Share Analysis (%) by Application, 2024 to 2034

Figure 191: Thailand Market Share Analysis (%) by Route of Administration, 2024 to 2034

Figure 192: Thailand Market Share Analysis (%) by Distribution Channel, 2024 to 2034

Figure 193: Oceania Market Value (US$ billion) Analysis, 2019 to 2023

Figure 194: Oceania Market Value (US$ billion) Forecast, 2024 to 2034

Figure 195: Oceania Market Value Share, by Drug Class (2024 E)

Figure 196: Oceania Market Value Share, by Application (2024 E)

Figure 197: Oceania Market Value Share, by Route of Administration (2024 E)

Figure 198: Oceania Market Value Share, by Distribution Channel (2024 E)

Figure 199: Oceania Market Value Share, by Country (2024 E)

Figure 200: Oceania Market Attractiveness Analysis by Drug Class, 2024 to 2034

Figure 201: Oceania Market Attractiveness Analysis by Application, 2024 to 2034

Figure 202: Oceania Market Attractiveness Analysis by Route of Administration, 2024 to 2034

Figure 203: Oceania Market Attractiveness Analysis by Distribution Channel, 2024 to 2034

Figure 204: Oceania Market Attractiveness Analysis by Country, 2024 to 2034

Figure 205: Australia Market Value Proportion Analysis, 2024

Figure 206: Global Vs. Australia Growth Comparison

Figure 207: Australia Market Share Analysis (%) by Drug Class, 2024 to 2034

Figure 208: Australia Market Share Analysis (%) by Application, 2024 to 2034

Figure 209: Australia Market Share Analysis (%) by Route of Administration, 2024 to 2034

Figure 210: Australia Market Share Analysis (%) by Distribution Channel, 2024 to 2034

Figure 211: New Zealand Market Value Proportion Analysis, 2024

Figure 212: Global Vs New Zealand Growth Comparison

Figure 213: New Zealand Market Share Analysis (%) by Drug Class, 2024 to 2034

Figure 214: New Zealand Market Share Analysis (%) by Application, 2024 to 2034

Figure 215: New Zealand Market Share Analysis (%) by Route of Administration, 2024 to 2034

Figure 216: New Zealand Market Share Analysis (%) by Distribution Channel, 2024 to 2034

Figure 217: Middle East & Africa Market Value (US$ billion) Analysis, 2019 to 2023

Figure 218: Middle East & Africa Market Value (US$ billion) Forecast, 2024 to 2034

Figure 219: Middle East & Africa Market Value Share, by Drug Class (2024 E)

Figure 220: Middle East & Africa Market Value Share, by Application (2024 E)

Figure 221: Middle East & Africa Market Value Share, by Route of Administration (2024 E)

Figure 222: Middle East & Africa Market Value Share, by Distribution Channel (2024 E)

Figure 223: Middle East & Africa Market Value Share, by Country (2024 E)

Figure 224: Middle East & Africa Market Attractiveness Analysis by Drug Class, 2024 to 2034

Figure 225: Middle East & Africa Market Attractiveness Analysis by Application, 2024 to 2034

Figure 226: Middle East & Africa Market Attractiveness Analysis by Route of Administration, 2024 to 2034

Figure 227: Middle East & Africa Market Attractiveness Analysis by Distribution Channel, 2024 to 2034

Figure 228: Middle East & Africa Market Attractiveness Analysis by Country, 2024 to 2034

Figure 229: GCC Countries Market Value Proportion Analysis, 2024

Figure 230: Global Vs GCC Countries Growth Comparison

Figure 231: GCC Countries Market Share Analysis (%) by Drug Class, 2024 to 2034

Figure 232: GCC Countries Market Share Analysis (%) by Application, 2024 to 2034

Figure 233: GCC Countries Market Share Analysis (%) by Route of Administration, 2024 to 2034

Figure 234: GCC Countries Market Share Analysis (%) by Distribution Channel, 2024 to 2034

Figure 235: Turkey Market Value Proportion Analysis, 2024

Figure 236: Global Vs. Turkey Growth Comparison

Figure 237: Turkey Market Share Analysis (%) by Drug Class, 2024 to 2034

Figure 238: Turkey Market Share Analysis (%) by Application, 2024 to 2034

Figure 239: Turkey Market Share Analysis (%) by Route of Administration, 2024 to 2034

Figure 240: Turkey Market Share Analysis (%) by Distribution Channel, 2024 to 2034

Figure 241: South Africa Market Value Proportion Analysis, 2024

Figure 242: Global Vs. South Africa Growth Comparison

Figure 243: South Africa Market Share Analysis (%) by Drug Class, 2024 to 2034

Figure 244: South Africa Market Share Analysis (%) by Application, 2024 to 2034

Figure 245: South Africa Market Share Analysis (%) by Route of Administration, 2024 to 2034

Figure 246: South Africa Market Share Analysis (%) by Distribution Channel, 2024 to 2034

Figure 247: North Africa Market Value Proportion Analysis, 2024

Figure 248: Global Vs North Africa Growth Comparison

Figure 249: North Africa Market Share Analysis (%) by Drug Class, 2024 to 2034

Figure 250: North Africa Market Share Analysis (%) by Application, 2024 to 2034

Figure 251: North Africa Market Share Analysis (%) by Route of Administration, 2024 to 2034

Figure 252: North Africa Market Share Analysis (%) by Distribution Channel, 2024 to 2034

Recommendations

Healthcare

Severe Asthma Treatment Market

Published : February 2023

Healthcare

Bleeding Disorder Testing Market

Published : December 2022

Healthcare

Bronchitis Treatment Market

Published : November 2022

Explore Healthcare Insights

View Reports