Reports

- Global Locations -

Headquarters

Future Market Insights, Inc.

Christiana Corporate, 200
Continental Drive, Suite 401,
Newark, Delaware - 19713,
United States

T: +1-845-579-5705

Americas

Future Market Insights, Inc.

616 Corporate Way, Suite 2-9018,
Valley Cottage, NY 10989, United States

T: +1-347-918-3531

MEA

Future Market Insights

1602-6 Jumeirah Bay X2 Tower, Plot No: JLT-PH2-X2A,
Jumeirah Lakes Towers, Dubai,
United Arab Emirates

Europe

Future Market Insights

3rd Floor, 207 Regent Street,
W1B 3HH London
United Kingdom

T: + 44 (0) 20 8123 9659
D: +44 (0) 20 3287 4268

Asia Pacific

Future Market Insights

IndiaLand Global Tech Park, Unit UG-1, Behind Grand HighStreet, Phase 1, Hinjawadi, MH, Pune – 411057, India

Cystic Fibrosis Therapeutics Market Snapshot (2023 to 2033)

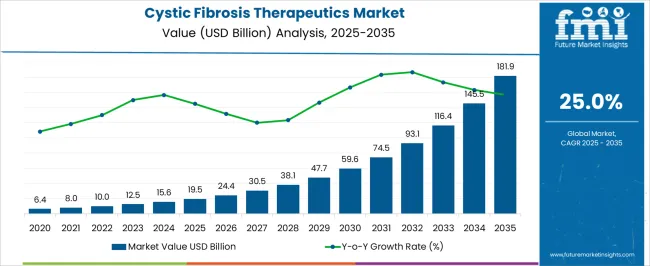
The global Cystic Fibrosis Therapeutics Market size is expected to be valued at US$ 12.5 Billion in 2023. With the implementation of innovative treatment options for early detection, the overall demand for Cystic Fibrosis is projected to grow at a CAGR of 25.0% between 2023 and 2033, totaling around US$ 116.42 Billion by 2033.

Data Points Key Statistics
Cystic Fibrosis Therapeutics Market Value 2023 US$ 12.5 Billion
Cystic Fibrosis Therapeutics Market Projected Value (2033) US$ 116.42 Billion
Cystic Fibrosis Therapeutics Market CAGR (2023 to 2033) 25.0%

According to Netwellness, a community service provider, 3 to 4% of babies are born with genetic disorders. This number is expected to increase in the coming years, especially in the emerging economies of Asia pacific such as India and China, owing to the high birth rate observed in these regions.

Cystic Fibrosis is emerging as the leading genetic disease globally. This often affects multiple organ systems of the body. As per the Cystic Fibrosis Patient Registry, it is estimated that more than 30,000 people are currently suffering from this condition in the US and it is estimated that about 70,000 people are suffering from it across the globe.

Moreover, it is also noted that approximately 1,000 new cases of CF are diagnosed every year. Hence, the rising prevalence of respiratory problems, gastrointestinal complications, as well as reproductive disorders in patients with Cystic Fibrosis is also anticipated to augment the demand for the treatment of the condition over the analysis period.

Additionally, the adoption of advanced treatment options for early detection is raising the patient population for better treatment, which in turn is projected to propel the growth of the cystic fibrosis therapeutics market in the near future.

Don't pay for what you don't need

Customize your report by selecting specific countries or regions and save 30%!

Cystic Fibrosis Demand Analysis (2018 to 2022) Vs Market Outlook (2023 to 2033)

The global demand for Cystic Fibrosis Therapeutics is projected to increase at a CAGR of 25.0% during the forecast period between 2023 and 2033, reaching a total of US$ 116.42 Billion in 2033, according to a report from Future Market Insights (FMI). From 2018 to 2022, sales witnessed significant growth, registering a CAGR of 12.4%.

According to Future Market Insights, a market research and competitive intelligence provider, the Cystic Fibrosis Therapeutics Market was valued at US$ 10.0 Billion in 2022.

The increasing incidence of cystic fibrosis (CF), and the rising treatment rate, are the major factors that are expected to augment the market growth during the forecast period. Also, other factors such as the rise in the number of initiatives undertaken by nonprofit organizations, the rise in Research and Development funding by both private and public organizations, as well as supportive government legislation are also anticipated to accelerate the revenue share of the cystic fibrosis therapeutics market in the forthcoming years.

As per the data published by the Cystic Fibrosis Foundation, the incidence of these hereditary disorders is constantly growing. In 2019, there were more than 70,000 patients living with cystic fibrosis. Increasing year-on-year growth in the number of patients further results in surging demand for efficient and effective CF therapeutics.

Furthermore, a surge in the number of potential clinical pipeline candidates is another factor that is likely to fuel the market growth. In addition, an increase in the number of clinical trials to expand its target patient base with the existing drug portfolio is also among some of the drivers of this market.

The presence of various nonprofit organizations, such as Cystic Fibrosis Worldwide, Cystic Fibrosis Foundation, Cystic Fibrosis Canada, South African Cystic Fibrosis Trust, and South African Cystic Fibrosis Association, which are consistently involved in the activities related to CF is also one of the pivotal factors that can be accounted for surging demand. These organizations are investing huge amounts of funds to find various therapeutics for CF, and to support the research and developmental activities by prominent players.

Which Drivers underpin Cystic Fibrosis Industry Expansion?

Availability of Potential Pipeline Candidates to Fuel the Market Growth

The advent of drugs for the treatment of Cystic Fibrosis is on the new horizon, which is a major factor that is expected to escalate the growth of the market during the analysis period. The emergence of drugs that are targeting the defect in the cells of people suffering from diseases is enhancing market growth. This treatment is projected to be life-changing for many patients, which in turn is influencing the market growth.

Additionally, a surge in the prevalence of the disease is another major factor that is considered to fuel the demand of the market. This, in turn, is propelling the launch of newly formulated pipeline drugs required for the treatment of serious patients. Moreover, many potential candidates are in their final stages of development and are expected to boost the market growth over the forecast period.

Presence of Advanced Treatment Options to Accelerate the Market Growth

The Cystic Fibrosis Therapeutics Market has been triggered, owing to an increasing number of patients suffering from CF globally. Pharmacotherapy of CF has come up with various advancements in the treatment of this condition, which in turn is positively impacting the market growth. In addition, market trends present in the treatment of the disease are fueling the market growth, attributed to the increasing number of pipeline candidates from major companies aiming toward therapeutic care. This in turn is influencing manufacturers to introduce advanced medication targeting CFTR protein abnormalities. Moreover, the launch of Ivacaftor / Lumacaftor, a potentiator that improves the lives of people suffering from the disease, is also stimulating market growth.

Further, the technological improvement by major companies, along with rising Research and Development activities is also aiding this market growth by introducing new products. For instance, the National Research Council launched cystic fibrosis diagnostic smart patch for early diagnosis of the condition. This patch is digitally powered by wireless technology.

Sabyasachi Ghosh
Sabyasachi Ghosh

Principal Consultant

Talk to Analyst

Find your sweet spots for generating winning opportunities in this market.

Which Factors are limiting the Growth of Cystic Fibrosis Therapeutics Market?

Side Effects Associated with CF Drugs to Restrain the Market Growth

Although the growth of the market is observed to be projecting over the years, due to a surge in awareness of the treatment options, an increase in the prevalence of the disease worldwide, an increase in the launch of new drugs, and other developments there are some of the factors that are expected to hinder the market growth.

The products have adverse effects such as upper respiratory tract infection, liver problems, chest pain, increase in blood pressure, and others that might impede the market growth. Moreover, the high cost of the treatment among Cystic Fibrosis patients suffering from a lung transplant, liver transplant, and others is also restraining the market growth.

In addition, prolonged FDA approvals, product recalls, stringent regulations, and others are some of the other factors that are anticipated to limit the Cystic Fibrosis Therapeutics Market.

Existence of Inadequate Income Opportunities Limits the Market Growth

The existence of inadequate income opportunities, as well as high expenditures connected with the treatment, are the major factors that are anticipated to impede the growth of the Cystic Fibrosis Therapeutics Market during the analysis period. Besides, the outline of the generic drugs and patient expiration is expected to further challenge the market growth in the near future.

Moreover, due to the limited information available, extensive research is essential as CF is a rare disease. The research and development cost for CF is very high, leading to the enormous prices of the end products. The high cost of drugs and treatment is another major factor that will limit the growth of the Cystic Fibrosis Therapeutics Market.
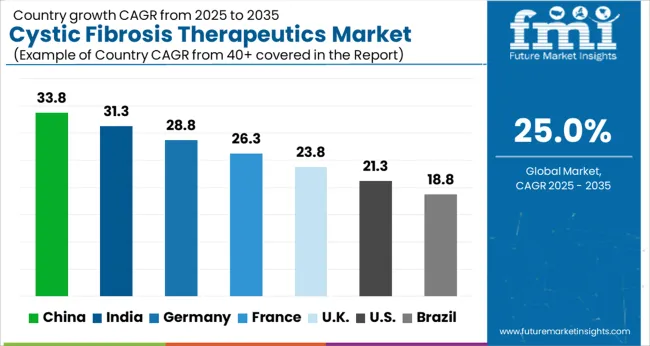
Region-wise Insights

Will North America Continue Dominance in the Global Cystic Fibrosis Therapeutics Market?

The surge in Patients Suffering from CF in the Region to Fuel the Market Growth

The Cystic Fibrosis Therapeutics Market in North America is expected to accumulate the highest market share of 48% in 2023.

Factors such as an increase in CF cases, a surge in patients suffering from various respiratory disorders influencing CF, a rise in Research and Development activities, and a rise in healthcare expenditure are expected to fuel the growth of the cystic fibrosis market during the forecast period. Also, the increasing healthcare expenses, coupled with advanced medical amenities which in turn will further propel the regional market growth in the forthcoming years.

As per the cystic fibrosis foundation (CFF), there are close to 40,000 children and adults living with cystic fibrosis in the United States (and an estimated 105,000 people have been diagnosed with CF across 94 countries), and CF can affect people in every racial and ethnic group. In addition, as per the CFF's national patient registry, the median age of a person with CF is currently 33.4 years. The average life expectancy of CF patients has increased significantly compared to the patients 30 years back. Thus, the increasing prevalence of CF has boosted North America's share in the global Cystic Fibrosis Therapeutics Market.

Additionally, Hopkins University and Medicine researchers developed a novel treatment for a pathogen in December 2020. Mycobacterium abscesses are a pathogen that is drug-resistant and harmful to persons with lung diseases or cystic fibrosis. Hence, all these factors are likely to fuel the regional market growth during the forecast period. The region is expected to hold the highest CAGR of 24.8% during the forecast period.

How Will the Growth of the Cystic Fibrosis Therapeutics Market unfold in Asia Pacific?

Growing Geriatric Patients in the Region to Fuel the Market Growth

The Cystic Fibrosis Therapeutics Market in Asia Pacific is expected to accumulate the highest market share of 47% in 2023.

The Asia Pacific hypophosphatasia market is anticipated to register significant growth during the analysis period, attributed to factors such as an increase in geriatric patients, and high awareness associated with treatment.

Moreover, enlightening of the healthcare amenities will permit the development, which in turn are expected to boost the growth of the Cystic Fibrosis Therapeutics Market in the region in the forecast period. The region is expected to hold the highest CAGR of 24.7% during the forecast period.

Get the data you need at a Fraction of the cost

Personalize your report by choosing insights you need
and save 40%!

Category-wise Insights

By Drug Class, which Cystic Fibrosis Category will remain prominent?

Cystic Fibrosis Transmembrane Conductance (CFTR) Segment to beat Competition in Untiring Market

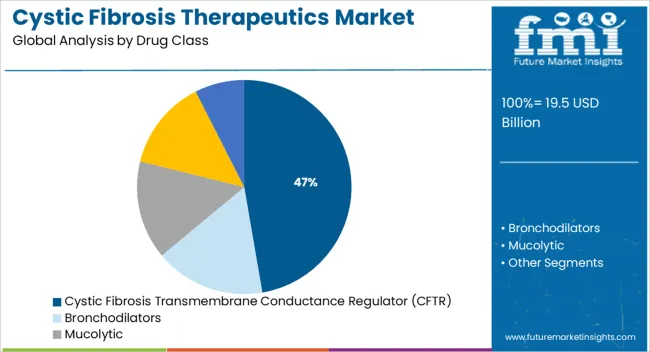
On the basis of drug class, the global Cystic Fibrosis Therapeutics Market is dominated by the Cystic Fibrosis Transmembrane Conductance (CFTR) Segment, which accounts for a share of 48%. The segment is expected to hold a CAGR of 24.8% over the analysis period.

CFTR is considered to be a dominating market, attributed to its functions such as it improves the body’s function at the cellular level, which is considered to be slow, improving the function of CFTR protein, and others. Moreover, advanced therapies of triple combination drugs are also fueling the segment’s growth during the forecast period.

Additionally, factors such as increased usage of CFTR drugs in the treatment of muscle relaxation, airway clearance, and others are other factors that are likely to boost the growth of the CFTR segment. Mucolytics are considered to be important inhaled medications known as mucous thinners, which in turn are augmenting the segment’s growth over the analysis period.

By Route of Administration, which Cystic Fibrosis Category to dominate?

Oral Segment to Drive the Cystic Fibrosis Therapeutics Market

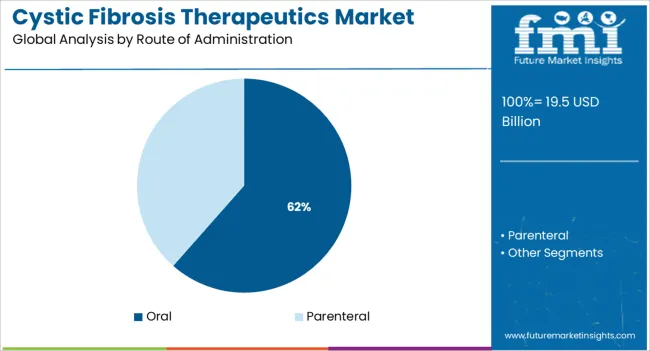
Based on the Route of Administration, the oral segment is expected to witness a significant growth of 47% in 2022, and the trend is expected to continue during the forecast period, expanding at a rapid rate of 24.7% CAGR over the analysis period.

This growth is attributed to factors such as the rise in the adoption of oral drugs globally, and the advent of new formulation drugs that can be consumed easily without the risk of invasive procedures to obtain effective treatment.

Moreover, the parenteral drug segment is anticipated to register significant growth, over the analysis period, attributed to an increased usage of parenteral drugs which include inhaled and injections. Thus, inhaled drugs are widely used by medical practitioners for patients suffering from high-risk respiratory disorders coupled with CF.

The Start-Up Ecosystem: How key Players are opening Frontiers for Future Growth?

Cystic Fibrosis Therapeutics Market startup players are adopting various marketing strategies such as new product launches, geographical expansion, mergers and acquisitions, partnerships, and collaboration to identify the interest of potential patients and create a larger customer base. For instance,
  • Founded in 2011, Translate Bio is a leading mRNA therapeutics company, that develops a new class of potentially transformative medicines to treat diseases caused by protein or gene dysfunction.
  • Galecto Biotech started in 2011, develops galectin modulators for the treatment of severe diseases, including cystic fibrosis and cancer. The company builds on more than 10 years of research into galectins and galectin modulators, which combined with a strong patent estate gives Galecto Biotech a unique platform.
  • Established in 2019, Sionna Therapeutics, a developer of a batch of small molecules will be the first to fully restore function to the cystic fibrosis transmembrane conductance regulator (CFTR) protein.

Who are the Leading Players in the Cystic Fibrosis Therapeutics Market?

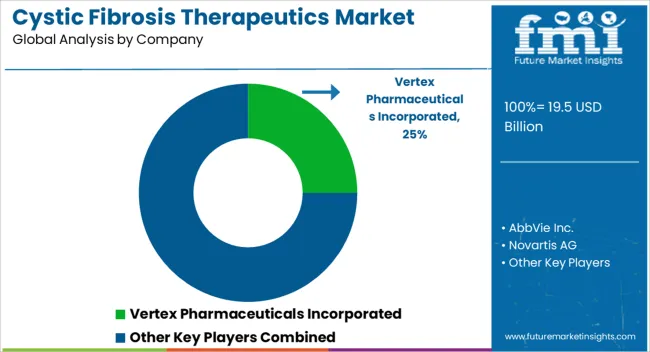
Prominent players in the Cystic Fibrosis Therapeutics Market are Novartis AG, Vertex Pharmaceuticals Incorporated, AbbVie Inc., Gilead Sciences, Inc., Mylan N.V., Pfizer Inc., Bayer AG, Genentech, Inc., and AstraZeneca, among others.

Recent Developments:

  • In December 2022, Vertex Pharmaceuticals Incorporated announced that the US Food and Drug Administration has cleared its Investigational New Drug (IND) application for VX-522, a messenger ribonucleic acid (mRNA) therapy targeted at treating the underlying cause of cystic fibrosis (CF) lung disease for the approximately 5,000 people with CF who cannot benefit from a cystic fibrosis transmembrane conductance regulator (CFTR) modulator. Vertex plans to initiate a single ascending dose clinical trial for VX-522 in people with CF in the coming weeks.
  • In October 2020, Roche and Abbvie announced the partnership and acquired the TMEM 16A product portfolio. It is used in cystic fibrosis with a rare type of CFTR genotype and concerned respiratory illnesses. It helped the firm boost its product of offerings.
  • In April 2019, the US Food and Drug Administration (FDA) approved Vertex Pharmaceuticals Incorporated’s KALYDECO (ivacaftor) with an aim of expanding the range of treatment options for the millions of children living with cystic fibrosis (CF). This allows physicians to begin treating the underlying cause of CF in eligible infants as young as six months of age for the first time, with the potential to modify the course of the disease.

Report Scope

Report Attribute Details
Growth Rate CAGR of 25.0% from 2023 to 2033
Market Value in 2023 US$ 12.5 Billion
Market Value in 2033 US$ 116.42 Billion
Base Year for Estimation 2022
Historical Data 2018 to 2022
Forecast Period 2023 to 2033
Quantitative Units Revenue in US$ Billion and CAGR from 2023 to 2033
Report Coverage Revenue Forecast, Company Ranking, Competitive Landscape, Growth Factors, Trends, and Pricing Analysis
Segments Covered
  • Drug Class
  • Route of Administration
  • Distribution Channel
  • Region
Regions Covered
  • North America
  • Europe
  • Asia Pacific
  • Latin America
  • Middle East & Africa (MEA)
Key Countries Profiled
  • The USA
  • Canada
  • Brazil
  • Mexico
  • Germany
  • The UK
  • France
  • Spain
  • Italy
  • China
  • Japan
  • South Korea
  • Malaysia
  • Singapore
  • Australia
  • New Zealand
  • GCC
  • South Africa
  • Israel
Key Companies Profiled
  • Novartis AG
  • Vertex Pharmaceuticals Incorporated
  • AbbVie Inc.
  • Gilead Sciences, Inc.
  • Mylan N.V.
  • Pfizer Inc.
  • Bayer AG
  • Genentech, Inc.
  • AstraZeneca

Key Segments Covered in the Cystic Fibrosis Industry Analysis

Cystic Fibrosis Therapeutics Market by Drug Class:

  • Cystic Fibrosis Transmembrane Conductance Regulator (CFTR)
  • Bronchodilators
  • Mucolytic
  • Pancreatic Enzyme Supplement
  • Others

Cystic Fibrosis Therapeutics Market by Route of Administration:

  • Oral
  • Parenteral

Cystic Fibrosis Therapeutics Market by Distribution Channel:

  • Retail Pharmacies & Drug Stores
  • Online Pharmacies
  • Hospital Pharmacies

Cystic Fibrosis Therapeutics Market by Region:

  • North America
  • Europe
  • Asia Pacific
  • Latin America
  • Middle East & Africa (MEA)

Frequently Asked Questions

What was the market value for Cystic Fibrosis in 2022?

As of 2022, the market for Cystic Fibrosis was valued at US$ 10.0 Billion, as per FMI

At what value did the Cystic Fibrosis Therapeutics Market close in 2023?

By 2023-end, sales of Cystic Fibrosis closed at a value of US$ 12.5 Billion

What was the last 4 years value CAGR for Cystic Fibrosis?

From 2018 to 2022, Cystic Fibrosis demand expanded at a CAGR of 12.4%

What is the projected forecast CAGR for the Cystic Fibrosis Industry from 2023 to 2033?

From 2023 to 2033, Cystic Fibrosis sales are expected to flourish at a CAGR of 25.0%

According to FMI, what is the anticipated market value for Cystic Fibrosis in 2033?

By 2033, the market value of Cystic Fibrosis is expected to reach US$ 116.42 Billion.

By Drug Class, which category ranks first with regard to Cystic Fibrosis?

By Drug Class, the Cystic Fibrosis Transmembrane Conductance (CFTR) segment constitutes the bulk of the market share of 48% in 2022.

By Route of Administration, which category ranks first with regard to Cystic Fibrosis?

By Route of Administration, the Oral segment dominates the market with a share of 47% in 2022.

Table of Content

1. Executive Summary | Cystic Fibrosis Therapeutics Market

    1.1. Global Market Outlook

    1.2. Demand-side Trends

    1.3. Supply-side Trends

    1.4. Technology Roadmap Analysis

    1.5. Analysis and Recommendations

2. Market Overview

    2.1. Market Coverage / Taxonomy

    2.2. Market Definition / Scope / Limitations

3. Market Background

    3.1. Market Dynamics

        3.1.1. Drivers

        3.1.2. Restraints

        3.1.3. Opportunity

        3.1.4. Trends

    3.2. Scenario Forecast

        3.2.1. Demand in Optimistic Scenario

        3.2.2. Demand in Likely Scenario

        3.2.3. Demand in Conservative Scenario

    3.3. Opportunity Map Analysis

    3.4. Investment Feasibility Matrix

    3.5. PESTLE and Porter’s Analysis

    3.6. Regulatory Landscape

        3.6.1. By Key Regions

        3.6.2. By Key Countries

    3.7. Regional Parent Market Outlook

4. Global Market Analysis 2018 to 2022 and Forecast, 2023 to 2033

    4.1. Historical Market Size Value (US$ Billion) Analysis, 2018 to 2022

    4.2. Current and Future Market Size Value (US$ Billion) Projections, 2023 to 2033

        4.2.1. Y-o-Y Growth Trend Analysis

        4.2.2. Absolute $ Opportunity Analysis

5. Global Market Analysis 2018 to 2022 and Forecast 2023 to 2033, By Drug Class

    5.1. Introduction / Key Findings

    5.2. Historical Market Size Value (US$ Billion) Analysis By Drug Class, 2018 to 2022

    5.3. Current and Future Market Size Value (US$ Billion) Analysis and Forecast By Drug Class, 2023 to 2033

        5.3.1. Transmembrane Conductance Regulator

        5.3.2. Bronchodilators

        5.3.3. Mucolytic

        5.3.4. Pancreatic Enzyme Supplement

        5.3.5. Others

    5.4. Y-o-Y Growth Trend Analysis By Drug Class, 2018 to 2022

    5.5. Absolute $ Opportunity Analysis By Drug Class, 2023 to 2033

6. Global Market Analysis 2018 to 2022 and Forecast 2023 to 2033, By Route of Administration

    6.1. Introduction / Key Findings

    6.2. Historical Market Size Value (US$ Billion) Analysis By Route of Administration, 2018 to 2022

    6.3. Current and Future Market Size Value (US$ Billion) Analysis and Forecast By Route of Administration, 2023 to 2033

        6.3.1. Oral

        6.3.2. Parenteral

    6.4. Y-o-Y Growth Trend Analysis By Route of Administration, 2018 to 2022

    6.5. Absolute $ Opportunity Analysis By Route of Administration, 2023 to 2033

7. Global Market Analysis 2018 to 2022 and Forecast 2023 to 2033, By Distribution Channel

    7.1. Introduction / Key Findings

    7.2. Historical Market Size Value (US$ Billion) Analysis By Distribution Channel, 2018 to 2022

    7.3. Current and Future Market Size Value (US$ Billion) Analysis and Forecast By Distribution Channel, 2023 to 2033

        7.3.1. Retail Pharmacies & Drug Stores

        7.3.2. Online Pharmacies

        7.3.3. Hospital Pharmacies

    7.4. Y-o-Y Growth Trend Analysis By Distribution Channel, 2018 to 2022

    7.5. Absolute $ Opportunity Analysis By Distribution Channel, 2023 to 2033

8. Global Market Analysis 2018 to 2022 and Forecast 2023 to 2033, By Region

    8.1. Introduction

    8.2. Historical Market Size Value (US$ Billion) Analysis By Region, 2018 to 2022

    8.3. Current Market Size Value (US$ Billion) Analysis and Forecast By Region, 2023 to 2033

        8.3.1. North America

        8.3.2. Latin America

        8.3.3. Europe

        8.3.4. Asia Pacific

        8.3.5. Middle East & Africa (MEA)

    8.4. Market Attractiveness Analysis By Region

9. North America Market Analysis 2018 to 2022 and Forecast 2023 to 2033, By Country

    9.1. Historical Market Size Value (US$ Billion) Trend Analysis By Market Taxonomy, 2018 to 2022

    9.2. Market Size Value (US$ Billion) Forecast By Market Taxonomy, 2023 to 2033

        9.2.1. By Country

            9.2.1.1. The US

            9.2.1.2. Canada

        9.2.2. By Drug Class

        9.2.3. By Route of Administration

        9.2.4. By Distribution Channel

    9.3. Market Attractiveness Analysis

        9.3.1. By Country

        9.3.2. By Drug Class

        9.3.3. By Route of Administration

        9.3.4. By Distribution Channel

    9.4. Key Takeaways

10. Latin America Market Analysis 2018 to 2022 and Forecast 2023 to 2033, By Country

    10.1. Historical Market Size Value (US$ Billion) Trend Analysis By Market Taxonomy, 2018 to 2022

    10.2. Market Size Value (US$ Billion) Forecast By Market Taxonomy, 2023 to 2033

        10.2.1. By Country

            10.2.1.1. Brazil

            10.2.1.2. Mexico

            10.2.1.3. Rest of Latin America

        10.2.2. By Drug Class

        10.2.3. By Route of Administration

        10.2.4. By Distribution Channel

    10.3. Market Attractiveness Analysis

        10.3.1. By Country

        10.3.2. By Drug Class

        10.3.3. By Route of Administration

        10.3.4. By Distribution Channel

    10.4. Key Takeaways

11. Europe Market Analysis 2018 to 2022 and Forecast 2023 to 2033, By Country

    11.1. Historical Market Size Value (US$ Billion) Trend Analysis By Market Taxonomy, 2018 to 2022

    11.2. Market Size Value (US$ Billion) Forecast By Market Taxonomy, 2023 to 2033

        11.2.1. By Country

            11.2.1.1. Germany

            11.2.1.2. The UK

            11.2.1.3. France

            11.2.1.4. Spain

            11.2.1.5. Italy

            11.2.1.6. Rest of Europe

        11.2.2. By Drug Class

        11.2.3. By Route of Administration

        11.2.4. By Distribution Channel

    11.3. Market Attractiveness Analysis

        11.3.1. By Country

        11.3.2. By Drug Class

        11.3.3. By Route of Administration

        11.3.4. By Distribution Channel

    11.4. Key Takeaways

12. Asia Pacific Market Analysis 2018 to 2022 and Forecast 2023 to 2033, By Country

    12.1. Historical Market Size Value (US$ Billion) Trend Analysis By Market Taxonomy, 2018 to 2022

    12.2. Market Size Value (US$ Billion) Forecast By Market Taxonomy, 2023 to 2033

        12.2.1. By Country

            12.2.1.1. China

            12.2.1.2. Japan

            12.2.1.3. South Korea

            12.2.1.4. Singapore

            12.2.1.5. Thailand

            12.2.1.6. Indonesia

            12.2.1.7. Australia

            12.2.1.8. New Zealand

            12.2.1.9. Rest of Asia Pacific

        12.2.2. By Drug Class

        12.2.3. By Route of Administration

        12.2.4. By Distribution Channel

    12.3. Market Attractiveness Analysis

        12.3.1. By Country

        12.3.2. By Drug Class

        12.3.3. By Route of Administration

        12.3.4. By Distribution Channel

    12.4. Key Takeaways

13. MEA Market Analysis 2018 to 2022 and Forecast 2023 to 2033, By Country

    13.1. Historical Market Size Value (US$ Billion) Trend Analysis By Market Taxonomy, 2018 to 2022

    13.2. Market Size Value (US$ Billion) Forecast By Market Taxonomy, 2023 to 2033

        13.2.1. By Country

            13.2.1.1. GCC Countries

            13.2.1.2. South Africa

            13.2.1.3. Israel

            13.2.1.4. Rest of MEA

        13.2.2. By Drug Class

        13.2.3. By Route of Administration

        13.2.4. By Distribution Channel

    13.3. Market Attractiveness Analysis

        13.3.1. By Country

        13.3.2. By Drug Class

        13.3.3. By Route of Administration

        13.3.4. By Distribution Channel

    13.4. Key Takeaways

14. Key Countries Market Analysis

    14.1. The US

        14.1.1. Pricing Analysis

        14.1.2. Market Share Analysis, 2022

            14.1.2.1. By Drug Class

            14.1.2.2. By Route of Administration

            14.1.2.3. By Distribution Channel

    14.2. Canada

        14.2.1. Pricing Analysis

        14.2.2. Market Share Analysis, 2022

            14.2.2.1. By Drug Class

            14.2.2.2. By Route of Administration

            14.2.2.3. By Distribution Channel

    14.3. Brazil

        14.3.1. Pricing Analysis

        14.3.2. Market Share Analysis, 2022

            14.3.2.1. By Drug Class

            14.3.2.2. By Route of Administration

            14.3.2.3. By Distribution Channel

    14.4. Mexico

        14.4.1. Pricing Analysis

        14.4.2. Market Share Analysis, 2022

            14.4.2.1. By Drug Class

            14.4.2.2. By Route of Administration

            14.4.2.3. By Distribution Channel

    14.5. Germany

        14.5.1. Pricing Analysis

        14.5.2. Market Share Analysis, 2022

            14.5.2.1. By Drug Class

            14.5.2.2. By Route of Administration

            14.5.2.3. By Distribution Channel

    14.6. The UK

        14.6.1. Pricing Analysis

        14.6.2. Market Share Analysis, 2022

            14.6.2.1. By Drug Class

            14.6.2.2. By Route of Administration

            14.6.2.3. By Distribution Channel

    14.7. France

        14.7.1. Pricing Analysis

        14.7.2. Market Share Analysis, 2022

            14.7.2.1. By Drug Class

            14.7.2.2. By Route of Administration

            14.7.2.3. By Distribution Channel

    14.8. Spain

        14.8.1. Pricing Analysis

        14.8.2. Market Share Analysis, 2022

            14.8.2.1. By Drug Class

            14.8.2.2. By Route of Administration

            14.8.2.3. By Distribution Channel

    14.9. Italy

        14.9.1. Pricing Analysis

        14.9.2. Market Share Analysis, 2022

            14.9.2.1. By Drug Class

            14.9.2.2. By Route of Administration

            14.9.2.3. By Distribution Channel

    14.10. China

        14.10.1. Pricing Analysis

        14.10.2. Market Share Analysis, 2022

            14.10.2.1. By Drug Class

            14.10.2.2. By Route of Administration

            14.10.2.3. By Distribution Channel

    14.11. Japan

        14.11.1. Pricing Analysis

        14.11.2. Market Share Analysis, 2022

            14.11.2.1. By Drug Class

            14.11.2.2. By Route of Administration

            14.11.2.3. By Distribution Channel

    14.12. South Korea

        14.12.1. Pricing Analysis

        14.12.2. Market Share Analysis, 2022

            14.12.2.1. By Drug Class

            14.12.2.2. By Route of Administration

            14.12.2.3. By Distribution Channel

    14.13. Singapore

        14.13.1. Pricing Analysis

        14.13.2. Market Share Analysis, 2022

            14.13.2.1. By Drug Class

            14.13.2.2. By Route of Administration

            14.13.2.3. By Distribution Channel

    14.14. Thailand

        14.14.1. Pricing Analysis

        14.14.2. Market Share Analysis, 2022

            14.14.2.1. By Drug Class

            14.14.2.2. By Route of Administration

            14.14.2.3. By Distribution Channel

    14.15. Indonesia

        14.15.1. Pricing Analysis

        14.15.2. Market Share Analysis, 2022

            14.15.2.1. By Drug Class

            14.15.2.2. By Route of Administration

            14.15.2.3. By Distribution Channel

    14.16. Australia

        14.16.1. Pricing Analysis

        14.16.2. Market Share Analysis, 2022

            14.16.2.1. By Drug Class

            14.16.2.2. By Route of Administration

            14.16.2.3. By Distribution Channel

    14.17. New Zealand

        14.17.1. Pricing Analysis

        14.17.2. Market Share Analysis, 2022

            14.17.2.1. By Drug Class

            14.17.2.2. By Route of Administration

            14.17.2.3. By Distribution Channel

    14.18. GCC Countries

        14.18.1. Pricing Analysis

        14.18.2. Market Share Analysis, 2022

            14.18.2.1. By Drug Class

            14.18.2.2. By Route of Administration

            14.18.2.3. By Distribution Channel

    14.19. South Africa

        14.19.1. Pricing Analysis

        14.19.2. Market Share Analysis, 2022

            14.19.2.1. By Drug Class

            14.19.2.2. By Route of Administration

            14.19.2.3. By Distribution Channel

    14.20. Israel

        14.20.1. Pricing Analysis

        14.20.2. Market Share Analysis, 2022

            14.20.2.1. By Drug Class

            14.20.2.2. By Route of Administration

            14.20.2.3. By Distribution Channel

15. Market Structure Analysis

    15.1. Competition Dashboard

    15.2. Competition Benchmarking

    15.3. Market Share Analysis of Top Players

        15.3.1. By Regional

        15.3.2. By Drug Class

        15.3.3. By Route of Administration

        15.3.4. By Distribution Channel

16. Competition Analysis

    16.1. Competition Deep Dive

        16.1.1. Vertex Pharmaceuticals Incorporated

            16.1.1.1. Overview

            16.1.1.2. Product Portfolio

            16.1.1.3. Profitability by Market Segments

            16.1.1.4. Sales Footprint

            16.1.1.5. Strategy Overview

                16.1.1.5.1. Marketing Strategy

        16.1.2. AbbVie Inc.

            16.1.2.1. Overview

            16.1.2.2. Product Portfolio

            16.1.2.3. Profitability by Market Segments

            16.1.2.4. Sales Footprint

            16.1.2.5. Strategy Overview

                16.1.2.5.1. Marketing Strategy

        16.1.3. Novartis AG

            16.1.3.1. Overview

            16.1.3.2. Product Portfolio

            16.1.3.3. Profitability by Market Segments

            16.1.3.4. Sales Footprint

            16.1.3.5. Strategy Overview

                16.1.3.5.1. Marketing Strategy

        16.1.4. Gilead Lifesciences, Inc.

            16.1.4.1. Overview

            16.1.4.2. Product Portfolio

            16.1.4.3. Profitability by Market Segments

            16.1.4.4. Sales Footprint

            16.1.4.5. Strategy Overview

                16.1.4.5.1. Marketing Strategy

        16.1.5. Viatris

            16.1.5.1. Overview

            16.1.5.2. Product Portfolio

            16.1.5.3. Profitability by Market Segments

            16.1.5.4. Sales Footprint

            16.1.5.5. Strategy Overview

                16.1.5.5.1. Marketing Strategy

        16.1.6. Pfizer Inc.

            16.1.6.1. Overview

            16.1.6.2. Product Portfolio

            16.1.6.3. Profitability by Market Segments

            16.1.6.4. Sales Footprint

            16.1.6.5. Strategy Overview

                16.1.6.5.1. Marketing Strategy

        16.1.7. Bayer AG

            16.1.7.1. Overview

            16.1.7.2. Product Portfolio

            16.1.7.3. Profitability by Market Segments

            16.1.7.4. Sales Footprint

            16.1.7.5. Strategy Overview

                16.1.7.5.1. Marketing Strategy

        16.1.8. Genentech Inc.

            16.1.8.1. Overview

            16.1.8.2. Product Portfolio

            16.1.8.3. Profitability by Market Segments

            16.1.8.4. Sales Footprint

            16.1.8.5. Strategy Overview

                16.1.8.5.1. Marketing Strategy

        16.1.9. AstraZeneca

            16.1.9.1. Overview

            16.1.9.2. Product Portfolio

            16.1.9.3. Profitability by Market Segments

            16.1.9.4. Sales Footprint

            16.1.9.5. Strategy Overview

                16.1.9.5.1. Marketing Strategy

        16.1.10. Allergen Plc

            16.1.10.1. Overview

            16.1.10.2. Product Portfolio

            16.1.10.3. Profitability by Market Segments

            16.1.10.4. Sales Footprint

            16.1.10.5. Strategy Overview

                16.1.10.5.1. Marketing Strategy

17. Assumptions & Acronyms Used

18. Research Methodology

Don't pay for what you don't need

Customize your report by selecting specific countries or regions and save 30%!

List of Tables

Table 1: Global Market Value (US$ Billion) Forecast by Region, 2018 to 2033

Table 2: Global Market Value (US$ Billion) Forecast by Drug Class, 2018 to 2033

Table 3: Global Market Value (US$ Billion) Forecast by Route of Administration, 2018 to 2033

Table 4: Global Market Value (US$ Billion) Forecast by Distribution Channel, 2018 to 2033

Table 5: North America Market Value (US$ Billion) Forecast by Country, 2018 to 2033

Table 6: North America Market Value (US$ Billion) Forecast by Drug Class, 2018 to 2033

Table 7: North America Market Value (US$ Billion) Forecast by Route of Administration, 2018 to 2033

Table 8: North America Market Value (US$ Billion) Forecast by Distribution Channel, 2018 to 2033

Table 9: Latin America Market Value (US$ Billion) Forecast by Country, 2018 to 2033

Table 10: Latin America Market Value (US$ Billion) Forecast by Drug Class, 2018 to 2033

Table 11: Latin America Market Value (US$ Billion) Forecast by Route of Administration, 2018 to 2033

Table 12: Latin America Market Value (US$ Billion) Forecast by Distribution Channel, 2018 to 2033

Table 13: Europe Market Value (US$ Billion) Forecast by Country, 2018 to 2033

Table 14: Europe Market Value (US$ Billion) Forecast by Drug Class, 2018 to 2033

Table 15: Europe Market Value (US$ Billion) Forecast by Route of Administration, 2018 to 2033

Table 16: Europe Market Value (US$ Billion) Forecast by Distribution Channel, 2018 to 2033

Table 17: Asia Pacific Market Value (US$ Billion) Forecast by Country, 2018 to 2033

Table 18: Asia Pacific Market Value (US$ Billion) Forecast by Drug Class, 2018 to 2033

Table 19: Asia Pacific Market Value (US$ Billion) Forecast by Route of Administration, 2018 to 2033

Table 20: Asia Pacific Market Value (US$ Billion) Forecast by Distribution Channel, 2018 to 2033

Table 21: MEA Market Value (US$ Billion) Forecast by Country, 2018 to 2033

Table 22: MEA Market Value (US$ Billion) Forecast by Drug Class, 2018 to 2033

Table 23: MEA Market Value (US$ Billion) Forecast by Route of Administration, 2018 to 2033

Table 24: MEA Market Value (US$ Billion) Forecast by Distribution Channel, 2018 to 2033
Sabyasachi Ghosh
Sabyasachi Ghosh

Principal Consultant

Talk to Analyst

Find your sweet spots for generating winning opportunities in this market.

List of Charts

Figure 1: Global Market Value (US$ Billion) by Drug Class, 2023 to 2033

Figure 2: Global Market Value (US$ Billion) by Route of Administration, 2023 to 2033

Figure 3: Global Market Value (US$ Billion) by Distribution Channel, 2023 to 2033

Figure 4: Global Market Value (US$ Billion) by Region, 2023 to 2033

Figure 5: Global Market Value (US$ Billion) Analysis by Region, 2018 to 2033

Figure 6: Global Market Value Share (%) and BPS Analysis by Region, 2023 to 2033

Figure 7: Global Market Y-o-Y Growth (%) Projections by Region, 2023 to 2033

Figure 8: Global Market Value (US$ Billion) Analysis by Drug Class, 2018 to 2033

Figure 9: Global Market Value Share (%) and BPS Analysis by Drug Class, 2023 to 2033

Figure 10: Global Market Y-o-Y Growth (%) Projections by Drug Class, 2023 to 2033

Figure 11: Global Market Value (US$ Billion) Analysis by Route of Administration, 2018 to 2033

Figure 12: Global Market Value Share (%) and BPS Analysis by Route of Administration, 2023 to 2033

Figure 13: Global Market Y-o-Y Growth (%) Projections by Route of Administration, 2023 to 2033

Figure 14: Global Market Value (US$ Billion) Analysis by Distribution Channel, 2018 to 2033

Figure 15: Global Market Value Share (%) and BPS Analysis by Distribution Channel, 2023 to 2033

Figure 16: Global Market Y-o-Y Growth (%) Projections by Distribution Channel, 2023 to 2033

Figure 17: Global Market Attractiveness by Drug Class, 2023 to 2033

Figure 18: Global Market Attractiveness by Route of Administration, 2023 to 2033

Figure 19: Global Market Attractiveness by Distribution Channel, 2023 to 2033

Figure 20: Global Market Attractiveness by Region, 2023 to 2033

Figure 21: North America Market Value (US$ Billion) by Drug Class, 2023 to 2033

Figure 22: North America Market Value (US$ Billion) by Route of Administration, 2023 to 2033

Figure 23: North America Market Value (US$ Billion) by Distribution Channel, 2023 to 2033

Figure 24: North America Market Value (US$ Billion) by Country, 2023 to 2033

Figure 25: North America Market Value (US$ Billion) Analysis by Country, 2018 to 2033

Figure 26: North America Market Value Share (%) and BPS Analysis by Country, 2023 to 2033

Figure 27: North America Market Y-o-Y Growth (%) Projections by Country, 2023 to 2033

Figure 28: North America Market Value (US$ Billion) Analysis by Drug Class, 2018 to 2033

Figure 29: North America Market Value Share (%) and BPS Analysis by Drug Class, 2023 to 2033

Figure 30: North America Market Y-o-Y Growth (%) Projections by Drug Class, 2023 to 2033

Figure 31: North America Market Value (US$ Billion) Analysis by Route of Administration, 2018 to 2033

Figure 32: North America Market Value Share (%) and BPS Analysis by Route of Administration, 2023 to 2033

Figure 33: North America Market Y-o-Y Growth (%) Projections by Route of Administration, 2023 to 2033

Figure 34: North America Market Value (US$ Billion) Analysis by Distribution Channel, 2018 to 2033

Figure 35: North America Market Value Share (%) and BPS Analysis by Distribution Channel, 2023 to 2033

Figure 36: North America Market Y-o-Y Growth (%) Projections by Distribution Channel, 2023 to 2033

Figure 37: North America Market Attractiveness by Drug Class, 2023 to 2033

Figure 38: North America Market Attractiveness by Route of Administration, 2023 to 2033

Figure 39: North America Market Attractiveness by Distribution Channel, 2023 to 2033

Figure 40: North America Market Attractiveness by Country, 2023 to 2033

Figure 41: Latin America Market Value (US$ Billion) by Drug Class, 2023 to 2033

Figure 42: Latin America Market Value (US$ Billion) by Route of Administration, 2023 to 2033

Figure 43: Latin America Market Value (US$ Billion) by Distribution Channel, 2023 to 2033

Figure 44: Latin America Market Value (US$ Billion) by Country, 2023 to 2033

Figure 45: Latin America Market Value (US$ Billion) Analysis by Country, 2018 to 2033

Figure 46: Latin America Market Value Share (%) and BPS Analysis by Country, 2023 to 2033

Figure 47: Latin America Market Y-o-Y Growth (%) Projections by Country, 2023 to 2033

Figure 48: Latin America Market Value (US$ Billion) Analysis by Drug Class, 2018 to 2033

Figure 49: Latin America Market Value Share (%) and BPS Analysis by Drug Class, 2023 to 2033

Figure 50: Latin America Market Y-o-Y Growth (%) Projections by Drug Class, 2023 to 2033

Figure 51: Latin America Market Value (US$ Billion) Analysis by Route of Administration, 2018 to 2033

Figure 52: Latin America Market Value Share (%) and BPS Analysis by Route of Administration, 2023 to 2033

Figure 53: Latin America Market Y-o-Y Growth (%) Projections by Route of Administration, 2023 to 2033

Figure 54: Latin America Market Value (US$ Billion) Analysis by Distribution Channel, 2018 to 2033

Figure 55: Latin America Market Value Share (%) and BPS Analysis by Distribution Channel, 2023 to 2033

Figure 56: Latin America Market Y-o-Y Growth (%) Projections by Distribution Channel, 2023 to 2033

Figure 57: Latin America Market Attractiveness by Drug Class, 2023 to 2033

Figure 58: Latin America Market Attractiveness by Route of Administration, 2023 to 2033

Figure 59: Latin America Market Attractiveness by Distribution Channel, 2023 to 2033

Figure 60: Latin America Market Attractiveness by Country, 2023 to 2033

Figure 61: Europe Market Value (US$ Billion) by Drug Class, 2023 to 2033

Figure 62: Europe Market Value (US$ Billion) by Route of Administration, 2023 to 2033

Figure 63: Europe Market Value (US$ Billion) by Distribution Channel, 2023 to 2033

Figure 64: Europe Market Value (US$ Billion) by Country, 2023 to 2033

Figure 65: Europe Market Value (US$ Billion) Analysis by Country, 2018 to 2033

Figure 66: Europe Market Value Share (%) and BPS Analysis by Country, 2023 to 2033

Figure 67: Europe Market Y-o-Y Growth (%) Projections by Country, 2023 to 2033

Figure 68: Europe Market Value (US$ Billion) Analysis by Drug Class, 2018 to 2033

Figure 69: Europe Market Value Share (%) and BPS Analysis by Drug Class, 2023 to 2033

Figure 70: Europe Market Y-o-Y Growth (%) Projections by Drug Class, 2023 to 2033

Figure 71: Europe Market Value (US$ Billion) Analysis by Route of Administration, 2018 to 2033

Figure 72: Europe Market Value Share (%) and BPS Analysis by Route of Administration, 2023 to 2033

Figure 73: Europe Market Y-o-Y Growth (%) Projections by Route of Administration, 2023 to 2033

Figure 74: Europe Market Value (US$ Billion) Analysis by Distribution Channel, 2018 to 2033

Figure 75: Europe Market Value Share (%) and BPS Analysis by Distribution Channel, 2023 to 2033

Figure 76: Europe Market Y-o-Y Growth (%) Projections by Distribution Channel, 2023 to 2033

Figure 77: Europe Market Attractiveness by Drug Class, 2023 to 2033

Figure 78: Europe Market Attractiveness by Route of Administration, 2023 to 2033

Figure 79: Europe Market Attractiveness by Distribution Channel, 2023 to 2033

Figure 80: Europe Market Attractiveness by Country, 2023 to 2033

Figure 81: Asia Pacific Market Value (US$ Billion) by Drug Class, 2023 to 2033

Figure 82: Asia Pacific Market Value (US$ Billion) by Route of Administration, 2023 to 2033

Figure 83: Asia Pacific Market Value (US$ Billion) by Distribution Channel, 2023 to 2033

Figure 84: Asia Pacific Market Value (US$ Billion) by Country, 2023 to 2033

Figure 85: Asia Pacific Market Value (US$ Billion) Analysis by Country, 2018 to 2033

Figure 86: Asia Pacific Market Value Share (%) and BPS Analysis by Country, 2023 to 2033

Figure 87: Asia Pacific Market Y-o-Y Growth (%) Projections by Country, 2023 to 2033

Figure 88: Asia Pacific Market Value (US$ Billion) Analysis by Drug Class, 2018 to 2033

Figure 89: Asia Pacific Market Value Share (%) and BPS Analysis by Drug Class, 2023 to 2033

Figure 90: Asia Pacific Market Y-o-Y Growth (%) Projections by Drug Class, 2023 to 2033

Figure 91: Asia Pacific Market Value (US$ Billion) Analysis by Route of Administration, 2018 to 2033

Figure 92: Asia Pacific Market Value Share (%) and BPS Analysis by Route of Administration, 2023 to 2033

Figure 93: Asia Pacific Market Y-o-Y Growth (%) Projections by Route of Administration, 2023 to 2033

Figure 94: Asia Pacific Market Value (US$ Billion) Analysis by Distribution Channel, 2018 to 2033

Figure 95: Asia Pacific Market Value Share (%) and BPS Analysis by Distribution Channel, 2023 to 2033

Figure 96: Asia Pacific Market Y-o-Y Growth (%) Projections by Distribution Channel, 2023 to 2033

Figure 97: Asia Pacific Market Attractiveness by Drug Class, 2023 to 2033

Figure 98: Asia Pacific Market Attractiveness by Route of Administration, 2023 to 2033

Figure 99: Asia Pacific Market Attractiveness by Distribution Channel, 2023 to 2033

Figure 100: Asia Pacific Market Attractiveness by Country, 2023 to 2033

Figure 101: MEA Market Value (US$ Billion) by Drug Class, 2023 to 2033

Figure 102: MEA Market Value (US$ Billion) by Route of Administration, 2023 to 2033

Figure 103: MEA Market Value (US$ Billion) by Distribution Channel, 2023 to 2033

Figure 104: MEA Market Value (US$ Billion) by Country, 2023 to 2033

Figure 105: MEA Market Value (US$ Billion) Analysis by Country, 2018 to 2033

Figure 106: MEA Market Value Share (%) and BPS Analysis by Country, 2023 to 2033

Figure 107: MEA Market Y-o-Y Growth (%) Projections by Country, 2023 to 2033

Figure 108: MEA Market Value (US$ Billion) Analysis by Drug Class, 2018 to 2033

Figure 109: MEA Market Value Share (%) and BPS Analysis by Drug Class, 2023 to 2033

Figure 110: MEA Market Y-o-Y Growth (%) Projections by Drug Class, 2023 to 2033

Figure 111: MEA Market Value (US$ Billion) Analysis by Route of Administration, 2018 to 2033

Figure 112: MEA Market Value Share (%) and BPS Analysis by Route of Administration, 2023 to 2033

Figure 113: MEA Market Y-o-Y Growth (%) Projections by Route of Administration, 2023 to 2033

Figure 114: MEA Market Value (US$ Billion) Analysis by Distribution Channel, 2018 to 2033

Figure 115: MEA Market Value Share (%) and BPS Analysis by Distribution Channel, 2023 to 2033

Figure 116: MEA Market Y-o-Y Growth (%) Projections by Distribution Channel, 2023 to 2033

Figure 117: MEA Market Attractiveness by Drug Class, 2023 to 2033

Figure 118: MEA Market Attractiveness by Route of Administration, 2023 to 2033

Figure 119: MEA Market Attractiveness by Distribution Channel, 2023 to 2033

Figure 120: MEA Market Attractiveness by Country, 2023 to 2033

Recommendations

Healthcare

Cancer Tissue Diagnostic Market

Published : April 2024

Healthcare

Cancer Diagnostics Market

Published : August 2023

Healthcare

Radiation-Induced Fibrosis Treatment Market

Published : June 2023

Healthcare

Cancer Biological Therapy Market

Published : December 2022

Explore Healthcare Insights

View Reports

Cystic Fibrosis Therapeutics Market