Advanced Therapeutics Pharmaceutical Outsourcing Market Outlook from 2024 to 2034

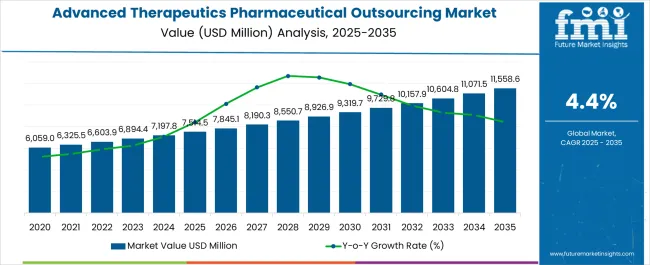
The global advanced therapeutics pharmaceutical outsourcing market is expected to grow at a CAGR of 4.4% during the assessment period from 2024 to 2034. The market value is projected to increase from USD 7,592.8 million in 2024 to USD 11,698.1 million by 2034. The advanced therapeutics pharmaceutical outsourcing market was valued at USD 7,197.8 million in 2023 and is anticipated to exhibit a y-o-y growth of 4.5% in 2024.

Attributes Key Insights
Advanced Therapeutics Pharmaceutical Outsourcing Market Size in 2023 USD 7,197.8 million
Estimated Advanced Therapeutics Pharmaceutical Outsourcing Market Value (2024E) USD 7,592.8 million
Projected Advanced Therapeutics Pharmaceutical Outsourcing Market Revenue (2034F) USD 11,698.1 million
Value-based CAGR (2024 to 2034) 4.4%

The increasing complexity of advanced therapeutic modalities, such as gene editing, cell therapy, and mRNA-based drugs, requires specialized knowledge and sophisticated manufacturing capabilities. Pharmaceutical companies are turning to outsourcing partners with advanced technical expertise to navigate the complexities of these novel therapies.

The growing pipeline of advanced therapeutic products, driven by breakthroughs in biotechnology and genomics, has led to a surging demand for outsourcing services. As pharmaceutical companies focus on expanding their portfolios with innovative therapies, outsourcing provides a scalable and cost-effective solution for development and production.

The globalization of clinical trials for advanced therapeutics requires a network of partners with a global presence. Outsourcing facilitates access to diverse patient populations, regulatory environments, and manufacturing capabilities worldwide, supporting efficient and accelerated clinical development.

Historical Advanced Therapeutics Pharmaceutical Outsourcing Market Outlook

The global advanced therapeutics pharmaceutical outsourcing market recorded a historical CAGR of 3.3% from 2019 to 2023. The proliferation of cell and gene therapies represents a transformative shift in healthcare, offering innovative solutions for previously untreatable diseases. The increasing number of companies investing in developing these therapies has created a surge in demand for specialized expertise in manufacturing, quality control, and regulatory compliance.

Cell and gene therapies often involve intricate manufacturing processes, including gene editing, viral vector production, and cell culturing. Outsourcing allows pharmaceutical companies to tap into the specialized capabilities of contract manufacturing organizations (CMOs) with advanced facilities and expertise in these complex processes.

The variability in the production scale for cell and gene therapies, ranging from patient-specific treatments to large-scale manufacturing, necessitates a flexible and scalable approach. Outsourcing allows companies to adjust production volumes based on the specific requirements of their therapies without significant capital investment.

The regulatory landscape for cell and gene therapies is evolving rapidly. Outsourcing partners with a deep understanding of regulatory requirements can guide pharmaceutical companies through the complex approval processes, ensuring compliance and facilitating a smoother path to market.

The increasing adoption of cell and gene therapies is a pivotal driver propelling the growth of the advanced therapeutics pharmaceutical outsourcing market. As pharmaceutical companies prioritize these revolutionary treatment modalities, outsourcing partners equipped with specialized capabilities are becoming indispensable contributors to the successful development and commercialization of advanced therapeutics.

Drivers Propelling Advanced Therapeutics Pharmaceutical Outsourcing Market

A notable opportunity in the advanced therapeutics pharmaceutical outsourcing market lies in the expanding landscape of mRNA therapies. The increasing focus on mRNA therapies in cancer, infectious diseases, and genetic disorders presents a compelling opportunity for outsourcing partners. As pharmaceutical companies diversify their portfolios, outsourcing providers can offer specialized support in developing and manufacturing mRNA-based treatments.

The versatility of mRNA technology allows for developing a wide range of therapeutic applications. Outsourcing partners can capitalize on this diversity by providing tailored solutions for different mRNA-based treatments, contributing to expanding treatment options available to patients.

mRNA therapies often require specialized expertise in formulation and delivery methods to enhance efficacy and safety. Outsourcing providers focusing on mRNA can offer valuable insights and capabilities in optimizing these critical aspects of therapeutic development.

Key Advanced Therapeutics Pharmaceutical Outsourcing Market Trends and Analysis

  • Pharmaceutical firms are looking for outsourcing partners who can offer integrated solutions for the full manufacturing and drug development lifecycle.
  • Outsourcing partners with a solid grasp of regulatory standards and a track record of attaining compliance are highly sought after, especially in light of the changing regulatory landscape for innovative medicines.
  • The integration of cutting-edge technology, such as digitalization and automation, is intended to boost productivity and cut expenses in the pharmaceutical development and production processes.
  • In order to take advantage of cost savings, gain access to a variety of talent pools, and establish a foothold in new markets, pharmaceutical companies have kept looking at outsourcing opportunities on a worldwide scale.

Restrictive Factors for Advanced Therapeutics Pharmaceutical Outsourcing Market

The advanced therapeutics pharmaceutical outsourcing market, while experiencing significant growth opportunities, is also subject to several restrictive factors that pose challenges to its seamless development. When collectively considered, these factors can impact the market dynamics and hinder the full realization of its potential.

The primary restrictive factors is the complex and evolving regulatory landscape governing advanced therapeutics. Regulatory agencies face challenges in establishing clear guidelines as these therapies often involve cutting-edge technologies such as gene editing and cell therapy. This uncertainty can lead to delays in approvals and increase compliance burdens, impacting the speed at which outsourcing services can be leveraged.

The intricate nature of advanced therapeutics, including gene and cell therapies, demands sophisticated scientific expertise and technological capabilities. Finding outsourcing partners with the requisite knowledge in these rapidly advancing fields can be challenging. Technical challenges in scaling up production, maintaining quality, and ensuring consistency also contribute to the complexity.

While outsourcing can offer cost efficiencies, the initial investment in advanced therapeutic technologies and the need for specialized facilities can pose financial challenges. Companies can grapple with the cost of technology transfer, validation, and establishing robust quality control measures with outsourcing partners.
Country-wise insights

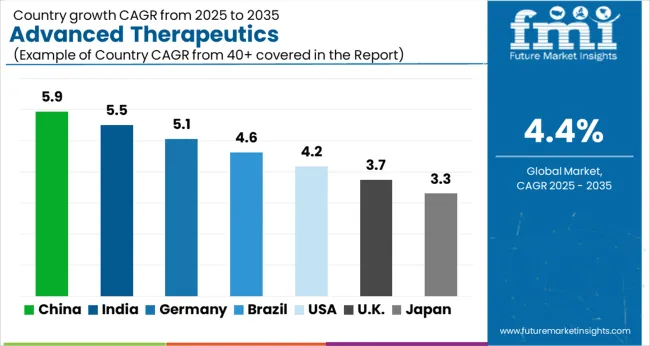
The table below shows the estimated growth rates of the top five countries. China, Japan, and Spain are set to record high CAGRs of 7.0%, 3.2%, and 2.6%, respectively, through 2034.

Countries Value CAGR
United States 1.7%
China 7.0%
Japan 3.2%
Germany 1.6%
Spain 2.6%

Growing Demand for Personalized Medicine to Boost Sales in the United States

The United States dominated the global market with a 32.6% market share in 2023. The country is expected to exhibit a CAGR of 1.7% throughout the forecast period. The growing demand for personalized medicine and targeted therapies has fueled the development of advanced therapeutics. Outsourcing partners in the United States are well-positioned to support pharmaceutical companies in meeting the demands of a rapidly expanding market for personalized treatments.

The regulatory environment in the United States has increasingly supported advanced therapeutic products. Regulatory bodies, such as the United States Food and Drug Administration (FDA), have implemented expedited pathways and initiatives to facilitate the development and approval of innovative therapies. This regulatory support provides a conducive ecosystem for outsourcing partners to navigate regulatory requirements efficiently.

Rising Expertise in Advanced Therapeutics to Uplift China’s Market

In 2023, China held a dominant global revenue in East Asia’s market and contributed a share of 7.9% worldwide. The market is expected to grow at a CAGR of 7.0%.

China has witnessed rapid advancements in biotechnology and pharmaceutical research, leading to the development of cutting-edge technologies in gene and cell therapies. The country's commitment to innovation and growing expertise in advanced therapeutics, attract pharmaceutical companies seeking outsourcing partners with specialized capabilities.

China-based outsourcing partners increasingly participate in global clinical trials, allowing sponsors to conduct studies with a more diverse patient population. This globalization trend aligns with the growing emphasis on multi-regional clinical trials, enhancing the attractiveness of China as a destination for outsourcing services.
Growth in Biopharmaceutical Infrastructure to Drive Germany

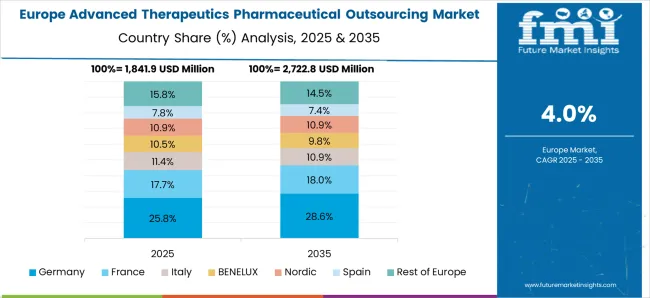
Germany held 4.4% share in the global market in 2023 and is expected to grow at a CAGR of 1.6% during the forecasted period. Germany has established itself as a leading hub for biopharmaceutical innovation, focusing on advanced therapeutics. The country has a thriving biotechnology sector, research institutions, and a collaborative ecosystem that attracts domestic and international companies seeking outsourcing partners with expertise in cutting-edge therapies.

Germany is investing significantly in biopharmaceutical infrastructure, including state-of-the-art manufacturing facilities and research centers. This infrastructure supports outsourcing partners by providing access to cutting-edge technologies and specialized capabilities required for developing and manufacturing advanced therapeutics.
Rising Demand for Cutting-edge Treatments Driving Demand in Japan

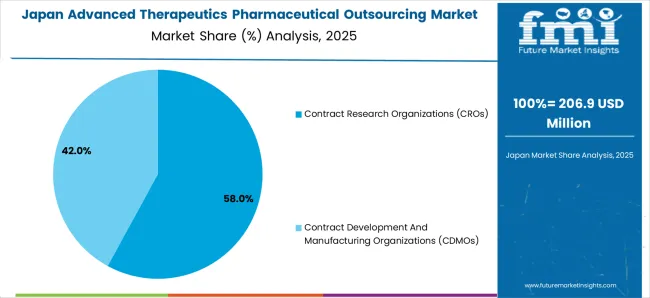
Contract research organizations (CROs) and contract development and manufacturing organizations (CDMOs) are frequently used by pharmaceutical corporations to outsource different phases of the development process in Japan. Clinical trials, preclinical development, early-stage research, and commercial production are a few examples of these services.

Demand for cutting-edge treatments, such as gene and cell therapies, has increased in Japan. Pharmaceutical companies have been compelled by this demand to look outside for resources and experience to expedite development timeframes and manage the challenges of bringing new medicines to market.

Growing Technological Development Activities in Spain to Gain Traction

In sophisticated therapies, pharmaceutical companies frequently collaborate strategically with outsourcing partners in Spain. These partnerships seek to maximize resources, take advantage of each other's expertise, and hasten the creation and introduction of novel treatments. Technological developments like automation, analytics, and process optimization help manufacturers of advanced treatments operate more profitably and efficiently in Spain.

Category-wise Insights

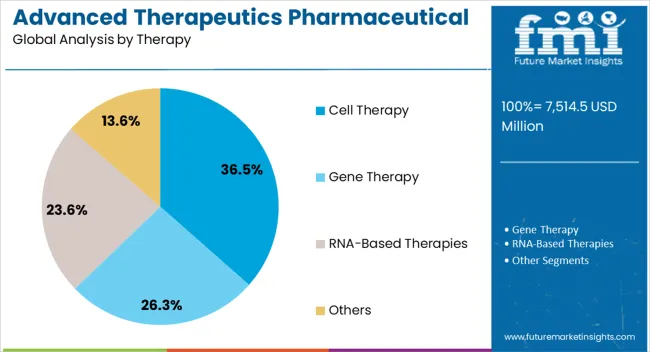
The below section shows the commercial manufacturing and packaging segment dominated by phases category. It is forecast to thrive at an 4.0% CAGR between 2024 and 2034. Based on therapy, the gene therapy segment is anticipated to hold a dominant share through 2034. It is set to exhibit a CAGR of 3.8% during the forecast period.

Segment Value CAGR
Commercial Manufacturing and Packaging (Phases) 4.0%
Gene Therapy (Therapy) 3.8%
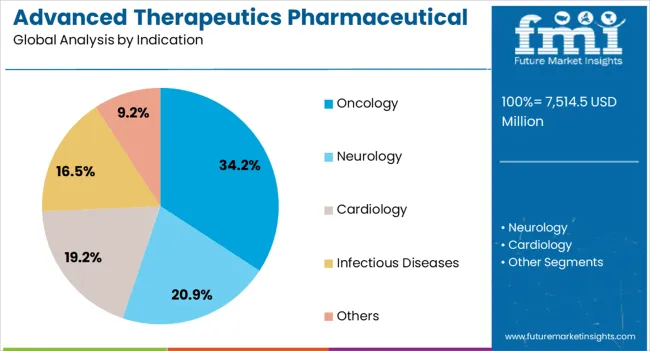
Oncology (Indication) 4.0%
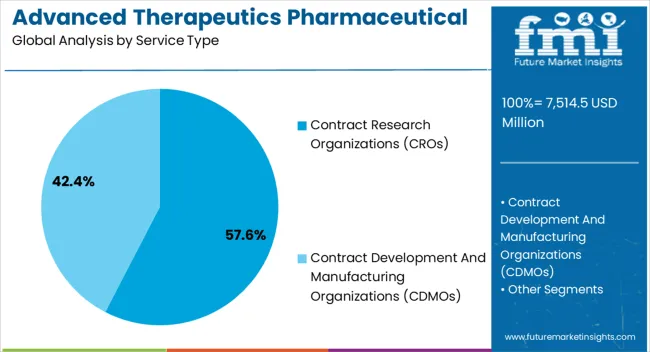
Contract Development and Manufacturing Organizations (CDMOs) (Service Type) 3.7%

Demand to Remain High for Contract Development and Manufacturing Organizations

The contract development and manufacturing organizations (CDMOs) held 56.8% market share in 2023. CDMOs offer scalability and flexibility in manufacturing, allowing pharmaceutical companies to adapt production volumes based on the specific requirements of their therapies.

This flexibility is particularly crucial in the dynamic landscape of advanced therapeutics, where production needs may vary widely. CDMOs lead in the advanced therapeutics pharmaceutical outsourcing market due to their specialized expertise, developed infrastructure, flexibility, risk mitigation capabilities, regulatory compliance, cost efficiency, global reach, and collaborative approach to innovation.

Diversity and Scalability of Oncology to Make them Popular

The oncology market share in advanced therapeutics pharmaceutical outsourcing was 46.1% in 2023. The oncology pipeline is rich with innovative therapies, including gene therapies, CAR-T cell therapies, and mRNA-based treatments.

The diverse nature of these therapies necessitates specialized expertise and infrastructure, making outsourcing a strategic choice for pharmaceutical companies looking to bring novel oncology treatments to market. This trend will continue as the oncology landscape evolves with ongoing scientific and technological advancements.

Commercial Manufacturing and Packaging to Gain Momentum through 2034

Commercial manufacturing and packaging have a considerable presence in the advanced therapeutics pharmaceutical outsourcing market, accounting for 54.9% share in 2023. The commercial manufacturing and packaging services lead the market due to their pivotal role in scaling up production, managing supply chains, and contributing to the overall success of bringing advanced therapeutic products from development to commercialization.

Commercial manufacturing and packaging services are essential for scaling up production from clinical to commercial levels. As advanced therapeutic products progress through clinical trials and receive regulatory approval, the demand for large-scale manufacturing increases, making outsourcing partners with scale-up capabilities indispensable.
Competitive Landscape

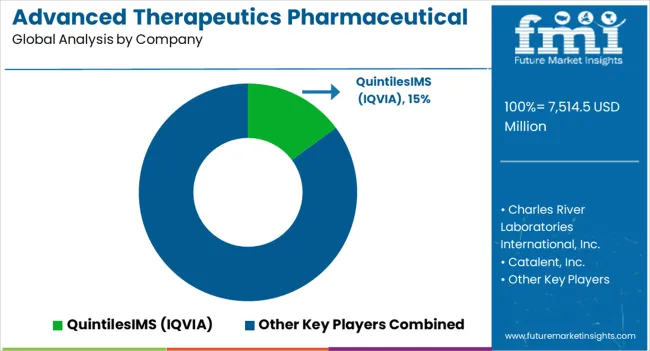
Collaborations and acquisitions are the growth strategies that leading companies employ to enhance their capabilities, service offerings, and stay competitive in the dynamic landscape of advanced therapeutics.

  • In August 2022, Catalent Inc. acquired Metrics Contract Services and Contract Development and Manufacturing Organization (CDMO) in North Carolina.
  • In July 2022, Samsung Biologics Co. planned to double its manufacturing capacity by building four additional plants worth USD 5.3 billion to solidify its leadership in the CDMO market.
  • In June 2022, Avid Bioservices launched analytical and process development labs within its viral vector development and CGMP manufacturing facility.

Scope of the Report

Attribute Details
Estimated Market Size (2024) USD 7,592.8 million
Projected Market Size (2034) USD 11,698.1 million
Anticipated Growth Rate (2024 to 2034) 4.4%
Forecast Period 2024 to 2034
Historical Data Available for 2019 to 2023
Market Analysis USD million for Value
Key Regions Covered North America; Latin America; East Asia; South Asia and Pacific; Western Europe; Eastern Europe; Central Asia; Russia and Belarus; Balkan and Baltic Countries; Middle East and Africa
Key Countries Covered United States, Canada, Mexico, Brazil, Chile, China, Japan, South Korea, Germany, France, Spain, Italy, BENELUX, Nordic Countries, United Kingdom, BENELUX, Poland, Hungary, Romania, India, Association of Southeast Asian Nations Countries, Australia and New Zealand, GCC Countries, South Africa, Türkiye
Key Market Segments Covered Service Type, Indication, Therapy, Phases, and Region
Key Companies Profiled Croda International Plc; Charles River Laboratories International, Inc.; Catalent, Inc.; QuintilesIMS (IQVIA); Parexel International Corporation; ICON plc; PPD, Inc. (Thermo Fisher Scientific); LabCorp (Laboratory Corporation of America Holdings); Syneos Health; WuXi AppTec; Lonza Group; Piramal Pharma Solutions; SGS SA; Evotec SE; CMC Biologics (Now AGC Biologics); Marken (A UPS Company); Cytovance Biologics; Samsung Biologics; CordenPharma; Recipharm AB; Vetter Pharma International GmbH; Cryoport Systems, Inc.; ProPharma Group; Fujifilm Diosynth Biotechnologies; Medpace; Novotech Pty Ltd.; Axcella Health Inc.; CelerionAshland
Report Coverage Market Forecast, Competition Intelligence, Market Dynamics and Challenges, Strategic Growth Initiatives

Advanced Therapeutics Pharmaceutical Outsourcing Industry Segmentation

By Service Type:

  • Contract Research Organizations (CROs)
  • Contract Development and Manufacturing Organizations (CDMOs)

By Indication:

  • Oncology
  • Neurology
  • Cardiology
  • Infectious Diseases
  • Others

By Therapy:

  • Cell Therapy
  • Gene Therapy
  • RNA-based Therapies
  • Others

By Phases:

  • Preclinical Services
  • Clinical Services
  • Commercial Manufacturing and Packaging

By Region:

  • North America
  • Latin America
  • East Asia
  • South Asia and Pacific
  • Western Europe
  • Eastern Europe
  • Middle East and Africa

Table of Content

  • 1. Executive Summary
  • 2. Market Overview
  • 3. Key Market Trends
  • 4. Value Added Insights
  • 5. Market Background
  • 6. Global Market Demand (in Value or Size in USD million) Analysis 2019 to 2023 and Forecast, 2024 to 2034
  • 7. Global Market Analysis 2019 to 2023 and Forecast 2024 to 2034, By Service Type
    • 7.1. Contract Research Organizations (CROs)
    • 7.2. Contract Development and Manufacturing Organizations (CDMOs)
  • 8. Global Market Analysis 2019 to 2023 and Forecast 2024 to 2034, By Indication
    • 8.1. Oncology
    • 8.2. Neurology
    • 8.3. Cardiology
    • 8.4. Infectious Diseases
    • 8.5. Others
  • 9. Global Market Analysis 2019 to 2023 and Forecast 2024 to 2034, By Therapy
    • 9.1. Cell Therapy
    • 9.2. Gene Therapy
    • 9.3. RNA-based Therapies
    • 9.4. Others
  • 10. Global Market Analysis 2019 to 2023 and Forecast 2024 to 2034, By Phases
    • 10.1. Preclinical Services
    • 10.2. Clinical Services
    • 10.3. Commercial Manufacturing and Packaging
  • 11. Global Market Analysis 2019 to 2023 and Forecast 2024 to 2034, By Region
    • 11.1. North America
    • 11.2. Latin America
    • 11.3. East Asia
    • 11.4. South Asia and Pacific
    • 11.5. Western Europe
    • 11.6. Eastern Europe
    • 11.7. Middle East and Africa
  • 12. North America Market Analysis 2019 to 2023 and Forecast 2024 to 2034
  • 13. Latin America Market Analysis 2019 to 2023 and Forecast 2024 to 2034
  • 14. East Asia Market Analysis 2019 to 2023 and Forecast 2024 to 2034
  • 15. South Asia and Pacific Market Analysis 2019 to 2023 and Forecast 2024 to 2034
  • 16. Western Europe Market Analysis 2019 to 2023 and Forecast 2024 to 2034
  • 17. Eastern Europe Market Analysis 2019 to 2023 and Forecast 2024 to 2034
  • 18. Middle East and Africa Market Analysis 2019 to 2023 and Forecast 2024 to 2034
  • 19. Market Structure Analysis
  • 20. Competition Analysis
    • 20.1. Charles River Laboratories International, Inc.
    • 20.2. Catalent, Inc.
    • 20.3. QuintilesIMS (IQVIA)
    • 20.4. Parexel International Corporation
    • 20.5. ICON plc
    • 20.6. PPD, Inc. (Thermo Fisher Scientific)
    • 20.7. LabCorp (Laboratory Corporation of America Holdings)
    • 20.8. Syneos Health
    • 20.9. WuXi AppTec
    • 20.10. Lonza Group
    • 20.11. Piramal Pharma Solutions
    • 20.12. SGS SA
    • 20.13. Evotec SE
    • 20.14. CMC Biologics (Now AGC Biologics)
    • 20.15. Marken (A UPS Company)
    • 20.16. Cytovance Biologics
    • 20.17. Samsung Biologics
    • 20.18. CordenPharma
    • 20.19. Recipharm AB
    • 20.20. Vetter Pharma International GmbH
    • 20.21. Cryoport Systems, Inc.
    • 20.22. ProPharma Group
    • 20.23. Fujifilm Diosynth Biotechnologies
    • 20.24. Medpace
    • 20.25. Novotech Pty Ltd.
    • 20.26. Axcella Health Inc.
    • 20.27. Celerion
  • 21. Assumptions and Acronyms Used
  • 22. Research Methodology

List of Tables

Table 1: Global Market Value (US$ million) Analysis 2019 to 2023 and Forecast 2024 to 2034, By Service Type

Table 2: Global Market Value (US$ million) Analysis 2019 to 2023 and Forecast 2024 to 2034, By Indication

Table 3: Global Market Value (US$ million) Analysis 2019 to 2023 and Forecast 2024 to 2034, By Therapy

Table 4: Global Market Value (US$ million) Analysis 2019 to 2023 and Forecast 2024 to 2034, By Phases

Table 5: Global Market Size (US$ million) Analysis 2019 to 2023 and Forecast 2024 to 2034, By Region

Table 6: North America Market Value (US$ million) Analysis 2019 to 2023 and Forecast 2024 to 2034, By Country

Table 7: North America Market Value (US$ million) Analysis 2019 to 2023 and Forecast 2024 to 2034, By Service Type

Table 8: North America Market Value (US$ million) Analysis 2019 to 2023 and Forecast 2024 to 2034, By Indication

Table 9: North America Market Value (US$ million) Analysis 2019 to 2023 and Forecast 2024 to 2034, By Therapy

Table 10: North America Market Value (US$ million) Analysis 2019 to 2023 and Forecast 2024 to 2034, By Phases

Table 11: United States Market Value (US$ million) Analysis 2019 to 2023 and Forecast 2024 to 2034, By Service Type

Table 12: United States Market Value (US$ million) Analysis 2019 to 2023 and Forecast 2024 to 2034, By Indication

Table 13: United States Market Value (US$ million) Analysis 2019 to 2023 and Forecast 2024 to 2034, By Therapy

Table 14: United States Market Value (US$ million) Analysis 2019 to 2023 and Forecast 2024 to 2034, By Phases

Table 15: Canada Market Value (US$ million) Analysis 2019 to 2023 and Forecast 2024 to 2034, By Service Type

Table 16: Canada Market Value (US$ million) Analysis 2019 to 2023 and Forecast 2024 to 2034, By Indication

Table 17: Canada Market Value (US$ million) Analysis 2019 to 2023 and Forecast 2024 to 2034, By Therapy

Table 18: Canada Market Value (US$ million) Analysis 2019 to 2023 and Forecast 2024 to 2034, By Phases

Table 19: Mexico Market Value (US$ million) Analysis 2019 to 2023 and Forecast 2024 to 2034, By Service Type

Table 20: Mexico Market Value (US$ million) Analysis 2019 to 2023 and Forecast 2024 to 2034, By Indication

Table 21: Mexico Market Value (US$ million) Analysis 2019 to 2023 and Forecast 2024 to 2034, By Therapy

Table 22: Mexico Market Value (US$ million) Analysis 2019 to 2023 and Forecast 2024 to 2034, By Phases

Table 23: Latin America Market Value (US$ million) Analysis 2019 to 2023 and Forecast 2024 to 2034, By Country

Table 24: Latin America Market Value (US$ million) Analysis 2019 to 2023 and Forecast 2024 to 2034, By Service Type

Table 25: Latin America Market Value (US$ million) Analysis 2019 to 2023 and Forecast 2024 to 2034, By Indication

Table 26: Latin America Market Value (US$ million) Analysis 2019 to 2023 and Forecast 2024 to 2034, By Therapy

Table 27: Latin America Market Value (US$ million) Analysis 2019 to 2023 and Forecast 2024 to 2034, By Phases

Table 28: Brazil Market Value (US$ million) Analysis 2019 to 2023 and Forecast 2024 to 2034, By Service Type

Table 29: Brazil Market Value (US$ million) Analysis 2019 to 2023 and Forecast 2024 to 2034, By Indication

Table 30: Brazil Market Value (US$ million) Analysis 2019 to 2023 and Forecast 2024 to 2034, By Therapy

Table 31: Brazil Market Value (US$ million) Analysis 2019 to 2023 and Forecast 2024 to 2034, By Phases

Table 32: Chile Market Value (US$ million) Analysis 2019 to 2023 and Forecast 2024 to 2034, By Service Type

Table 33: Chile Market Value (US$ million) Analysis 2019 to 2023 and Forecast 2024 to 2034, By Indication

Table 34: Chile Market Value (US$ million) Analysis 2019 to 2023 and Forecast 2024 to 2034, By Therapy

Table 35: Chile Market Value (US$ million) Analysis 2019 to 2023 and Forecast 2024 to 2034, By Phases

Table 36: East Asia Market Value (US$ million) Analysis 2019 to 2023 and Forecast 2024 to 2034, By Country

Table 37: East Asia Market Value (US$ million) Analysis 2019 to 2023 and Forecast 2024 to 2034, By Service Type

Table 38: East Asia Market Value (US$ million) Analysis 2019 to 2023 and Forecast 2024 to 2034, By Indication

Table 39: East Asia Market Value (US$ million) Analysis 2019 to 2023 and Forecast 2024 to 2034, By Therapy

Table 40: East Asia Market Value (US$ million) Analysis 2019 to 2023 and Forecast 2024 to 2034, By Phases

Table 41: China Market Value (US$ million) Analysis 2019 to 2023 and Forecast 2024 to 2034, By Service Type

Table 42: China Market Value (US$ million) Analysis 2019 to 2023 and Forecast 2024 to 2034, By Indication

Table 43: China Market Value (US$ million) Analysis 2019 to 2023 and Forecast 2024 to 2034, By Therapy

Table 44: China Market Value (US$ million) Analysis 2019 to 2023 and Forecast 2024 to 2034, By Phases

Table 45: Japan Market Value (US$ million) Analysis 2019 to 2023 and Forecast 2024 to 2034, By Service Type

Table 46: Japan Market Value (US$ million) Analysis 2019 to 2023 and Forecast 2024 to 2034, By Indication

Table 47: Japan Market Value (US$ million) Analysis 2019 to 2023 and Forecast 2024 to 2034, By Therapy

Table 48: Japan Market Value (US$ million) Analysis 2019 to 2023 and Forecast 2024 to 2034, By Phases

Table 49: South Korea Market Value (US$ million) Analysis 2019 to 2023 and Forecast 2024 to 2034, By Service Type

Table 50: South Korea Market Value (US$ million) Analysis 2019 to 2023 and Forecast 2024 to 2034, By Indication

Table 51: South Korea Market Value (US$ million) Analysis 2019 to 2023 and Forecast 2024 to 2034, By Therapy

Table 52: South Korea Market Value (US$ million) Analysis 2019 to 2023 and Forecast 2024 to 2034, By Phases

Table 53: South Asia and Pacific Market Value (US$ million) Analysis 2019 to 2023 and Forecast 2024 to 2034, By Country

Table 54: South Asia and Pacific Market Value (US$ million) Analysis 2019 to 2023 and Forecast 2024 to 2034, By Service Type

Table 55: South Asia and Pacific Market Value (US$ million) Analysis 2019 to 2023 and Forecast 2024 to 2034, By Indication

Table 56: South Asia and Pacific Market Value (US$ million) Analysis 2019 to 2023 and Forecast 2024 to 2034, By Therapy

Table 57: South Asia and Pacific Market Value (US$ million) Analysis 2019 to 2023 and Forecast 2024 to 2034, By Phases

Table 58: India Market Value (US$ million) Analysis 2019 to 2023 and Forecast 2024 to 2034, By Service Type

Table 59: India Market Value (US$ million) Analysis 2019 to 2023 and Forecast 2024 to 2034, By Indication

Table 60: India Market Value (US$ million) Analysis 2019 to 2023 and Forecast 2024 to 2034, By Therapy

Table 61: India Market Value (US$ million) Analysis 2019 to 2023 and Forecast 2024 to 2034, By Phases

Table 62: Association of Southeast Asian Nations Countries Market Value (US$ million) Analysis 2019 to 2023 and Forecast 2024 to 2034, By Service Type

Table 63: Association of Southeast Asian Nations Countries Market Value (US$ million) Analysis 2019 to 2023 and Forecast 2024 to 2034, By Indication

Table 64: Association of Southeast Asian Nations Countries Market Value (US$ million) Analysis 2019 to 2023 and Forecast 2024 to 2034, By Therapy

Table 65: Association of Southeast Asian Nations Countries Market Value (US$ million) Analysis 2019 to 2023 and Forecast 2024 to 2034, By Phases

Table 66: Australia and New Zealand Market Value (US$ million) Analysis 2019 to 2023 and Forecast 2024 to 2034, By Service Type

Table 67: Australia and New Zealand Market Value (US$ million) Analysis 2019 to 2023 and Forecast 2024 to 2034, By Indication

Table 68: Australia and New Zealand Market Value (US$ million) Analysis 2019 to 2023 and Forecast 2024 to 2034, By Therapy

Table 69: Australia and New Zealand Market Value (US$ million) Analysis 2019 to 2023 and Forecast 2024 to 2034, By Phases

Table 70: Western Europe Market Value (US$ million) Analysis 2019 to 2023 and Forecast 2024 to 2034, By Country

Table 71: Western Europe Market Value (US$ million) Analysis 2019 to 2023 and Forecast 2024 to 2034, By Service Type

Table 72: Western Europe Market (Units) Analysis 2019 to 2023 and Forecast 2024 to 2034, By Service Type

Table 73: Western Europe Market Value (US$ million) Analysis 2019 to 2023 and Forecast 2024 to 2034, By Indication

Table 74: Western Europe Market Value (US$ million) Analysis 2019 to 2023 and Forecast 2024 to 2034, By Therapy

Table 75: Western Europe Market Value (US$ million) Analysis 2019 to 2023 and Forecast 2024 to 2034, By Phases

Table 76: Germany Market Value (US$ million) Analysis 2019 to 2023 and Forecast 2024 to 2034, By Service Type

Table 77: Germany Market Value (US$ million) Analysis 2019 to 2023 and Forecast 2024 to 2034, By Indication

Table 78: Germany Market Value (US$ million) Analysis 2019 to 2023 and Forecast 2024 to 2034, By Therapy

Table 79: Germany Market Value (US$ million) Analysis 2019 to 2023 and Forecast 2024 to 2034, By Phases

Table 80: Italy Market Value (US$ million) Analysis 2019 to 2023 and Forecast 2024 to 2034, By Service Type

Table 81: Italy Market Value (US$ million) Analysis 2019 to 2023 and Forecast 2024 to 2034, By Indication

Table 82: Italy Market Value (US$ million) Analysis 2019 to 2023 and Forecast 2024 to 2034, By Therapy

Table 83: Italy Market Value (US$ million) Analysis 2019 to 2023 and Forecast 2024 to 2034, By Phases

Table 84: France Market Value (US$ million) Analysis 2019 to 2023 and Forecast 2024 to 2034, By Service Type

Table 85: France Market Value (US$ million) Analysis 2019 to 2023 and Forecast 2024 to 2034, By Indication

Table 86: France Market Value (US$ million) Analysis 2019 to 2023 and Forecast 2024 to 2034, By Therapy

Table 87: France Market Value (US$ million) Analysis 2019 to 2023 and Forecast 2024 to 2034, By Phases

Table 88: United Kingdom Market Value (US$ million) Analysis 2019 to 2023 and Forecast 2024 to 2034, By Service Type

Table 89: United Kingdom Market Value (US$ million) Analysis 2019 to 2023 and Forecast 2024 to 2034, By Indication

Table 90: United Kingdom Market Value (US$ million) Analysis 2019 to 2023 and Forecast 2024 to 2034, By Therapy

Table 91: United Kingdom Market Value (US$ million) Analysis 2019 to 2023 and Forecast 2024 to 2034, By Phases

Table 92: Spain Market Value (US$ million) Analysis 2019 to 2023 and Forecast 2024 to 2034, By Service Type

Table 93: Spain Market Value (US$ million) Analysis 2019 to 2023 and Forecast 2024 to 2034, By Indication

Table 94: Spain Market Value (US$ million) Analysis 2019 to 2023 and Forecast 2024 to 2034, By Therapy

Table 95: Spain Market Value (US$ million) Analysis 2019 to 2023 and Forecast 2024 to 2034, By Phases

Table 96: BENELUX Market Value (US$ million) Analysis 2019 to 2023 and Forecast 2024 to 2034, By Service Type

Table 97: BENELUX Market Value (US$ million) Analysis 2019 to 2023 and Forecast 2024 to 2034, By Indication

Table 98: BENELUX Market Value (US$ million) Analysis 2019 to 2023 and Forecast 2024 to 2034, By Therapy

Table 99: BENELUX Market Value (US$ million) Analysis 2019 to 2023 and Forecast 2024 to 2034, By Phases

Table 100: Nordic Countries Market Value (US$ million) Analysis 2019 to 2023 and Forecast 2024 to 2034, By Service Type

Table 101: Nordic Countries Market Value (US$ million) Analysis 2019 to 2023 and Forecast 2024 to 2034, By Indication

Table 102: Nordic Countries Market Value (US$ million) Analysis 2019 to 2023 and Forecast 2024 to 2034, By Therapy

Table 103: Nordic Countries Market Value (US$ million) Analysis 2019 to 2023 and Forecast 2024 to 2034, By Phases

Table 104: Eastern Europe Market Value (US$ million) Analysis 2019 to 2023 and Forecast 2024 to 2034, By Country

Table 105: Eastern Europe Market Value (US$ million) Analysis 2019 to 2023 and Forecast 2024 to 2034, By Service Type

Table 106: Eastern Europe Market Value (US$ million) Analysis 2019 to 2023 and Forecast 2024 to 2034, By Indication

Table 107: Eastern Europe Market Value (US$ million) Analysis 2019 to 2023 and Forecast 2024 to 2034, By Therapy

Table 108: Eastern Europe Market Value (US$ million) Analysis 2019 to 2023 and Forecast 2024 to 2034, By Phases

Table 109: Russia Market Value (US$ million) Analysis 2019 to 2023 and Forecast 2024 to 2034, By Service Type

Table 110: Russia Market Value (US$ million) Analysis 2019 to 2023 and Forecast 2024 to 2034, By Indication

Table 111: Russia Market Value (US$ million) Analysis 2019 to 2023 and Forecast 2024 to 2034, By Therapy

Table 112: Russia Market Value (US$ million) Analysis 2019 to 2023 and Forecast 2024 to 2034, By Phases

Table 113: Hungary Market Value (US$ million) Analysis 2019 to 2023 and Forecast 2024 to 2034, By Service Type

Table 114: Hungary Market Value (US$ million) Analysis 2019 to 2023 and Forecast 2024 to 2034, By Indication

Table 115: Hungary Market Value (US$ million) Analysis 2019 to 2023 and Forecast 2024 to 2034, By Therapy

Table 116: Hungary Market Value (US$ million) Analysis 2019 to 2023 and Forecast 2024 to 2034, By Phases

Table 117: Poland Market Value (US$ million) Analysis 2019 to 2023 and Forecast 2024 to 2034, By Service Type

Table 118: Poland Market Value (US$ million) Analysis 2019 to 2023 and Forecast 2024 to 2034, By Indication

Table 119: Poland Market Value (US$ million) Analysis 2019 to 2023 and Forecast 2024 to 2034, By Therapy

Table 120: Poland Market Value (US$ million) Analysis 2019 to 2023 and Forecast 2024 to 2034, By Phases

Table 121: Middle East and Africa Market Value (US$ million) Analysis 2019 to 2023 and Forecast 2024 to 2034, By Country

Table 122: Middle East and Africa Market Value (US$ million) Analysis 2019 to 2023 and Forecast 2024 to 2034, By Service Type

Table 123: Middle East and Africa Market Value (US$ million) Analysis 2019 to 2023 and Forecast 2024 to 2034, By Indication

Table 124: Middle East and Africa Market Value (US$ million) Analysis 2019 to 2023 and Forecast 2024 to 2034, By Therapy

Table 125: Middle East and Africa Market Value (US$ million) Analysis 2019 to 2023 and Forecast 2024 to 2034, By Phases

Table 126: Saudi Arabia Market Value (US$ million) Analysis 2019 to 2023 and Forecast 2024 to 2034, By Service Type

Table 127: Saudi Arabia Market Value (US$ million) Analysis 2019 to 2023 and Forecast 2024 to 2034, By Indication

Table 128: Saudi Arabia Market Value (US$ million) Analysis 2019 to 2023 and Forecast 2024 to 2034, By Therapy

Table 129: Saudi Arabia Market Value (US$ million) Analysis 2019 to 2023 and Forecast 2024 to 2034, By Phases

Table 130: Türkiye Market Value (US$ million) Analysis 2019 to 2023 and Forecast 2024 to 2034, By Service Type

Table 131: Türkiye Market Value (US$ million) Analysis 2019 to 2023 and Forecast 2024 to 2034, By Indication

Table 132: Türkiye Market Value (US$ million) Analysis 2019 to 2023 and Forecast 2024 to 2034, By Therapy

Table 133: Türkiye Market Value (US$ million) Analysis 2019 to 2023 and Forecast 2024 to 2034, By Phases

Table 134: South Africa Market Value (US$ million) Analysis 2019 to 2023 and Forecast 2024 to 2034, By Service Type

Table 135: South Africa Market Value (US$ million) Analysis 2019 to 2023 and Forecast 2024 to 2034, By Indication

Table 136: South Africa Market Value (US$ million) Analysis 2019 to 2023 and Forecast 2024 to 2034, By Therapy

Table 137: South Africa Market Value (US$ million) Analysis 2019 to 2023 and Forecast 2024 to 2034, By Phases

Table 138: Other Africa Union Market Value (US$ million) Analysis 2019 to 2023 and Forecast 2024 to 2034, By Service Type

Table 139: Other Africa Union Market Value (US$ million) Analysis 2019 to 2023 and Forecast 2024 to 2034, By Indication

Table 140: Other Africa Union Market Value (US$ million) Analysis 2019 to 2023 and Forecast 2024 to 2034, By Therapy

Table 141: Other Africa Union Market Value (US$ million) Analysis 2019 to 2023 and Forecast 2024 to 2034, By Phases

List of Figures

Figure 1: Global Market Value Share By Service Type 2023 (A)

Figure 2: Global Market Value Share By Indication 2023 (A)

Figure 3: Global Market Value Share By Therapy 2023 (A)

Figure 4: Global Market Value Share By Phases 2023 (A)

Figure 5: Global Market Value Share By Country 2023 (A)

Figure 6: Global Market Value Analysis (US$ million), 2019 to 2023

Figure 7: Global Market Value Forecast (US$ million), 2024 to 2034

Figure 8: Global Market Absolute $ Opportunity, 2024 to 2034

Figure 9: Global Market Share Analysis (%), By Service Type, 2024 (E) to 2034 (F)

Figure 10: Global Market Y-o-Y Analysis (%), By Service Type, 2024 to 2034

Figure 11: Global Market Attractiveness Analysis, By Service Type

Figure 12: Global Market Share Analysis (%), By Indication , 2024 (E) to 2034 (F)

Figure 13: Global Market Y-o-Y Analysis (%), By Indication, 2024 to 2034

Figure 14: Global Market Attractiveness Analysis, By Indication

Figure 15: Global Market Share Analysis (%), By Therapy, 2024 (E) to 2034 (F)

Figure 16: Global Market Y-o-Y Analysis (%), By Therapy, 2024 to 2034

Figure 17: Global Market Attractiveness Analysis, By Therapy

Figure 18: Global Market Share Analysis (%), By Phases, 2024 (E) to 2034 (F)

Figure 19: Global Market Y-o-Y Analysis (%), By Phases, 2024 to 2034

Figure 20: Global Market Attractiveness Analysis, By Phases

Figure 21: Global Market Share Analysis (%), By Region, 2024 (E) to 2034 (F)

Figure 22: Global Market Y-o-Y Analysis (%), By Region, 2024 to 2034

Figure 23: Global Market Attractiveness Analysis By Region, 2024 to 2034

Figure 24: North America Market Value Share By Service Type 2023 (A)

Figure 25: North America Market Value Share By Indication 2023 (A)

Figure 26: North America Market Value Share By Therapy 2023 (A)

Figure 27: North America Market Value Share By Phases 2023 (A)

Figure 28: North America Market Value Share By Country 2023 (A)

Figure 29: North America Market Value (US$ million) Analysis, 2019 to 2023

Figure 30: North America Market Forecast and Y-o-Y growth, 2024 to 2034

Figure 31: North America Market Attractiveness Analysis By Service Type, 2024 to 2034

Figure 32: North America Market Attractiveness Analysis By Indication, 2024 to 2034

Figure 33: North America Market Attractiveness Analysis By Therapy, 2024 to 2034

Figure 34: North America Market Attractiveness Analysis By Phases, 2024 to 2034

Figure 35: North America Market Attractiveness Analysis By Country, 2024 to 2034

Figure 36: Latin America Market Value Share By Service Type 2023 (A)

Figure 37: Latin America Market Value Share By Indication 2023 (A)

Figure 38: Latin America Market Value Share By Therapy 2023 (A)

Figure 39: Latin America Market Value Share By Phases 2023 (A)

Figure 40: Latin America Market Value Share By Country 2023 (A)

Figure 41: Latin America Market Value (US$ million) Analysis, 2019 to 2023

Figure 42: Latin America Market Forecast and Y-o-Y growth, 2024 to 2034

Figure 43: Latin America Market Attractiveness Analysis By Service Type, 2024 to 2034

Figure 44: Latin America Market Attractiveness Analysis By Indication, 2024 to 2034

Figure 45: Latin America Market Attractiveness Analysis By Therapy, 2024 to 2034

Figure 46: Latin America Market Attractiveness Analysis By Phases, 2024 to 2034

Figure 47: Latin America Market Attractiveness Analysis By Country, 2024 to 2034

Figure 48: East Asia Market Value Share By Service Type 2023 (A)

Figure 49: East Asia Market Value Share By Indication 2023 (A)

Figure 50: East Asia Market Value Share By Therapy 2023 (A)

Figure 51: East Asia Market Value Share By Phases 2023 (A)

Figure 52: East Asia Market Value Share By Country 2023 (A)

Figure 53: East Asia Market Value (US$ million) Analysis, 2019 to 2023

Figure 54: East Asia Market Forecast and Y-o-Y growth, 2024 to 2034

Figure 55: East Asia Market Attractiveness Analysis By Service Type, 2024 to 2034

Figure 56: East Asia Market Attractiveness Analysis By Indication, 2024 to 2034

Figure 57: East Asia Market Attractiveness Analysis By Therapy, 2024 to 2034

Figure 58: East Asia Market Attractiveness Analysis By Phases, 2024 to 2034

Figure 59: East Asia Market Attractiveness Analysis By Country, 2024 to 2034

Figure 60: South Asia and Pacific Market Value Share By Service Type 2023 (A)

Figure 61: South Asia and Pacific Market Value Share By Indication 2023 (A)

Figure 62: South Asia and Pacific Market Value Share By Therapy 2023 (A)

Figure 63: South Asia and Pacific Market Value Share By Phases 2023 (A)

Figure 64: South Asia and Pacific Market Value Share By Country 2023 (A)

Figure 65: South Asia and Pacific Market Value (US$ million) Analysis, 2019 to 2023

Figure 66: South Asia and Pacific Market Forecast and Y-o-Y growth, 2024 to 2034

Figure 67: South Asia and Pacific Market Attractiveness Analysis By Service Type, 2024 to 2034

Figure 68: South Asia and Pacific Market Attractiveness Analysis By Indication, 2024 to 2034

Figure 69: South Asia and Pacific Market Attractiveness Analysis By Therapy, 2024 to 2034

Figure 70: South Asia and Pacific Market Attractiveness Analysis By Phases, 2024 to 2034

Figure 71: South Asia and Pacific Market Attractiveness Analysis By Country, 2024 to 2034

Figure 72: Western Europe Market Value Share By Service Type 2023 (A)

Figure 73: Western Europe Market Value Share By Indication 2023 (A)

Figure 74: Western Europe Market Value Share By Therapy 2023 (A)

Figure 75: Western Europe Market Value Share By Phases 2023 (A)

Figure 76: Western Europe Market Value Share By Country 2023 (A)

Figure 77: Western Europe Market Value (US$ million) Analysis, 2019 to 2023

Figure 78: Western Europe Market Forecast and Y-o-Y growth, 2024 to 2034

Figure 79: Western Europe Market Attractiveness Analysis By Service Type, 2024 to 2034

Figure 80: Western Europe Market Attractiveness Analysis By Indication, 2024 to 2034

Figure 81: Western Europe Market Attractiveness Analysis By Therapy, 2024 to 2034

Figure 82: Western Europe Market Attractiveness Analysis By Phases, 2024 to 2034

Figure 83: Western Europe Market Attractiveness Analysis By Country, 2024 to 2034

Figure 84: Eastern Europe Market Value Share By Service Type 2023 (A)

Figure 85: Eastern Europe Market Value Share By Indication 2023 (A)

Figure 86: Eastern Europe Market Value Share By Therapy 2023 (A)

Figure 87: Eastern Europe Market Value Share By Phases 2023 (A)

Figure 88: Eastern Europe Market Value Share By Country 2023 (A)

Figure 89: Eastern Europe Market Value (US$ million) Analysis, 2019 to 2023

Figure 90: Eastern Europe Market Forecast and Y-o-Y growth, 2024 to 2034

Figure 91: Eastern Europe Market Attractiveness Analysis By Service Type, 2024 to 2034

Figure 92: Eastern Europe Market Attractiveness Analysis By Indication, 2024 to 2034

Figure 93: Eastern Europe Market Attractiveness Analysis By Therapy, 2024 to 2034

Figure 94: : Eastern Europe Market Attractiveness Analysis By Phases, 2024 to 2034

Figure 95: : Eastern Europe Market Attractiveness Analysis By Country, 2024 to 2034

Figure 96: : Middle East and Africa Market Value Share By Service Type 2023 (A)

Figure 97: : Middle East and Africa Market Value Share By Indication 2023 (A)

Figure 98: : Middle East and Africa Market Value Share By Therapy 2023 (A)

Figure 99: : Middle East and Africa Market Value Share By Phases 2023 (A)

Figure 100: : Middle East and Africa Market Value Share By Country 2023 (A)

Figure 101: : Middle East and Africa Market Value (US$ million) Analysis, 2019 to 2023

Figure 102: : Middle East and Africa Market Forecast and Y-o-Y growth, 2024 to 2034

Figure 103: : Middle East and Africa Market Attractiveness Analysis By Service Type, 2024 to 2034

Figure 104: : Middle East and Africa Market Attractiveness Analysis By Indication, 2024 to 2034

Figure 105: : Middle East and Africa Market Attractiveness Analysis By Therapy, 2024 to 2034

Figure 106: : Middle East and Africa Market Attractiveness Analysis By Phases, 2024 to 2034

Figure 107: : Middle East and Africa Market Attractiveness Analysis By Country, 2024 to 2034

Frequently Asked Questions

How big was the global market in 2023?

The global market was valued at USD 7,197.8 million in 2023.

What is the global market’s projected value for 2034?

The global market is set to reach a valuation of around USD 11,698.1 million in 2034.

What was the historical CAGR for the global market?

Demand in the global market increased at a 3.3% CAGR from 2019 to 2023.

What value is the global market estimated to reach by 2024?

The global market is estimated to reach USD 7,592.8 million by 2024.

What is the United States market outlook?

The United States accounted for around 32.6% share of the global market in 2023.

What is Germany’s market outlook?

Germany held around 4.4% share in the global market in 2023.

What is the outlook for China’s market?

China accounted for a market value share of around 7.9% in 2023 in the global market.

Explore Similar Insights

Future Market Insights

Advanced Therapeutics Pharmaceutical Outsourcing Market